Real Time Crowding Information (RTCI) Provision - Yizhou Zhang - Master of Science Thesis Stockholm /2015/ - Kth Diva ...
←
→
Page content transcription
If your browser does not render page correctly, please read the page content below
Real Time Crowding Information
              (RTCI) Provision

                  Yizhou Zhang

             Master of Science Thesis
                    Stockholm /2015/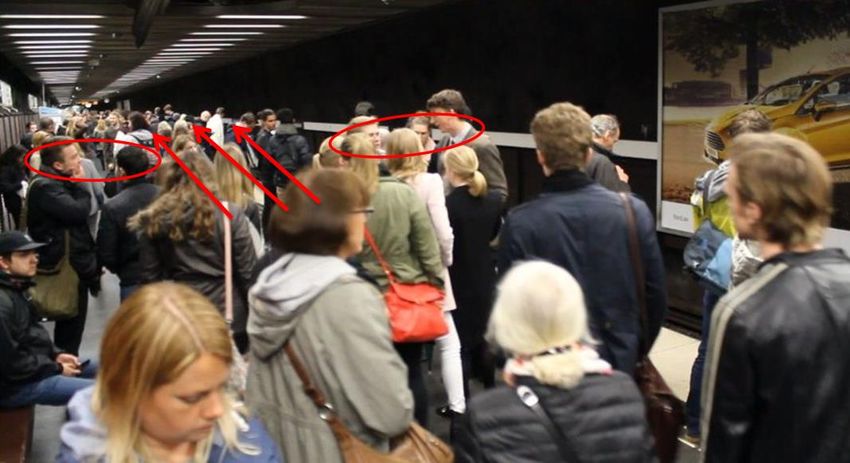
Yizhou Zhang

Real Time Crowding Information (RTCI) Provision
         Impacts and Proposed Technical Solution

                      Supervisor:
                      Karl Kottenhoff
                      Anders Lindahl
                      Jan Magnusson
                      Albania Nissan
                      Examiner:
                      Monika Olsson

               Master of Science Thesis
                     STOCKHOLM /2015/

                     PRESENTED AT

  INDUSTRIAL ECOLOGY
ROYAL INSTITUTE OF TECHNOLOGY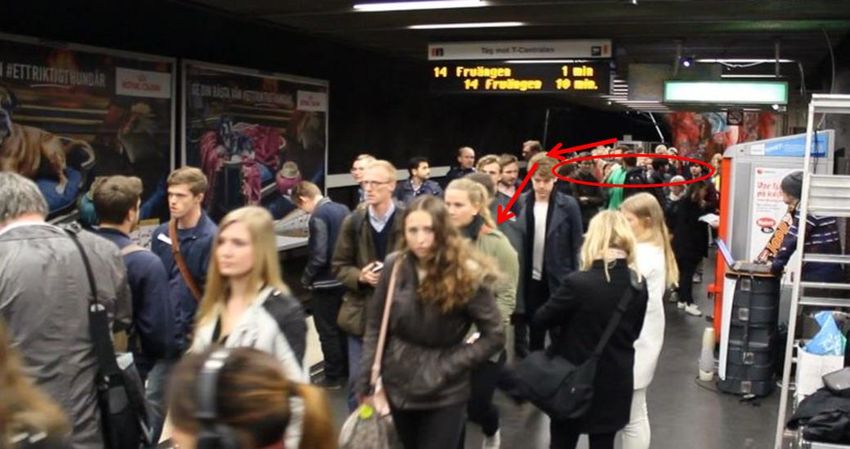
"If you change nothing, nothing will change."
                                       - Anonymous

                      1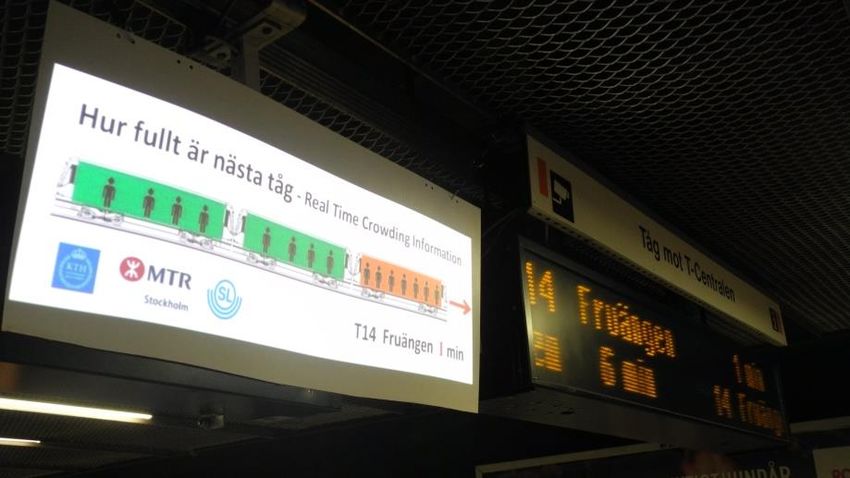
2
Acknowledgements
FirstI would like to express my deepest gratitude to Dr. Karl Kottenhoff, my
supervisor at KTH Royal Institute of Technology and Jan Magnusson, my supervisor
at MTR Stockholm AB, for giving inspiration and support in this thesis work. I would
like to givea special thank for Transport Science department to accept my idea and
give me valuable knowledge in public transport.

I also would like to thank Anders Lindahl, my supervisor at KTH for all helps and
supports in practical test and project management. I would like to take the
opportunity to thank Sheron Fernando, the metro station manager in Tekniska
Högskolan station from MTR, Yisak Abraham, IT-Support technician at KTH and
Björn Jonzon, my karate teacher in Stockholm. With limited budget for practical test,
it would be impossible to continue the research without their support.

I am grateful to Mikael Ringman Olsson who works as business analyst at MTR and
Isak Rubensson from SL (Stockholm Public Transport) for their help and valuable
feedbacks. Many thanks to Assoc. Prof. Albania Nissan who is the director of
undergraduate and master studies at Transport Planning, Economics and Engineering
(TEE) Division for allowing me to finish my master thesis in her division.

Last but not least, I appreciate the support and love from my parents in China.
Without their support, it will be impossible for me to come to Stockholm and study at
KTH.

                                          3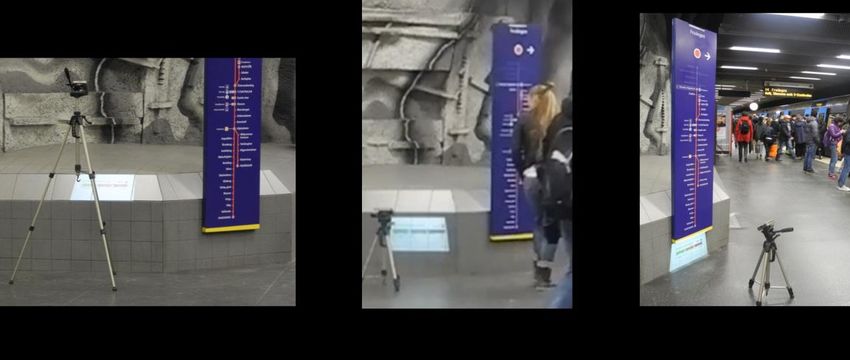
Abstract
The increasing population leads to higher passenger travel demand in Stockholm. The
public transport becomes more and more crowded in rush hours. However, passengers
carry out decisions usually based on limited traffic information and their travel
experience. Passengers cannot take the initiative to avoid crowding based on existing
SL traffic information. Real time crowding information (RTCI) research aims to help
passenger to have more initiative to plan their travel in metro system, and assist
operator to have higher space utilization efficiency. RTCI system contains4
subsystems: projection system, communication system, speaker system and recording
system. The practical test was applied in Tekniska Högskolan metro station for two
weeks in May 2015 with the permission from SL.

The triangle analysis was applied to analyze the impacts of RTCI. The
analysiscontains three analysis methods: passenger load data analysis, video record
analysis and interview result analysis. The interview result shows RTCI increased
round nine tenth of passengers ‘satisfaction and 43% of interviewees thought it
was very useful for them. The calculation based on video record and interview result
shows that 25% of passengers consulted this information and changed their
behaviors on platform. According to the video record, the path became wider and
passenger flow became smoother while RTCI system was activated. Passenger
distribution was more even in metro based on passenger load data. The number of
passengers who got into last unit train increased 8%, and the number in first and
second unit train decreased 4% during RTCI practical test.

The thesis mainly focused to analyze the impacts of RTCI instead of solving technical
challenges. But the technical solution for RTCI system was proposed in thesis. The
concept - “Smart Travel” was discussed in chapter11 which mainly considers travel
time, crowding information and travel cost as most important factors to passenger.

Keywords
Passenger distribution, Real time information, Passenger satisfaction, Crowding
prediction, Passenger flow, Projection system, Speaker system, Practical test,
Stockholm

                                          4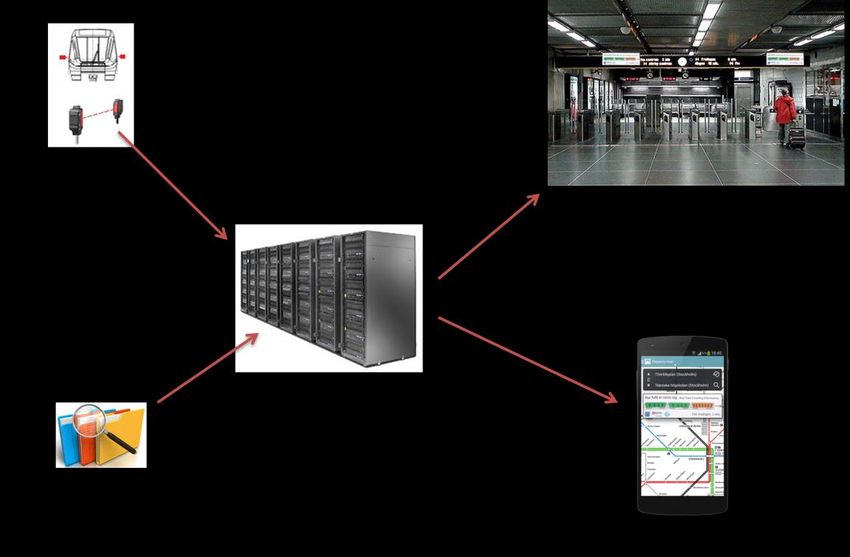
Sammanfattning
Den ökande befolkningen leder till högre reseefterfrågan I Stockholm. Resenärerna
upplever att det blir allt trängre I kollektivtrafiken. De måste fatta beslut på begränsad
trafikinformation. Det är svårt att undvika trängsel baserat på befintlig
trafikinformation från SL. Detta projekt syftar till att hjälpa passagerare att undvika
den värsta trängseln i tunnelbanan, och samtidigt hjälpa operatören att få högre
utrymmesutnyttjande. RTCI (real time crowding information) projektet innehöll fyra
delsystem: elektronisk informationstavla, kommunikationssystem, högtalarsystem och
registreringssystem under det praktiska provet. RTCI levererades framgångsrikt till
passagerare i en av tunnelbanestationerna - Tekniska Högskolan i Stockholm.

För att beskriva effekterna av RTCI-systemet tillämpade. Triangulering av tre
metoder: Analys av belastningsdata från MTR, analys av videoinspelning och analys
av intervjusvar från resenärer. Intervjusvaren visar att runt nio tiondelar (90 %)
av de intervjuade resenärerna var nöjda och 43 % av de intervjuade tyckte att
det var mycket bra för dem. Analysen av videoinspelningen visar att 25 % av
passagerarna har uppmärksammat informationen och ändrat sitt beteende på
plattformen. Enligt videoinspelningen, blev passageutrymmet på plattformen bredare
då RTCI-systemet aktiverades. Belastningsdata visade att passagerarnas fördelning
mellan olika vagnar blev också jämnare. Antalet Passagerare som valde sista
vagnen ökade med 8 % och antalet i den första och andra vagnen (av tre vagnar)
minskade med 4 % under provet.

Rapporten har fokus på att analysera effekterna av RTCI i stället för att lösa olika
tekniska utmaningar. Men en teknisk lösning för RTCI systemet föreslås också.
Konceptet - "Smart Travel" diskuterades i kapitel 11 som främst avser restid, trängsel
och resekostnader som de viktigaste faktorerna för passagerare.

                                            5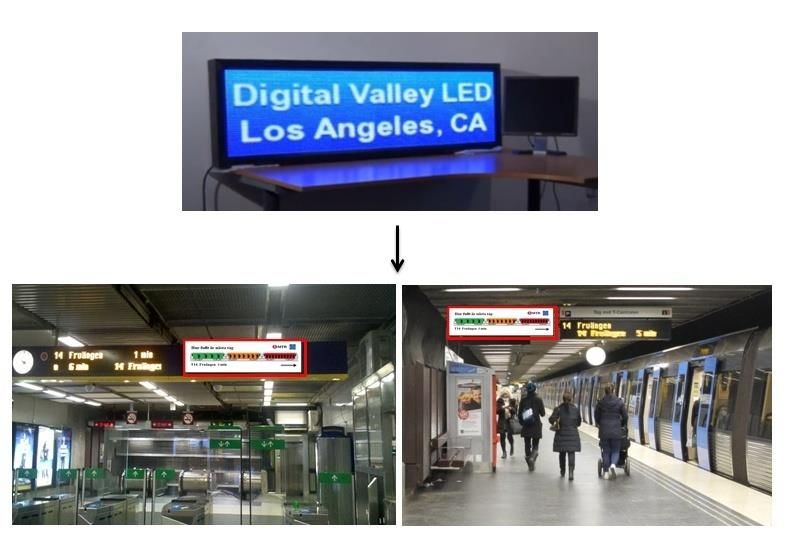
Definition
LSM - Laser Sensor Measurement
MTR - MTR Stockholm AB (Planning and Maintenance of Stockholm Metro)
RTCI - Real-Time Crowding Information
SL - Public Transport in Stockholm
THE - Tekniska Högskolan
The Green line - Tunnelbana 1.inStockholm Metro
The Red line - Tunnelbana 2.inStockholm Metro
The Blue line - Tunnelbana 3.inStockholm Metro
UNT - Universitetet T-bana
V1 - First Unit Train (First Unit to South Direction in 3-units C20 Trains)
V2 - Second Unit Train (Middle Unit in 3-units Trains)
V3 - Last Unit Train (Last Unit to South Direction in 3-units C20 Trains)

                                        6
Table of Contents
1. Introduction ..................................................................................................... 9
1.1 Background .................................................................................................. 9
1.2 Problem Description .................................................................................. 11
1.3 Aim & Objective ....................................................................................... 13
1.4 Limitation .................................................................................................. 13
2. Methodology ................................................................................................. 15
3. Literature Review .......................................................................................... 17
4. Survey in Metro Station ................................................................................ 23
5. Solution ......................................................................................................... 29
5.1 Method to Measure Passengers Distribution ............................................. 29
5.2 Graphical Design of Crowding Information .............................................. 31
5.3 Method to Deliver RTCI to Passengers ..................................................... 33
6. Preparation Work ........................................................................................... 37
7. Practical Test ................................................................................................. 41
8. Result Analysis .............................................................................................. 45
8.1 Interview Result Analysis .......................................................................... 45
8.2 Video Analysis ........................................................................................... 49
8.3 Passenger Load Data Analysis ................................................................... 52
9. Discussion ..................................................................................................... 55
9.1 RTCI Prediction ......................................................................................... 55
9.2 RTCI Impact .............................................................................................. 59
10. Proposed Technical Solution ..................................................................... 63
11. Conclusion ................................................................................................. 65
Bibliography .......................................................................................................... 69
Appendices ............................................................................................................ 73
78
1. Introduction

Here is a short story about Bruce’s travel experience in the morning rush hours in
Stockholm:

   Bruce wakes up at 7:00 am. He has an important meeting at 9:00am in
   downtown. Bruce usually takes public transport in the morning. While he
   arrives metro station at 8:20am, he sees that the metro will arrive in 2
   minutes from SL traffic sign on platform. But the coming train to Slussen is
   full of passengers. Bruce cannot get into the train, so he decides to wait the
   next train and walk to the middle of platform. Bruce don’t like standing
   closed to other passengers which make him feel uncomfortable, but he tells
   himself that he has to get into the next train otherwise he will be late to the
   meeting,

   Bruce arrives Slussen station at 8:40am. He didn’t sleep well last night so he
   want to take a short nap during this travel, but he guesses the next train might
   be very crowded and there might be no seat left in the coming train. While the
   train arrives, the first unit train and middle unit train are full of passengers.
   He run to the end of platform and get into the last unit train. He arrive
   destination with low satisfaction to public transport service.

More and more passengers have similar travel experience in morning and afternoon
rush hours. With urbanization process in large cities, the population in most large
cities is increasing fast in recent years. The increasing population leads to higher
passenger travel demand in large cities. RTCI research aims to help passenger to have
a “Smart Travel” and assist operator to have higher utilization efficiency in public
transport.

1.1 Background

Sweden is experiencing the highest rate of urbanisation in the EU. According to
statistics, the population growth rate in densely populated place (1.73%)was more
than three times the European Union average in 2010 (Elmsäter-Svärd, 2013).

                                           9
3000000
2500000
Population
2000000
Stockholm County
1500000
1000000
500000 Years
1980 1990 2000 2012 2022 2030
Figure 1.The population of Stockholm from 1980 to 2030
As the capital city in Sweden, Stockholm is growing rapidly. It has become one of the
fastest growing cities in EU which was six times faster than Paris (Anon., 2013). As
figure 1shows, the local population in Stockholm is estimated to increase around
500,000 people from 2015 to 2030 (Wingårdh & Asplund, 2009). The increasing
populationleads to higher travel demand. As figure 2 shows, the journey by public
transport was increasing fast since 1990. In order to meet higher transport demand,
SEK 100 billion was invested in the public transport in Stockholm in recent years
(Anon., 2014).
Figure 2.Urban mobility strategy (Wingårdh & Asplund, 2009)
101.2 Problem Description
Increasing Travel Demand
With increasing passengers travel demand in Stockholm, more and more passengers
travel via metro in rush hours. The statistic showed around 43 percent of passengers
travelling by metro in Stockholm (Anon., 2007).Metro system has a higher capacity
compared with other transportation modes. It is also independent of road traffic
(Edemskiy, 2010).There were 328 million passengers travel on metro in 2013. The
number of daily passengers in Stockholm metro increased by 195,000 since 1995
(NILSSON, 2011).Until now there are around 898,630 passengers traveling on metro
every day (Anon., 2013).
The daily boarding passengers has increased by 10,000 since 2003 in Slussen
(NILSSON, 2011).The main reason was the strong population growth in Nacka and
Värmdö since 2003. The daily boarding passengers also growth fast in Liljeholmen,
Alvik and Tekniska Högskolan station where it has increased by around 6800
passengers (NILSSON, 2011).The number of passengers is increasing year by year
which leads to some crowding situations in Stockholm metro.
Figure 3.The number of passenger in Stockholm metro from 2009 to 2013
Traffic crowding is the result of the interaction between traffic volume and practical
capacity (Anon., 2013). The technical capacity in Stockholm is 1,200 passengers per
departure. The practical capacity of C6 is 700 passengers per departure, and the
practical capacity of C20 train is 650 passengers per departure (SL, 2009). According
to the report from SL, the occupancy rate between Slussen and Gamla Stan was 111
11percent in the morning rush hour. The number of passengers between 7:30am and
8:30am was up to 17,400, which was 1,700 more than maximum capacity allows
(15700 passengers) (Ritzén, 2013).
Passengers carry out travel decisions usually based on limited traffic information and
their travel experience. Passengers cannot take the initiative to avoid crowding based
on existing SL traffic information. Crowding situation leads to a lower passenger
satisfaction to metro service. The poor quality of information provided to passengers
would also increase the crowding feeling of passenger. If passengers could have more
perceived control to make decision, the more positive view passengers will have
(Kottenhoff, 2014).
Low Space Utilization Efficiency
Figure 4.25% to 30% seats are empty in morning and afternoon rush hours
It was stated in new operating agreements for subway service in Stockholm that the
transport operators - MTR Stockholm AB planned to control the overcrowding values
(Anon., 2012).To deal with the growing transportation demand, operators may
construct new infrastructure, which is usually extremely costly and time consuming
(Edemskiy, 2010).
Although the number of passengers between 7:30am and 8:30amwas more than
maximum practical capacity between Slussen and Gamla Stan, “sometimes it isn’t
overcrowded in each unit train” said by Christian Hoffmann from SL's press service,
“There is usually more space in middle of the metro” (Ritzén, 2013).
According to data from SL, it shows that passenger distribution is usually uneven in
Stockholm metro. 25% to 30% seats were empty in morning and afternoon rush hours
(Anon., 2013). The uneven passenger distribution leads to a low space utilization
efficiency. If the space utilization efficiency is higher, more than 25% potential
capacity could be exploited in rush hours in Stockholm metro.
121.3 Aim & Objective
The aim of thesis work is to provide real-time crowding information (RTCI) to the
passenger and analyze the impacts. The objectives are:
1) Investigate and analyze the current situation in Stockholm Metro
2) Develop efficient methods to deliver RTCI to passenger and analyze the impacts
to passenger satisfaction, passenger flow and passenger distribution both on
platform and in metro
3) Propose technical solution
1.4 Limitation
There are different types of trains used in Stockholm metro such as C6 and C20, but
author only discuss and analyse the passenger distribution in 3-units C20 trains. The
graphical information and voice information only present the crowding situation in
3-units C20 trains.
There is no relevant research which focuses on analysing the impact of real time
crowding information (RTCI) provision to passengers in metro system. To some
extent, this thesis work is unique. The thesis focuses on analysing RTCI impact to
passenger satisfaction, passenger flow on platform and passenger distribution both in
metro and on platform. The potential impacts to metro system are mentioned in
chapter 11such as shorter dwell time and higher passenger's willingness-to-pay.
There is no existing technology in Stockholm metro that could provide real time
passenger load information. Thus solution was developed in this thesis project which
included two temporary methods to measure real time crowding situation and provide
RTCI. The RTCI was measured manually and sent to operator.
The surveys were done in 6 metro stations in Stockholm, and practical test was only
applied in Tekniska Högskolan station for 6 days. During practical test, RTCI was
delivered to passenger via RTCI display and speaker system on platform. Due to
limited budget and time, there are no other recourses such as mobile app or website
for passenger to receive RTCI.
The thesis mainly focuses to analyse the impacts of RTCI instead of solving technical
challenges. The thesis does not include the research in automatic measurement, but
the basic principle of automatic measurement for RTCI system was introduced in the
chapter 5.1.
1314
2. Methodology

The first taskin this thesis project is theory research which mainly using literature
review, surveys and interviews. The literature review was done via KTH online
database and some online search tools such as Google.The related literatures helps
author to understand passenger transport strategy, passenger behaviour in metro
platform and potential impacts of real time traffic information to passengers. The
survey basically depends on obersavation and video record in 6 metro stations. The
camera was used to record passenger flow on platform in morning rush hour and
afternoon rush hour. Multiple-choicequestinnaires to passengers were used in the
interview. It aims to help researcher to understand passenger behaviour and strategy
via compare with the knowledge from literature review and from survey.

The second task includes graphical design and information delivery. Two methods to
spread information were proposed in the thesis. Considered cost, time and possibility,
projector and individual speaker arechosen to spread the information during practical
test. Four graphical designs were proposed and tested. The graphical designs were
projected on the platform via smart led projector. Based on passengers’ feedbacks,
design was updated.

Figure 7. The triangle result analysis was applied to get final test result

The third task is prepartion work which mainly include hardware prepartion and
historical load data collection. The research is supported by KTH and MTR. Thus
most hardware was borrowed from them. Through cooperating withMTR, the
historical load data in 2014 and 2015 was received.

The fouth task is to collect and analyze the result of practical test. Microsoft Excel
was used to analyze the test data. The triangle result analysis was applied which
contained three analysis methods: passenger load data analysis, video record analysis
and interview result analysis. The analysis work includes both quantitative
researchand qualitative research. The interview result analysis is qualitative research.

                                            15
The video record and passenger load data analysis are quantitative research.
Based on analysis result, the last task is to propose the technical solution. Some
knowledge in electronic engineering and information process technology is required.
These knowledge is mainly collected via KTH online database.
163. Literature Review
Many previous researches in public transport focused on analyzing the metro capacity.
The impacts of real-time transit information to passenger were also discussed and
analyzed in some researches. But there were only few researches considering the real
time crowding information (RTCI) and analyzing the impacts to passenger
satisfaction, passenger flow and passenger distribution. The literature review aims to
integrate existing knowledge in passenger transport strategy, passenger behavior on
platform and real time information impacts.
Passenger Transport Strategy
Most city transport strategy focus on guiding policies for priorities in large and small
decisions in city transport plan, and promote a more efficient, safe and sustainable
transportation (Firth, 2012). In passenger transport, some research focused on moving
vehicle in the road traffic or the carriage in the metro system. However moving
passengers in city transport should be the most important focus.
Passengers have several alterative in the city transport such as walking, cycling, using
public transportation (bus or metro). Transport is the method to help passengers
reaching the destination (Firth, 2012). The main factors that influence the passengers
transport strategy include the personal affordability, family attributes, trip
characteristic, transport service and etc., (Liu et al., 2012).
As figure shows below, it is a suggested passenger travel strategy from MTR
Stockholm AB which aims to guide passengers to avoid crowding situation in public
transport. The first suggestion to passenger is to take another time to travel in order to
avoid the rush hour. If the passengers have to travel during this period, the second
suggestion is to take another mode of transport which is less crowding such as bus or
metro. At some cases passengers have to take this mode such as metro at this period.
Then the third suggestion for the passengers is to choose another departure which
means the later or earlier bus or train. There are usually 2 or 3 unit trains in each
coming metro. Thus, the last suggested strategy is to take the less crowding train in
the coming metro.
17Figure 5. Suggested passenger travel strategy
Although there are several travel suggestions to avoid the crowding, there is no
further traffic information to assist passenger making right decision. Passenger used to
make discussion based on their travel experiences. It is actually difficult for them to
make right travel decision.
Passenger Behaviour in Platform
In Stockholm frequent traveler usually bought SL access card for several days or even
months. Some passengers may need to buy ticket at ticket office or machine. At the
station, passenger might buy some snack or take a metro newspaper. After passing the
ticket gate, passenger usually try to find their own way to the correct platform as soon
as possible.
When passenger stands in the platform, there are three different observed passenger
clustering behaviors:
Standing in the place where passengers used to stand
Closing to entrances, stairways, and other platform infrastructure
Standing where others stand
It was stated in previous research about passenger waiting strategies that the
infrastructure of platform has a direct effect to the passenger distribution on platform
18(Pettersson, 2011). For example when the entrances are at the end of the platforms, it
leads to higher passenger concentrations compared with the entrances on the middle
of the platform. The uneven passenger distribution usually leads to a poor passenger
flow on platform, and the poor passenger flow would make the uneven distribution
worse.
As figure 5 shows below (Pettersson, 2011), the four most common passenger
distributions because of passenger clustering behaviors are:
Uniform distribution,
Bell shaped distribution,
Unilateral skewed distribution
Bilateral skewed distribution
If passengers are distributed evenly on platform, it could lead to a longer dwell time.
But the passenger distribution seems to be more uniform on platform in some rush
hours (Pettersson, 2011).
Figure 6. Four most common passenger distributions
When metro comes, passenger goes into the train and finds standing place or empty
seat. Then metro takes passengers to another station, passenger continue their travel to
the final destination and exit the station. It is usually a combination of several shorter
19local travels. Passenger has to make a number of decisions and movements during the
travel, especially in the big station such as T-Centralen and Slussen.
It is important for passenger to get good traffic information during the whole travel. In
Stockholm metro system, passengers could know the timetable of each departure and
plan for their travel in advance (Pettersson, 2011).According to a research result about
passenger behavior during the metro evacuation, it was stated that the passenger’s
behavior varied depending on the information provided. People will only start to
move when enough information convinces them (Pettersson, 2011).
Real-time Information Impacts
There are more and more information and communication technologies which are
applied in the public transport system in order to improve passenger service and
operation level such as Automatic Vehicle Location (AVL) which were firstly used to
support operator. This technology was also used to provide real time information to
passengers (SCHWEIGER, 2003)
The real-time information which is displayed on screen would be consulted more
often by passenger compared with printed information such as timetable on the paper
poster (Dziekan & Kottenhoff, 2007), and if passenger had more real-time
information they probably could utilize the capacity of the system more efficiently.
The real time information could support passenger to make wise decisions and save
travel time (Cats et al., 2011). To some extent, the information could also reduce the
passenger’s anxiety and stress compared with the situation that passenger has no
access to any traffic information (Lappin & Bottom, 2001). In general, there are
several main effects to passenger which are mentioned in a research paper: (Dziekan
& Kottenhoff, 2007)
1) Reduced well time
2) Increase willingness-to-pay,
3) Adjust travel behavior
4) Increase passenger satisfaction
In the report - dynamic at-stop real-time information displays for public transport:
effects on customers, it was stated that some effects only exist in the beginning of the
provision. After passenger loses curious and accustomed to it, it become hard to get
more attention and be consulted by passenger. Thus when researcher analyzed the
impact of new traffic device to passenger, it usually cost time for passenger to adjust
to new services. Thus the time-lags have to be taken into consideration in the project
(Dziekan & Kottenhoff, 2007). It was suggested that a final evaluation should be
made after 3–5 years implementation of traffic device (Dziekan & Kottenhoff, 2007).
20The method to deliver real time traffic information could depend on the public
displays or passenger’s mobile phone while passenger makes decision. It was also
mentioned by Oded Cats that a future study may analyze the interdependence between
passenger decisions and the impacts of real time information regarding crowding
situation in the train. A survey by Kim et al. mentioned that the provision of traffic
information with crowding situation could have big effects on passenger route choice
decisions (Cats et al., 2011).
2122
4. Survey in Metro Station

Survey was done in six metro stations in Stockholm. The survey aims to help author
to know the real situation in rush hours and understand the relevance between
infrastructure and passenger distribution. The camera was used to record the
passenger flow on platform and passenger distribution both on platform and in metro.
Based on video analysis result and passenger load data from MTR, Tekniska
Högskolan was finally chosen to apply RTCI practical test.

Solna Station
Time: 7am to 9am 1.28 2015
According to survey in Solna station, it was not necessary to promote passenger to
take more flexible transport strategy in order to avoid crowding in Solna station. But
with higher travel demands from increasing population in Solna, it would be
necessary in the future to advice passenger take other transport mode in order to avoid
overcrowding situation.

Providing real time crowding information (RTCI) to passenger in the morning from
7am to 9am inside Solna station could contribute a better passenger distribution in
order to avoid the crowding or overcrowding in first and last unit train and
accumulation crowding effect in next station. Another benefit could be reducing dwell
time since passenger spends less time to get into metro; the specific time saving could
be calculated in further research project.

Conclusion:
There are potential benefits to provide RTCI inside station
1. Avoid accumulation crowding effect
2. Reduce subway waiting time (catch up the schedule)
3. Provide a crowding schedule to school or disabled person, or person with baby
    carriage or others

St Eriksplan Station
Time: 7am to 9am 1.29 2015
The crowding situation of metro (to T-centralen) from historical data was not same
compared with survey result. The survey showed that the number of passengers
getting off the train was quite same or even more than the number of passengers
getting on the train in St Eriksplan Station. The crowding happened in some trains
from 8:20am to 9am.

Conclusion:
High departure frequency leaded to lower passenger input in this station and prevents
overcrowding happen. The drawback is that the passenger didn’t have enough time to

                                          23
walk to the middle since the entrance was in the both side of platform, and the
capacity utilization was very low because of high frequency. Thus the uneven
distribution was actually more serious at this case. Providing RTCI could achieve a
quicker and uniform passenger distribution in order to avoid accumulation crowding
effect in next station.
Slussen Station
Time: 7am to 9am 1.30 2015
Most passengers getting off in Slussen station in order to transfer to another metro
line such as Tunnelbana1 or table the bus. The infrastructure such as chairs or other
devices block the paths and increase the time to walk to another metro line in platform.
Fewer chairs especially in the front and end of platform will be recommended at this
case. At 7:30am, it was more crowding in the end of platform nearby the entrance.
The delay of subway made the situation worse and dangerous for passengers who
waited in platform. The information guide will be necessary. At 8:30am the
overcrowding happened in the first and last unit train.
The curved platform blocked the view of passenger to see the situation of platform
area which exacerbates the uneven passenger distribution on the platform to some
extent. From another point of view, it will also be the opportunity to provide RTCI to
passenger.
Conclusion:
1. Potential benefit to provide RTCI to passenger
2. Focus on passengers in front and end of platform
3. RTCI probably decrease dwell time in platform
4. Better infrastructure design causes better passenger distribution in Slussen station
Tekniska Högskolan Station
Time: 4:30pm to 6pm 2.2 2015
According to the survey in Tekniska Högskolan station (to T-centralen direction), the
main path was usually blocked by passengers nearby the entrance during afternoon
rush hour. It was observed that the vending machines with a large numbers of
passengers standing near the entrance made the situation worse. The available path
was usually very narrow which was only suitable for two persons walking at the same
time. Thus some passengers had to walk in the white area where it is closed to train
truck (potential risk to fall down). The survey also showed that if the path is clear and
wide, passenger seems to be more willing to walk forward.
One MTR staff was arranged in the platform, but this method seems like don’t
working well. For example, it was observed that one passenger jumped down the
station, but the staff didn’t notice it and took action in time. Most employees and
students in KTH get off their work before 5pm, so it is part of reason why there are
overcrowding happen during this period. There is a transfer center where large
24numbers of passengers from other lines come to take the Tunnelbana2 (red line) at
this station which also increasing passenger’s travel demand.
Conclusion:
Uneven passenger distribution and unreasonable position of vending machines in
platform decreased the passenger flow. Large numbers of passengers got into the
station during afternoon rush hour. There are several potential benefits to provide
RTCI to passenger:
1. Decrease the dwell time in platform
2. Increase the passenger satisfaction
3. Prevent accident happen
Odenplan Station
Time: 4:30pm to 6pm 2.3 2015
The first record video was made at 4:51pm. The uneven passenger distribution was
obvious in the platform (to T-centralen direction). But it was not as serious as in the
Tekniska Högskolan station. Because there was not a large numbers of passengers in
coming metro, no overcrowding happened in each unit train. But at 5:38pm, it was
observed that one lady couldn’t get on the train with the baby carriage.
One potential benefit to provide RTCI in this station could be assisting the special
passenger such as disabled person or tourist with big luggage who usually requires
larger space compared with normal passenger. All in all, compared with Tekniska
Högskolan station, the necessary to provide RTCI is less in Odenplan station.
Conclusion:
The platform deign is a good example for other stations. The chair was removed for
some reasons nearby entrance. The benefit to remove chair during rush hours was
obvious that passenger flow was smoother in the platform because of wider path. The
larger space nearby the entrance reduces the possibility of large numbers of
passengers blocking the area, and possibly increases the willingness of passengers to
walk forward in the platform.
T-Centralen station
Time: 7am to 9am 2.5 2015
The survey was done with MTR in T-Centralen station (Tunnelbana2, to
Kungsträdgården direction). According to questionnaires, it was mentioned that
passengers are usually tired and stressed in the morning and afternoon rush hour so it
is less effective to provide complex information. Some passengers were listening the
music, thus the impact via speaker system was actually limited. But it might be good
that not every passenger follow the suggestion, otherwise overcrowding will happen
in the middle of subway.
25Conclusion:
The information should be delivered to passenger before they decide to stand on
somewhere, thus information should be displayed nearby the entrance in order to
reach passengers as soon as they enter platform. Killing time is an important factor to
consider at this case. It could affect passengers and let them to pay more attentions on
some information while they are waiting on the platform.
Final Station Choice–Tekniska Högskolan station
According to the analysis result from survey, Tekniska Högskolan station (TEH) was
considered to be one of the potential metro stations to apply RTCI practical test.
Passenger distribution is unilateral skewed on TEH platform in afternoon rush hours
that there are large numbers of passengers input in south entrance nearby KTH
campus, and less passengers input in north entrance. The passenger output in this
station and previous station (Universitet station) are few. Because of these factors, the
more accurate crowding prediction could also be achieved in Tekniska Högskolan
station.
As figure shows below, it is a historical passenger load diagram in Tekniska
Högskolan station. The metro direction is to T-centralen. The diagram was based on
large numbers of load date which represent general passenger load change from 12am
to 8pm in 2013 and 2014. It is obvious that there is an uneven passenger distribution
in each unit train. The similar crowding situation was observed in the survey.
350
300
250
200 V3
V2
150
V1
100
50
0
12:00 13:00 14:00 15:00 16:00 17:00 18:00 19:00
Figure 8.Historical passenger load data of each unit train(V1=first unit
train;V2=middle unit train; V3=last unit train)
According to the historical data, the crowding situation became worse from 2:30pm to
5:30pm. The biggest passenger load difference happened at around 5pm. There were
300 passengers who were estimated in the first unit train, and there were only 125
26passengers who were estimated in the last unit train. There is a big potential need to
lower passenger load in first train during afternoon rush hours.
2728
5. Solution

5.1 Method to Measure Passengers Distribution

A general crowding standard was used to measure passenger distribution in each unit
train. The crowding level with the utilization value of standing space is shown in
Table 1. It is recommended by Stockholm council. While all seats and more than 40
percent of standing are filled, the train is considered to be overcrowded. The values in
the table are mainly based on SL experience in both rail and bus traffic. It is also
considered to be a crowding standard to measure passenger distribution in each train
during RTCI practical test.

Table 1. Recommended maximum values of crowding from SL
Standard Level                     Utilization of Standing Area              Metro
Good     standard    Maximum
                                               40%

There are several alternatives to measure the passenger distribution in each unit train.
One method is to install the laser sensor measurement (LSM) in the station and
measure the passenger density in each unit train. As figure 7 shows below, an
invisible laser beam is emitted from the sensor. The emitted laser is directly reflected
to another sensor (receiver) through the window. The frequency of blocking laser is a
certain number when the train is empty.

Figure 9.Laser sensor measurement

                                          29
It was mention in chapter 5.1 that there are three values of crowding provided by SL
which could be understood as crowding level, crowding level and less crowding level.
Compared with in less crowding situation, the sensor detects less blocking frequency
in crowding situation. Based on this principle, the laser sensor could measure different
crowding situation in each unit train and determine the crowding level of each unit
train.
Figure10.Three level of crowding situation in the metro
However, the implementation of LSM in reality is much more complicated than the
basic theory. Large numbers of experiments are required. The method applied in
practical test should be simply and effective. Another solution is to manually measure
the passenger distributions in each unit train by observation.
One officer was arranged in previous metro station (Universitetet T-bana).Through
observing the crowding situation of each unit train in leaving metro and comparing
three crowding levels, officer reported the situation to the operator in Tekniska
Högskolan station (TEH)by handheld transceiver.
Figure 11.One officer was arranged in previous station
The metro usually takes around 140 seconds (2.3 minutes) from Universitet T-bana
(UNT)to Tekniska Högskolan station (TEH). Before the operator receives the real
30time crowding information, the crowding information which shows to the passenger is
based on the historical data from MTR.
5.2 Graphical Design of Crowding Information
Some skills in user experience design were used in RTCI information design process.
Previous survey advised that all traffic information should be given both in Swedish
and in English. Information should be easily and quickly understood which requires
very good information design. All information display should deliver the same
information (Pettersson, 2011). The survey also suggested that texts, font size and
color should be similar to the existing traffic information which make passenger feel
familiar with these information and quickly understand. As figure shows below, there
are three information designs. The main difference is the shape of the metro.
Figure 12.Threegraphical designs
In order to get the feedbacks from passengers, a smart projector was used to project
the image of each design and 15 interviews were done in metro platform. The
interview was done in Tekniska Högskolan station on 13rd of March 2015.
Conclusion:
According to the feedbacks from passengers, there are several parts which should be
changed and updated in all designs. Firstly the position of “in 2 minute” and arrow to
31T-centralen make passenger feel confused, it should be moved away from the
direction sign.“T14 Fruängen2 min” is recommended.
Swedish and English texts are necessary. Different colors with human figure are good
and clear to show the crowding level. 8 interviewers prefer last design, 1 prefer fist
design. 3 of them felt confused for all designs. 3 think there is no difference. Thus, the
last design with changes is recommended at this case.
Table2. Interview in Tekniska Högskolan Station (13rd of March 2015)
Understand Understand Understand
Number Age Gender
Design 1 Design 2 Design 3
1 20-25 M N Y Y (Prefer)
2 20-25 M N Y Y
3 20-25 M Y Y Y
4 30-40 M N Y Y
5 30-40 F Y Y Y
6 30-40 M Y Y Y
7 40-50 F Y Y Y
8 20-25 F N N N
9 40-50 M Y Y Y
10 20-25 F N N N
11 60-70 M N N N
12 60-70 F N N N
13 45-55 F Y Y Y
14 45-55 M Y Y Y
15 45-55 F Y Y Y
According to the passengers’ feedbacks, the final information design was proposed as
figure shows below. The text –“T-centralen” was deleted. It is more obvious
difference of crowding via using different colors as background in each unit train and
different density of human figure.
Figure 13.Updatedgraphical design
In order to get further more feedbacks from passengers and test the reaction of the
passengers from the updated design, the image was projected again on platform and
was displayed in different position. The interview was done with 10 passengers from
3215:40 to 16:20in Tekniska Högskolan station on 16rd of March 2015.
Conclusion: The updated design was easily understood by passengers. The direction
of arrow should be changed based on the position of posters which could cause the
confusion to the passengers. The proper size of display with clear images with texts
are very important which could let passenger understand the meaning of information
in few seconds, otherwise they could stand there and try to figure out the meaning or
leave immediately.
5.3 Method to Deliver RTCI to Passengers
The biggest challenge for research is how to get more attentions from passengers on
platform. The previous survey suggested there might be a direct affect to passenger
attention because of the display position on platform. During previous tests, the tripod
blocked the view of passenger to the information. In order to analyze the impacts of
RTCI with different position, three tests were applied.
As figure 14 shows below, the information was projected on the surface of marble
with around 50 degree angles in first test. According to the video record, there were
only around 20 percentages of passengers in platform noticing the projection. Most of
passengers didn’t even see the information.
Figure 14.The information was projected in three positions
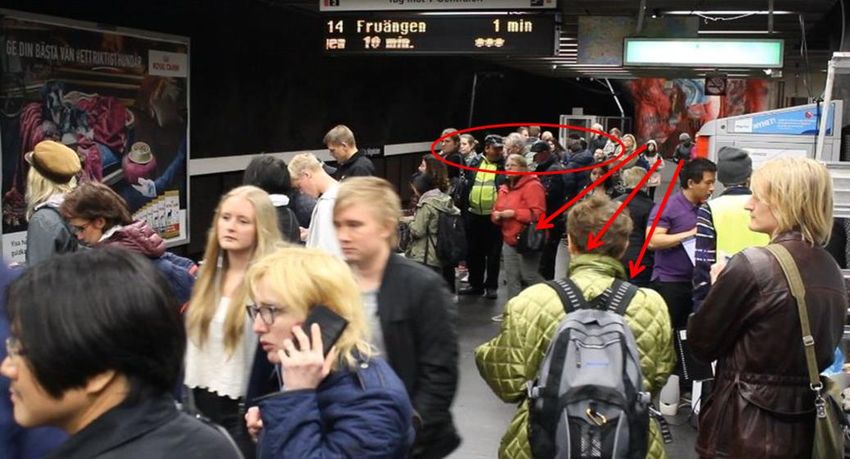
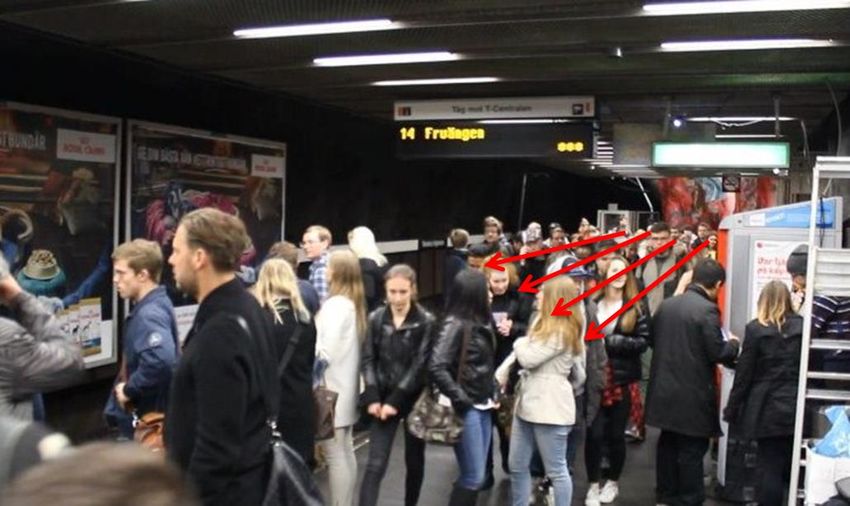
In second test, the information was projected on a 90 degree marble surface. The
video showed around 60 percentage of passengers notice the information. But it was
difficult to judge if they consulted the information or not. In the third test, information
was projected below the traffic sign. According to the video record, most of
passengers (around 80 percentages) noticed it. It was observed that some passengers
were standing in front of projector and discussed with other passengers.
33Conclusion: The information should be displayed in front of passenger's walking
direction which would get more attention from them. The information should be
available and be ability to reach passengers as soon as they are on platform. Some
previous researches about passenger waiting strategy advised that the traffic
information should be displayed in the entrances and hanged on the ceiling of
platform so that passenger could easily see it (Pettersson, 2011).The RTCI display
should also be placed nearby the existing SL information display. The combination of
existing information and RTCI in one display could be a good solution.
Emir Koldzo proposed several solutions to deliver RTCI information in his bachelor
thesis - SL comfort system (Koldzo, 2013). But the method in practical test should be
able to be implemented easily with low cost. In this chapter, three different methods
to deliver RTCI were discussed in order to find a final solution for practical test.
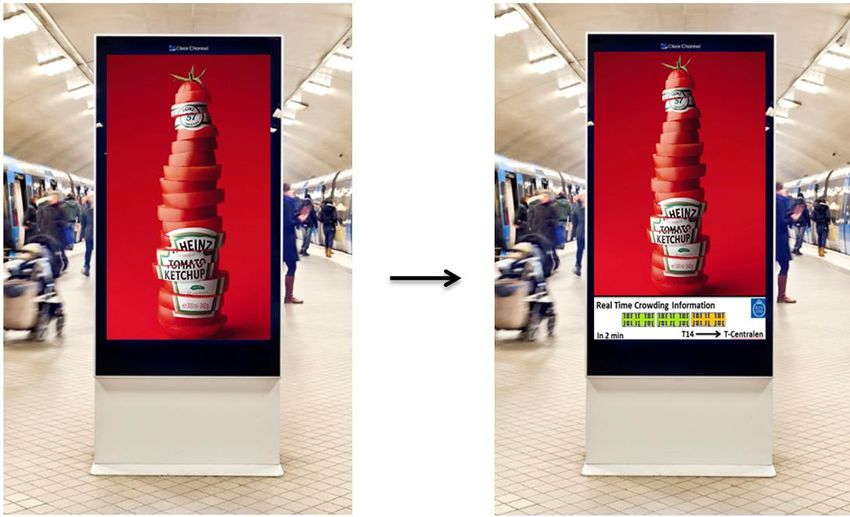
As figure 15 shows, the first alternative to deliver RTCI on display from Clear
Channel on metro platform. As figure shows below, 15% area on the display is
supposed to be used and to deliver RTCI continually. The main challenge is to get the
permission from Clear Channel, and update RTCI in real time.
Figure 15.Display in metro platform from Clear Channel
The second alternative is to deliver RTCI by full color led displays. As figure shows
below, the display is supposed to be hung on the roof in platform. According to the
suggestions from previous tests, the display should be placed nearby the existing
traffic information sign. This method requires a power supply for the screen. The
screen is controlled by computer with long signal cable. The extra construction to
install the led screen on platform’s roof is a challenge at this case.
34Figure 16.Led display is hung on the roof in metro station
The third alternative is to display the information by projector over platform. The
metal/plastic traffic sign is used as a projected screen. The projected screen and
projector are hung on the ceiling. The extra test to the projector light was done in case
the light disturbs the metro driver. This method also requires the extra electric power
supply for several projectors. The main challenge is the connection between projector
and computer. The solution could be using the projector which has wireless function
or using long VGA cable.
3536
6. Preparation Work

Hardware Preparation
One of challenges for practical test is hardware preparation. It was impossible to buy
all needed hardware by limited budget. Thus most devices were borrowed from KTH
and MTR. As table 3 shown, there was15hardwarewhich was used in the practical test.
RTCI system contains4 subsystems: projection system, communication system,
speaker system and recording system.

                   Table 3. 7 subsystems including 16 hardware
              System                              Hardware
           Power Supply          1. Power cables for projectors (15m)

         Projection System       2. Projector (power cable, HDMI cable,
                                 controller, projector and VGA cable)
                                 3. Projected screen with 4 carabineer buckles

                                 4. Universal bracket
                                 5. VGA cable (10m)
      Communication System       6. Handheld Transceiver
          Speaker System         7. Speaker ( with power cable)
                                 8. Cable ( connect with PC)
                                 9. Speaker tripod
         Information Desk        10. Desk
                                 11. Introduction Poster
         Recording System        12. Camera
                                 13. Memory Card (16GB and 8GB)
                                 14. Tripod with mounting plate

               Other             15. Ladder & 16. Safety Vest

Historical Data Collection
The passenger load is measured and delivered via memory card when it is needed.
The historical data included each departure (south direction) in Tekniska Högskolan
station (TEH) and Universitetet station (UNT) in May 2014. However the original
data from MTR was incomplete, some figures were missing. Thus in order to get a
complete diagram to show passenger load change from 3:30pm to 5:30pm, 30 days'
passenger load data in May was collected and aggregated together by using time

                                         37
blocks in Microsoft Excel.
As figure23 and figure 24 show, the green line represents passenger load change in
the first unit train. The red line represents the passenger load change in the second
unit train, and the green line represents the passenger load change in the last unit train.
Uneven passenger distribution is obvious in UNT and TEH. The biggest load
difference between first unit train and last unit train in UNT is around 125 passengers
which occur at 16:11. The biggest load difference in THE is around 175 passengers at
16:25. However the passenger load difference between first, second and last unit train
in TEH is more significant than in UNT.
350
300
250
200
V3
150
100 V2
50 V1
0
Figure 23.Historical passengers load data in TEH in May (V1=first unit train;
V2=middle unit train; V3=last unit train)
350
300
250
200
V3
150
100 V2
50 V1
0
Figure 24.Historical passengers load data in UNT in May
In order to know the historical passenger boarding situation in TEH, the total
passenger load of each unit train in TEH is used to minus the total passenger load of
each unit train in UNT for 42 metro departures. As table 4 shown, around six tenths of
passengers in TEH chose to get into the first unit train, and there are only one tenth of
the passengers chose the last unit train.
38Table 4. Passenger boarding state in each unit train in TEH (V1=first unit train,
V2=second unit train, V3=last unit train)
60%
50%
40%
30%
20%
10%
0%
V3 V2 V1
Persentage 12% 31% 57%
Voice Record
Emma Källblad and Anders Lindahl are researchers in Royal Institute of Technology
(KTH). Emma's voice was recorded as English version of information. Anders's voice
was recorded as Swedish version. The voice was recorded via software - Sound
Recorder. There are totally 12 voice messages which are recorded to represent
different crowding situation of coming metro. In English version, it includes 5 short
sentences with 3 options to represent crowding level of each train:
1). Welcome to Tekniska Högskolan, here is real-time crowding information for the
next metro.
2). The first unit train is almost full, it is overcrowded &The first unit train is half full
with some standing areas &The first unit train is less crowded, it might have seats left.
3). The second unit train is almost full, it is overcrowded &The secondunit train is
half full with some standing areas & The Second unit trainis less crowded, it might
have seats left.
4). The last unit trainis almost full, it is overcrowded &The last unit train is half full
with some standing areas &The last unit trainis less crowded, it might have seats left
5). We wish you a pleasant journey in Stockholm.
In Swedish version, it includes 4 short sentences in the information which is shorter
than English version. There are also three options to represent the crowding level of
each unit train.
1). Här kommer information om beläggningen i nästa tåg
2). I första vagnen är det många resenärer – det är trångt & I första vagnen är det
halvfullt med nagra stående & I första vagnen är det halvtomt – Det kan finnas
39sittplatser kvar
3). I den andra vagnen är det många resenärer – det är trångt & I den andra vagnen är
halvfull med nagra stående & I den andra vagnen är halvtom – Det kan finnas
sittplatser kvar.
4). I den sista vagnen är det många resenärer– det är trångt & I den sista vagnen är
halvfull med nagra stående & I den sista vagnen är halvtom – Det kan finnas
sittplatser kvar
Each voice message is combined with individual crowding option for first unit train,
second unit train and third unit train. It was processed via software - Movie Maker.
Here is one example for a complete voice message: Welcome to Tekniska Högskolan,
here is real-time crowding information for the next metro. The first unit train is almost
full, it is overcrowded ; The second unit train is half full with some standing areas ;
The last unit trainis less crowded, it might have seats left We wish you a pleasant
journey in Stockholm.
407. Practical Test
Figure 17.The projector was installed on the ceiling
In the final solution, the projector was chosen to display the information. The main
reasons to use projector are flexibility and accessibility. The projector could be
operated by any private computer, and the information could be updated easily. The
Optoma ML500 projector was used in the practical test. It has LED light source with
500 lumens of brightness. As figure shows above, the projector was installed on the
ceiling and projecting RTCI on the white screen.
Figure 18.The real time crowding information was projected on the white screen
The displayed RTCI on the write screen includes three information. The texts are
written both in Swedish and English: Hur fullt är nästa tåg ; Real Time Crowding
Information. The short text aims to help passenger to understand information easily
and quickly. The second information uses different color (Red, Orange or Green) to
represent three crowding levels. In the final solution, the red arrow is used and putted
in front of metro which represents the direction of metro. The third information is
about the direction of coming metro and waiting time which is the same as
information in SL display. This information is updated manually via the computer in
41real time.
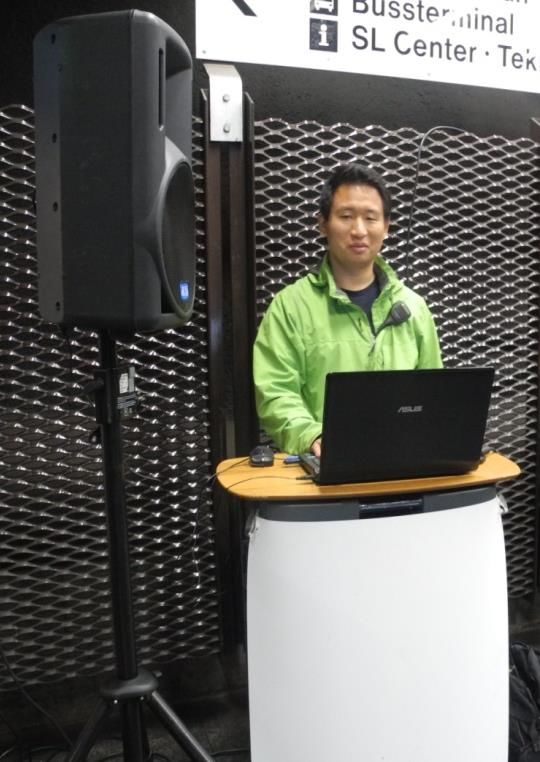
Figure 19.Individual speaker was used and operated via computer
As figure 19 shows, the individual speaker was used and operated via computer
during practical test. The voice was recorded in advance via software - Sound
Recorder. According to the pre-survey, it showed that some passengers in Tekniska
Högskolan station are international students. Thus the information includes both
Swedish version and English version. The texts contains a short description about the
crowding situation in coming metro for example it is said that the first unit train is
almost full, it is overcrowded ; the second unit train is half full with some standing
areas. The last unit train is less crowded, it might have seats left. In order to analyze
the impact of voice quality to passenger behavior, one extra test was applied.
Figure 20.Operator used historical crowding data to show in the screen
The frequency of line 14 is 5 minutes in rush hours according to SL timetable. Metro
usually takes 2 minutes and 20 seconds from Universitetet to Tekniska Högskolan
station. In order to achieve a long-term crowding prediction, the historical crowding
data was combined with real time crowding state.
42Figure 21.Operator received RTCI from officer in UNT
When the unit train has not come or waits in the previous metro station (Universitetet),
the system use historical crowding data. The historical crowding information is
displayed by projector on the screen. When the metro is leaving previous station, the
officer in Universitetet station reported the crowding situation of each unit train to the
operator in Tekniska Högskolan station via handheld transceiver. The information is
updated according to the report. Meanwhile the speaker is used to spread the
crowding information through the platform.
Figure 22.The real time crowding information on TEH platform
During the practical test, most devices were hidden behind the vending machine. The
practical test aims to simulate more real situation which means that there should be no
extra factor except speaker and displayed information to affect passenger behavior on
platform.
4344
8. Result Analysis

8.1 Interview Result Analysis

Projection System
There were 118 passengers who were interviewed and asked questions about
projection system. A figure 25 shows, 45% passengers were female and 55%
passengers were male. There are three age groups included in the interview result. 47%
interviewee are teenagers (10 - 25 years old), and most of them are students in
Stockholm. 39% interviewees are 26 to 45 years old, and some interviewees in this
group travel with their kids. 14% interviewees are 46 to 60 years old.

                Male       Female

                                                 Understand        Misunderstand
      20%
                                                              3%
                  17%

      27%
                  22%          8%
                               6%                              98%

    10 to 25    26 to 45     46 to 60

Figure 25.The interview result for projection system

According to the interview result, 97% interviewees could understand the displayed
information on the screen. 43% interviewees thought it was very useful to make
decision while they travel by metro. No interviewee thought it was no useful at this
case. And there was only 4% interviewees thought it was less useful. According to the
questionnaire result, most of them in this 4% are frequent traveler and have a short
distance travel.

                                         45
You can also read