Radar-based Materials Classification Using Deep Wavelet Scattering Transform: A Comparison of Centimeter vs. Millimeter Wave Units
←
→
Page content transcription
If your browser does not render page correctly, please read the page content below
IEEE ROBOTICS AND AUTOMATION LETTERS. PREPRINT VERSION. ACCEPTED JANUARY, 2022 1

 Radar-based Materials Classification Using Deep
 Wavelet Scattering Transform: A Comparison of
 Centimeter vs. Millimeter Wave Units
 Rami N. Khushaba, Senior Member, IEEE, Andrew J. Hill, Member, IEEE

 Abstract—Radar-based materials detection received significant to other properties, permittivity (or dielectric constant) is
 attention in recent years for its potential inclusion in consumer promising for the implementation of a sensing unit and offers
arXiv:2202.05169v1 [eess.SP] 8 Feb 2022

 and industrial applications like object recognition for grasping a potential for various applications in medical, biological,
 and manufacturing quality assurance and control. Several radar
 publications were developed for material classification under and agricultural fields [3]–[6]. Ultra-Wideband (UWB) radar
 controlled settings with specific materials’ properties and shapes. signals are characterized for having both high frequency carrier
 Recent literature has challenged the earlier findings on radars- and high bandwidth [7]. This makes the scattered field from
 based materials classification claiming that earlier solutions are the targets when irradiated with UWB pulses highly dependent
 not easily scaled to industrial applications due to issues such as on the composition and shape of the target, the absorption
 the analog-to-digital converters’ high sensitivity to target aspect
 angle, noise fluctuations due to temperature and other external and scattering properties of the material at the wavelengths
 conditions and sensor orientation. Published experiments on used, the refractive index, and thus the specular reflection from
 the impact of the aforementioned factors on the robustness the material. However, parameters such as object thickness,
 of the extracted radar-based traditional features have already dimensions, impurities, and reflections from the surrounding
 demonstrated that the application of deep neural networks test setup, could also affect the received signals in such sensing
 can mitigate, to some extent, the impact to produce a viable
 solution. However, previous studies lacked an investigation of the and radar applications, which would increase the uncertainty
 usefulness of lower frequency radar units, specifically < 10GHz, in the detection results. In such a case, the use of supervised
 against the higher range units around and above 60GHz. To machine learning (ML) approaches with numerous samples for
 address the aforementioned investigation, this research considers the materials under test was recommended for application in
 two radar units with different frequency ranges: the Walabot-3D radar based materials detection [8].
 (6.3-8 GHz) cm-wave and IMAGEVK-74 (62-69 GHz) mm-wave
 imaging units by Vayyar Imaging. A comparison is presented For the materials identification problem, a number of re-
 on the applicability of each unit for material classification. This search attempts have considered the use of centimeter-wave
 work also extends upon previous efforts, by applying deep wavelet (3 to 30 GHz) and millimeter-wave (30 to 300 GHz) radar
 scattering transform for the identification of different materials units individually to distinguish a number of materials from
 based on the reflected signals received by these units. In the the reflected radar signals. For example, the RadarCat system
 wavelet scattering feature extractor, data is propagated through
 a series of wavelet transforms, nonlinearities, and averaging [9], [10] employed Google Soli radar unit (57–64 GHz) to
 to produce low-variance representations of the reflected radar recognize different body parts, everyday objects and materials
 signals. This work is unique in terms of the comparison of the including transparent materials. While being very successful,
 utilized radar units and algorithms in material classification and the RadarCat system was criticized in that it can not be readily
 includes real-time demonstrations that show strong performance scaled to industrial or consumer applications as the ADC data
 by both units, with increased robustness offered by the cm-wave
 radar unit. is very sensitive to target aspect angle, sensor orientation, noise
 variations due to temperature and other environmental factors
 Index Terms—Radars, Materials Classification, Wavelet Scat- [11]. Jonas and Avik [12] extended the RadarCat work by
 tering.
 addressing the problem of generalization and demonstrated an
 approach based on a Siamese Convolutional Neural Network
 I. INTRODUCTION (CNN) for classifying five variations of four materials. This
 was done while employing Infineon’s short-range 60 GHz
 W IRELESS broadband sensing has been utilized as an
 effective tool for the unique characterization of mate-
 rials based on their dielectric properties [1], [2]. Compared
 compact radar sensor (covering 57–64 GHz), achieving an
 overall accuracy of 99.23%. The authors further extended their
 work by considering the invariance to sensor noise and sensor
 Manuscript received: September, 9, 2021; Revised: December, 7, 2021; nonlinearities, achieving a classification accuracy of above
 Accepted January, 10, 2022. 97% while classifying 1875 radar images from ten different
 This paper was recommended for publication by Prof. Markus Vincze upon materials [11].
 evaluation of the Associate Editor and Reviewers’ comments.
 The authors have no affiliation with Vayyar Imaging, or its partners involved Brook et. al. [13] further proposed the use of a portable lab-
 in design, manufacturing or sale of the radars tested in this paper. oratory device operating in a frequency-modulated continuous-
 All authors are within the Australian Centre for Field Robotics, The wave (FMCW) mode over 40 and 90 GHz bandwidths (cen-
 University of Sydney. 8 Little Queen street, Chippendale, NSW 2008. (e-
 mail: Rami.Khushaba@Sydney.edu.au; Andrew.Hill@Sydney.edu.au). tered at 100 and 300 GHz respectively), for the detection of
 Digital Object Identifier (DOI): see top of this page. defects in manufactured calibration materials. The recent work
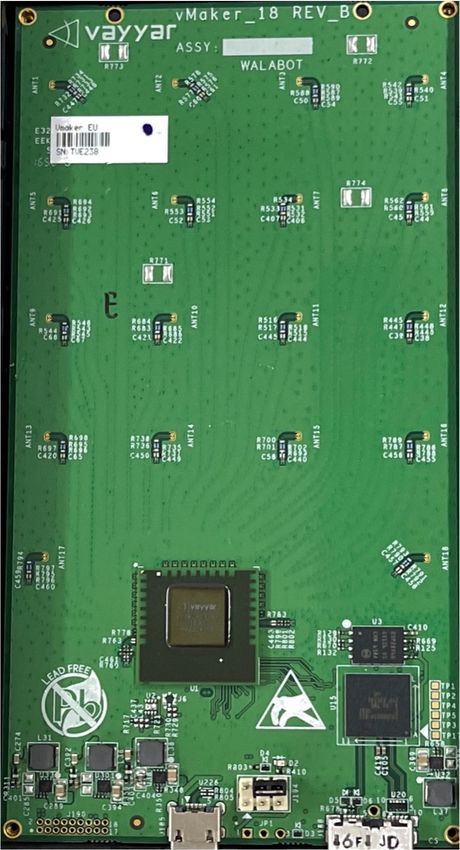
2 IEEE ROBOTICS AND AUTOMATION LETTERS. PREPRINT VERSION. ACCEPTED JANUARY, 2022

by Jamali et. al. [14] further looked at using a millimeter-wave
radar working in the 75–110 GHz range with different classifi-
cation models including Support Vector Machines, Multilayer
Perceptrons, and Gaussian Process classifiers to characterize Radar Wavelet Scatter
dielectric slabs made of different materials and thicknesses. On Raw signals Transform
the other hand, the work by Bouza et. al. [7] demonstrated the
feasibility of using a UWB pulse radar with a center frequency Data Feature
of 4.25 GHz to discriminate between groups of 3, 4, and 5 Collection Extraction
materials using a support vector machine classifier. Unlike
previous work, Agresti and Milani [8] employed a portable
3D imaging radar-based system (the Walabot sensor by Vayyar Feature
 Classification
Imaging working in the 6.3-8 GHz frequency range) to acquire Reduction
three-dimensional radiance maps of various analyzed objects
 Linear Discriminant Spectral Regression‐based
and processed that by using CNNs in order to identify which Analysis (LDA) feature Projection
 Radar
material the object is made of. However, missing from the
literature is direct comparison between many of these units Performance Evaluation
and the justification for using one frequency range/radar unit Fig. 1: Block diagram of the proposed radar-based materials
against another, with the perceived benefits. Additionally, the recognition pipeline.
generalization of the offline findings of many experiments into
real-time tests is not yet demonstrated. Feature Extraction Feature Reduction Clas
 This paper aims to extend the work in the literature by 1) Wavelet Scattering Transform Spectral Regression (SRDA) Linear Di
 04 03 02 01
considering two radar units with different frequency ranges
 08 07 06 05
including the Walabot (3.3–10 GHz US, 6.3–8 GHz EU) and
the IMAGEVK-74 (62–69 GHz) to study the potential benefits 12 11 10 09
and performance comparisons between the two units, and by 16 15 14 13
proxy the two frequency bands; 2) employing the Wavelet scat-
 18 17
tering transform (WST) to generate translation-invariant and
deformation-stable representations of the radar signals through
cascades of wavelet convolutions with nonlinear modulus and
averaging operators to achieve the required robustness; and Back view Front view

3) experimentally demonstrating the real-time performance of
this approach with these radar units. Unlike existing solution Fig. 2: Walabot Radar unit from Vayyar Imaging. The left
suggesting deep learning models for materials classification, image shows the rear of the board with the VYYR2401 chip,
the approach based on the scattering transform is not iterative USB controller and micro-USB connectors. The right image
(require no training) and can function with a small sample shows the antenna array.
size, while deep learning models require a huge amount of
training data and to optimize the different parameters across
a significant number of training iterations. strength of the reflected signal (see Fig.2). The intensity
 of each ‘voxel’ in this representation denotes the reflected
 II. M ATERIALS AND E XPERIMENTAL M ETHODS energy received at a given angle and distance. The average
 transmit power is below −41 dBm/MHz, so it can be safely
 The block diagram of the proposed pipeline is shown in used in public places without restrictions. A combination of
Fig.1. In the following sections, we start first with the descrip- transmitting and receiving antennas are coupled to generate
tion of the radar units employed in this study, followed by the 40 raw signals that are provided by the Walabot SDK. The
data collection procedure. The paper proceeds then with the radiated space is sampled following a spherical coordinate
description of the wavelet scattering transform, followed by the reference system; each sample is rescaled and quantized into
details of the classification pipeline involving dimensionality an 8-bit integer value [8].
reduction and classification methods utilized.
 The implemented API permits collecting three forms of
 outputs from the Walabot unit: 1) a 2D energy map, with
A. Walabot Radar the width and height of this map defined according to user
 The Walabot from Vayyar Imaging1 is a programmable 3D settings in the spherical polar coordinates (R; θ; φ); 2) the raw
radio frequency (RF) sensor unit operating in the frequency signals associated to the 40 couples of transmitting/receiving
range of 3.3–10 GHz (US model) or 6.3–8 GHz (European antennas, which are sampled at frequency of 100 GHz and
model). It employs a 72mm × 140mm array of 18 antennas represented by arrays of 8192 values in double precision; and
(4 transmitting, 14 receiving) to generate a 3D representation 3) a 3D point cloud reporting the reflectance (8 bit integer)
from the area facing the antenna array by measuring the of each point localized in spherical polar coordinates (R; θ;
 φ). The Walabot has been utilized in several applications in
 1 https://vayyar.com/ the literature including the detection of humans and objects

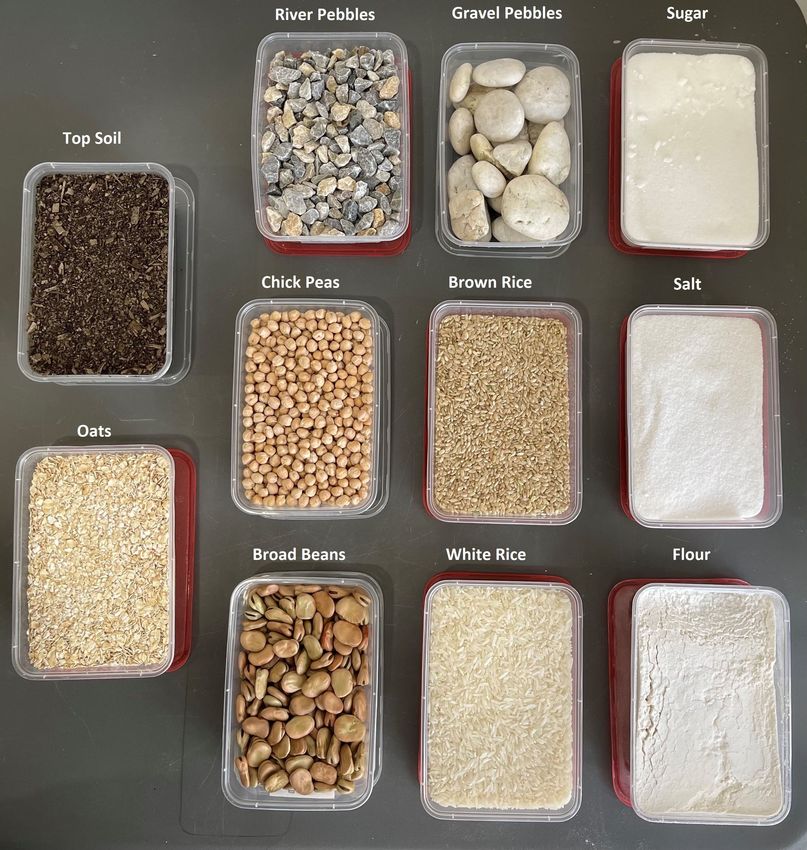
KHUSHABA et al.: RADAR-BASED MATERIALS CLASSIFICATION USING DEEP WAVELET SCATTERING TRANSFORM 3

Fig. 3: IMAGEVK-74 RF sensor unit from Vayyar Imaging.
There are 20 transmitting (Tx) and 20 receiving (Rx) antennas,
which allows recording of 400 signals from each combination. Fig. 4: Eleven classes of materials considered in this research,
 in addition to the twelfth class, Air.

through the wall [25], heart rate and respiration monitoring
[26], [27], pose estimation [28], activity recognition [29], soil chosen materials were placed into plastic containers as shown
moisture monitoring [30], and materials identification [8]. in Fig. 4, with the two radar units individually placed on top of
 each of the boxes to identify the corresponding material inside.
 There were around 300 samples collected by each sensor for
B. IMAGEVK-74 Radar
 each of the materials boxes shown in Fig. 4. Data collection
 The IMAGEVK-74 from Vayyar Imaging is a more ad- during the training phase included random sensors’ placements
vanced model than the Walabot, with an inclusion of 20 on the corresponding boxes (position and orientation), while
transmit (Tx) and 20 receive (Rx) on-board antennas that the testing phase included randomizing the contents of the
can be configured to transmit and receive signals anywhere boxes by shaking (soft materials) and randomly distributing
within the 62 to 69 GHz range (see Fig.3). It provides the contents (hard materials). This in turn provides a good
a great flexibility for hardware developers and researchers amount of variability during testing to make sure that we are
with three performance-optimized transmit profiles to adjust not learning the surface profile of the different materials.
receiver resolution and imaging processing time with direct
access to the Tx/Rx pair phasors for each swept frequency
 D. Feature Extraction with Wavelet Scattering Transform
point. The high-resolution profile uses 20 Tx and 20 Rx
 (WST)
antennas making it ideal for high-resolution 3D imaging while
generating 400 raw signals (one per combination of Rx and A wavelet scattering transform defines a locally transla-
Tx pair). Similarly to Walabot, IMAGEVK-74 transmits the tion invariant representation of the underlying signals that
signals with an effective radiated power of less than −5 dBm is stable to time-warping deformations [15]. The WST was
making it safe for use around people. Similarly to the Walabot, introduced as a deep representation, obtained by an iterative
the IMAGEVK-74 also offers a variety of outputs as raw sig- operator which cascades wavelet convolutions and modulus
nals, and 3D point clouds. To protect the back of the sensor, a nonlinearities [15], [16]. The wavelet transform convolves an
3D printed plastic cover (Acrylonitrile Styrene Acrylate, ASA) input signal x(t) with a filter bank of ψλ1 . Such a filter
was created to shield the sensor from electrostatic charges or bank is made by dilations of a mother wavelet ψ(t), whose
other interference while handling and placing the sensor on Fourier transform ψ(w)
 b is concentrated over the dimensionless
the different materials as shown in the video supplementary frequency interval [1 - 21/2Q ; 1 + 21/2Q ], with Q being the
file. Due to the recent release date of IMAGEVK-74, no quality factor (the number of wavelet filters per octave for
publications were found using this specific sensor unit making each filter bank). A family
 χ
 of bandpass filters centered at
this research the first application of the IMAGEVK-74, to the frequencies λ1 = 2j1+ Q is defined by dilations of the mother
best of the authors’ knowledge. wavelet, with the indices of j1 ∈ Z and χ ∈ 1...Q respectively
 denoting the octave and chroma.
C. Data Collection
 Eleven unique classes of material were considered in this b −1 w) i.e.,
 ψbλ1 (w) = ψ(λ ψλ1 (w) = λ1 ψ(λ1 t). (1)
research, in addition to the case where the radar is not observ-
 A scalogram matrix is then generated by applying the com-
ing at any of the other materials at close proximity (denoted as
 plex modulus to all wavelet convolutions, with a frequential
class ”Air”), making a total of twelve classes. When selecting
 axis that is uniformly sampled by the binary logarithm logλ1 .
these materials we chose a number of closely related material
classes to investigate the true capabilities of the two radar units
 x1 (t, logλ1 ) = |x ? ψλ1 | for all λ1 > 0, (2)
in differentiating between closely related classes. The chosen
classes were 1) River-Pebbles, 2) Gravel-Pebbles, 3) Sugar, where ? is the convolution operator. The energy of x(t) is
4) Salt, 5) Flour, 6) Broad-Beans, 7) Chickpeas, 8) Top-Soil, localized by the scalogram x1 around frequencies λ1 over
9) Oats, 10) White-Rice, 11) Brown-Rice, and 12) Air. All durations of 2Qλ−1
 1 [17]. The WST coefficients are obtained

4 IEEE ROBOTICS AND AUTOMATION LETTERS. PREPRINT VERSION. ACCEPTED JANUARY, 2022

 0 = ⋆

 � ⋆ 1 �

 ( , 1 ) = � ⋆ 1 � ⋆

 �� ⋆ 1 � ⋆ 2 �

 ( , 1 , 2 ) = �� ⋆ 1 � ⋆ 2 � ⋆

 ��� ⋆ 1 � ⋆ 2 � ⋆ 3 �

 Fig. 5: A hierarchical representation of the wavelet scattering transform.

by averaging the wavelet modulus coefficients with a low-pass
filter φ(t) of size T , which ensures local invariance to time- Sm x(t, logλ1 , ..., λm ) = |||x ? ψλ1 | ? ...| ? ψλm | ? φ(t)
shifts. (7)
 = Um x(., logλ1 , ..., λm ) ? φ(t).
 S1 x(t, logλ1) = x1 ? φT = |x ? ψλ1 | ? φT . (3) For a scattering decomposition of maximal order l, the final
 scattering vector aggregates all scattering coefficients for 0 ≤
 At the zero order, a single coefficient is generated by S0 x(t)
 m ≤ l.
= x ? φ(t), as these have very low energy at low frequencies
 The WST enables the derivation of low-variance features
[15]. As the low-pass filtering process removes all high-
 from real-valued time-series and image data. It provides an
frequencies, these are then recovered by a wavelet modulus
 invariant and stable signal representation which made it suit-
transform as the time scattering transform also convolves x1
 able for a wide range of signal processing and machine/deep
with a second filterbank of wavelets ψλ2 and applies complex
 learning applications that the literature investigated already, in-
modulus to get
 cluding (but not limited to): musical genre and phone segment
 classification [15], handwritten digit recognition [19], [20],
 x2 (t, logλ1 , logλ2 ) = |x1 ? ψλ2 | = ||x ? ψλ1 | ? ψλ2 | . (4) indoor fingerprint localization [21], texture discrimination
 [22], and audio classification [23]. High-performance Python
 Similarly to Eq.3, an invariance to translation in time up
 implementations of the scattering transform in 1D, 2D, and 3D
to T is achieved by averaging. Hence, the second order coef-
 that are compatible with modern deep learning frameworks,
ficients, capturing the high-frequency amplitude modulations
 like PyTorch and TensorFlow/Keras were also recently made
occurring at each frequency band of the first layer, are obtained
 available on both CPUs and GPUs, the latter offering a signifi-
by
 cant speedup over the former, with advanced implementations
 supporting highly optimized applications [24].
 S2 x(t, logλ1 , logλ2 ) = x2 ? φ = ||x ? ψλ1 | ? ψλ2 | ? φT . (5) Once the WST is applied on the raw signals collected from
 the radar units, a number of features would be generated to be
with the wavelet ψλ2 having an octave resolution of Q2 , which submitted to the classification system to produce a decision
maybe different from Q1 . To define wavelets that are suitable about the classes that the materials under focus belong to.
to characterize transients and attacks, a more narrow time The cardinality of the WST feature set would depend on the
support is usually defined by setting Q2 = 1. In this manner, a number of raw radar signals collected by the two radar units
sparse representation is acquired which leads to concentrating considered in this research and processed by WST, which is
the signal information over as few wavelet coefficients as a factor that depends on the selected radar operation profile
possible. These coefficients are averaged by the low pass mentioned in the earlier sections.
filter φ, which ensures local invariance to time-shifts, as with
the first-order coefficients [18]. Iterating the aforementioned
process defines scattering coefficients at any order m (see E. Feature Reduction and Pattern Classification
Fig.5 for an illustration of the WST representation). For any The number of time-domain signals and output formats
m > 1, iterated wavelet modulus convolutions are written as: extracted from each of the radar units is dependent on the
 selected operating profile. The Walabot offers short-range
 imaging, sensor, sensor narrow and tracker; the IMAGEVK-
 Um x(t, logλ1 , ..., logλm ) = ||x ? ψλ1 | ? ...| ? ψλm (t) , (6)
 74 offers low, medium and high resolution profiles. Given the
with the mth-order wavelets ψλm have an octave resolution number of signals generated by these units under the different
Qm . The application of φ on Um x gives scattering coefficinets profiles, the application of WST for feature extraction from
of order m: these signals can end up with a large number of generated
KHUSHABA et al.: RADAR-BASED MATERIALS CLASSIFICATION USING DEEP WAVELET SCATTERING TRANSFORM 5

features. The dimensionality of the generated feature set was the Walabot pipeline produced decisions on the corresponding
then reduced using the Spectral Regression (SR) feature pro- materials within a median time of ≈ 52 ms per iteration. On
jection method [31], to c−1 features, with c being the number the other hand, the IMAGEVK-74 unit produced more signals
of classes in the corresponding dataset. For classification, the (up to 400 raw time domain signals) but incurred a much lower
classical Linear Discriminant Analysis (LDA) classifier was acquisition time of ≈ 12 ms. A further ≈ 24 ms was required
utilized mainly due to its simplicity and suitability for real- to process these signals with WST, and the overall median
time implementations thanks to its low computational cost. time per iteration was ≈ 42 ms. The extra time consumed
 by the WST processing was due to the increased number of
 III. E XPERIMENTAL R ESULTS time-domain signals compared to the Walabot (400 vs 40 raw
A. Offline Classification Results time-domain signals). These overall processing times of 40–
 52 ms are well-suited to real-time usage in many applications,
 The classification confusion matrices for both of the
 allowing sampling rates around 20–25 Hz.
IMAGEVK-74 and Walabot radars are shown in Fig. 6. These
 A video demonstration is also attached with this paper
results were generated using a 10-fold cross validation testing
 to demonstrate the performance of the two radar unit dur-
scheme that ensured that all classes were sampled equivalently.
 ing online testing. This has been also made available here
On the other hand, the online classification results in the
 https://www.youtube.com/watch?v=Mfohzvf7iuA.
next section employed completely unseen samples that were
collected during the online experiments.
 These offline testing results clearly show the power of both IV. D ISCUSSION
radar units in predicting the different materials based on the Two radar units were considered for the problem of material
collected offline radar signals. In general, the IMAGEVK- identification with the wavelet scattering transform. The main
74 unit had an average of 90.66 ± 11.40% for the main aim of this study was to investigate and compare the suitability
diagonal of the confusion matrix while the Walabot had an of the centimeter- vs. millimeter-wave radar units for this
average of 92.33 ± 5.49% for its main diagonal of confusion application, to understand if one of these units or frequency
matrix. While these results demonstrate the lower-frequency ranges is better suited for this task. While the literature has
Walabot was more accurate, the off-diagonal values within already demonstrated the effectiveness of similar radar units
the two confusion matrices indicate that the higher-frequency for this task individually, no previous comparisons of the two
IMAGEVK-74 made more ‘reasonable’ confusions between bands were found.
the material classes than the Walabot. In this regard, one can Our results suggest that the 6.3–8 GHz Walabot radar
clearly see that the IMAGEVK-74 confused broad beans with produced more accurate results during offline classification
chick peas (both legumes with broadly similar surface texture) (92.33% vs 90.66%), with lower confusion between materials.
and gravel pebbles with river pebbles (both rocks). On the This was also demonstrated in the attached video supplemen-
other hand, the Walabot made much smaller size confusions tary file with this paper. It is hypothesised that the lower
but these were spread more evenly across the different classes. wavelengths of this unit make it less sensitive to surface
 The scatter plots of the first three components after SR texture at this scale, resulting in a greater signal that relates
projection were also analyzed, shown in Fig. 7. These plots to the material properties themselves (somewhat akin to the
show that the Walabot features had much better separation than use of much lower frequencies for ground penetrating radar in
the IMAGEVK-74 for the purpose of material identification. geological sampling).
This in turn encouraged further online analysis to study the
 On the other hand, while classification results for the
suitability of the two radar units for real-time decision making.
 IMAGEVK-74 pipeline were slightly worse, the confusions
This is particularly important for implementing this in an
 made by this pipeline were perceived as less ‘random’ by
automated system, such as detecting grasped objects, part
 the authors. Examples include confusion between chickpeas
selection or QA/QC in manufacturing, or analyzing soil/rock
 and broad beans (both legumes), or gravel pebbles with river
properties in agriculture or interplanetary robotics.
 pebbles (both rocks). Depending on the application, this may
 be better or worse, especially combined with other sensing
B. Online Classification Results modalities. Overall, both units were utilized to accurately
 The online classification performances for the Walabot and discriminate between the different materials, with the Walabot
IMAGEVK-74 processing pipelines were analyzed in separate showing better robustness.
experiments, measuring the real-time performance stability In terms of the computational costs for these two classifica-
and computational costs. For both radar units, the testing tion pipelines, our analysis showed that the Walabot pipeline
samples were acquired during the online tests, i.e., completely took a median of 52 ms/decision while the IMAGEVK-74
unseen samples during the training phase. In the Walabot required 42 ms. While both numbers appear suitable for
experiments, it can be seen from Fig. 8 that the majority of the online material identification applications, the IMAGEVK-74
computation time was spent acquiring the corresponding radar was much faster in acquiring the signals, despite collecting
signals, which had a median time of ≈ 40 ms. The median time far more samples than the Walabot. The longer processing
for application of the WST was ≈ 11 ms, and the remaining time in the WST stage for the IMAGEVK-74, due to the
steps of feature normalization, SR projection and classification larger input size, could perhaps be offset with optimisation
were all achieved within a median of just ≈ 1 ms. Overall, of the code and/or computational improvements. Regardless,
6 IEEE ROBOTICS AND AUTOMATION LETTERS. PREPRINT VERSION. ACCEPTED JANUARY, 2022

 Air 100 Air 100
 Broad Beans 93 1 4 2 Broad Beans 82 17
 Brown Rice 2 84 3 7 1 1 1 Brown Rice 99 1
 Chick Peas 1 7 86 1 1 1 3 Chick Peas 34 65
 Flour 1 3 1 87 6 1 Flour 97 2
 True Class

 True Class
 Gravel Pebbles 95 5 Gravel Pebbles 1 1 75 22
 Oats 3 2 8 86 1 Oats 3 97
 River Pebbles 1 1 95 1 River Pebbles 15 85
 Salt 2 1 96 1 Salt 3 1 93 3
 Sugar 2 95 3 Sugar 2 98
 Top Soil 4 1 1 1 2 91 Top Soil 99
 White Rice 100 White Rice 2 98

 Air eans Rice eas lour bles Oats bles Salt ugar Soil Rice Air eans Rice eas lour bles Oats bles Salt ugar Soil Rice
 P F eb b S Top ite P F eb b S op ite
 d B rown hick P Pe d B wn ck P Pe T
 o a C el er Wh r oa Bro Chi av
 el er Wh
 Br B
 Gr
 av Riv B
 Gr Riv
 Predicted Class Predicted Class

 (a) Walabot (b) IMAGEVK-74
 Fig. 6: Classification confusion matrices for the two radar units (rounded to the nearest integer).

 80

 70 median TotalTime = 52 msec

 Computational Time (msec)
 60

 50

 40
 median AcquisitionTime = 40 msec
 30

 20 median WST Time = 11 msec

 10

 0
 0 100 200 300 400 500 600 700
 Number of Tests

 (a) Walabot
 80

 70
 Computational Time (msec)

 median TotalTime = 42 msec
 60

 50

 40

 (a) Walabot median WST Time = 24 msec
 30

 20 median AcquisitionTime = 12 msec

 10

 0
 0 100 200 300 400 500 600 700
 Number of Tests

 (b) IMAGEVK-74
 Fig. 8: Computational time in ms for the processing pipelines.

 the units allow sampling in the order of 20–25 Hz, which is
 suitable for applications like humanoid grasping and remote
 material sensing applications or interplanetary robotics.

 V. C ONCLUSIONS
 The aim of this paper was to investigate the suitability
 (b) IMAGEVK-74
 of centimeter- vs. millimeter-wave radar units for material
Fig. 7: Scatter plots for the first 3 components out of the 11 identification, by using both units with the same pattern
generated components after SR projection for the two radar recognition pipeline. Given the Deep WST’s ability to provide
units. By considering more features from the IMAGEVK-74 low-variance representations of the underlying signals, WST
scatter, the classification pipeline was able to further clarify was hence suggested for feature extraction in this pipeline. Our
any confusion between the classes. research found that both units can be used for material iden-
 tification, although the Walabot pipeline performed better in
KHUSHABA et al.: RADAR-BASED MATERIALS CLASSIFICATION USING DEEP WAVELET SCATTERING TRANSFORM 7

the online testing and had less confusion across classes in the [15] J. Anden and S. Mallat, ”Deep Scattering Spectrum,” in IEEE Transac-
offline tests. Overall, the IMAGEVK-74 unit had an average of tions on Signal Processing, vol. 62, no. 16, pp. 4114-4128, Aug.15, 2014,
 doi: 10.1109/TSP.2014.2326991.
90.66 ± 11.40% for its main diagonal of the confusion matrix, [16] S. Mallat, ”Group invariant scattering,” Communications on Pure and
while the Walabot had an average of 92.33±5.49%. While the Applied Mathematics, vol. 65, no. 10, pp. 1331-1398, 2012.
Walabot captures fewer signals than the IMAGEVK-74 (due to [17] V. Lostanlen and S. Mallat, ”Wavelet Scattering on the Pitch Spiral,”
 Proceedings of the 18th International Conference onDigital Audio Effects
fewer antenna pairings), it can be used to reliably solve this (DAFx-15), Trondheim, Norway, Nov 30 - Dec 3, pp. DAFX-1:DAFX4,
problem, at least in the context of the present experiments 2015.
and materials evaluated in this study. Given the high accuracy [18] W. Ghezaiel, L. Brun, and O. Lezoray, ”Wavelet Scattering Transform
 and CNN for Closed Set Speaker Identification,” Proceedings of the inter-
for single-material classification, further work is suggested in national workshop on Multimedia Signal Processing (MMSP), Tampere
mixed material samples, as will occur in applications and (Virtual conference), Finland, Sep 2020.
interplanetary scenarios, where identification of the mixed [19] J. Bruna and S. Mallat, ”Classification with invariant scattering repre-
 sentations,” Proceedings of the IEEE 10th IVMSP Workshop: Percep-
components may be of interest. tion and Visual Signal Analysis, pp. 99-104, 2011, doi: 10.1109/IVM-
 SPW.2011.5970362.
 [20] J. Bruna and S. Mallat, ”Invariant Scattering Convolution Networks,”
 ACKNOWLEDGMENT in IEEE Transactions on Pattern Analysis and Machine Intelligence, vol.
 The authors would like to acknowledge the support of the 35, no. 8, pp. 1872-1886, Aug. 2013, doi: 10.1109/TPAMI.2012.230.
 [21] B. Soro and C. Lee, ”A Wavelet Scattering Feature Extrac-
Avik Santra for providing feedback on [11] and [12]. Thanks tion Approach for Deep Neural Network Based Indoor Finger-
also extends to Stephen Leone from mini-circuits for their printing Localization”, Sensors, vol. 19, no. 8, pp. 1790, 2019,
support with the IMAGEVK-74 API and purchasing. https://doi.org/10.3390/s19081790.
 [22] L. Sifre and S. Mallat, ”Rotation, Scaling and Deformation Invari-
 ant Scattering for Texture Discrimination,” 2013 IEEE Conference
 R EFERENCES on Computer Vision and Pattern Recognition, pp. 1233-1240, doi:
 10.1109/CVPR.2013.163.
[1] K. Entesari, A. A. Helmy and M. Moslehi-Bajestan, ”Integrated Systems [23] J.Anden and S. Mallat, ”Multiscale Scattering for Audio Classification”,
 for Biomedical Applications: Silicon-Based RF Microwave Dielectric Proceedings of the ISMIR conference, pp. 657-662, 2011.
 Spectroscopy and Sensing,” in IEEE Microwave Magazine, vol. 18, no. [24] M. Andreux, T. Angles, G. Exarchakis, R. Leonarduzzi, G. Rochette, L.
 5, pp. 57-72, July-Aug. 2017, doi: 10.1109/MMM.2017.2690884. Thiry, J. Zarka, S. Mallat, J. Anden, E. Belilovsky, J. Bruna, V. Lostanlen,
[2] F. Kremer and A. Schonhals, Broadband Dielectric Spectroscopy. Berlin, M. Hirn, E. Oyallon, S. Zhang, C. E. Cella, and M. Eickenberg, ”Kymatio:
 Germany: Springer, 2012. Scattering Transforms in Python”, Journal of Machine Learning Research,
[3] R. Ebrahimi Ghiri and K. Entesari, ”A Miniaturized UWB Microwave vol. 21, no. 60, pp. 1-6, 2020.
 Dual-Comb Dielectric Spectroscopy System,” in IEEE Transactions on [25] S. Vishwakarma, V. Ummalaneni, M. S. Iqbal, A. Majumdar and S.
 Microwave Theory and Techniques, vol. 67, no. 12, pp. 5218-5227, Dec. S. Ram, ”Mitigation of through-wall interference in radar images using
 2019, doi: 10.1109/TMTT.2019.2946242. denoising autoencoders,” 2018 IEEE Radar Conference (RadarConf18),
[4] F. Kremer, ”Dielectric spectroscopy - Yesterday, today and tomorrow,” J. pp. 1543-1548, 2018, doi: 10.1109/RADAR.2018.8378796.
 Non-Crystalline Solids, vol. 305, no. 1-3, pp. 1-9, 2002. [26] Q. Liu et al., ”Non-Contact Non-Invasive Heart and Respiration Rates
[5] I. Ermolina, Y. Polevaya, Y. Feldman, B. -. Ginzburg and M. Schlesinger, Monitoring with MIMO Radar Sensing,” 2018 IEEE Global Communi-
 ”Study of normal and malignant white blood cells by time domain di- cations Conference (GLOBECOM), pp. 1-6, 2018, doi: 10.1109/GLO-
 electric spectroscopy,” in IEEE Transactions on Dielectrics and Electrical COM.2018.8648106.
 Insulation, vol. 8, no. 2, pp. 253-261, April 2001, doi: 10.1109/94.919948. [27] N. A. Buckingham, ”Ultra-wideband Radar Detection of Breathing
[6] B. P. Kwok, S. O. Nelson and E. Bahar, ”Time-Domain Measurements Rate: A Comparative Evaluation”, Master thesis, faculty of the Virginia
 for Determination of Dielectric Properties of Agricultural Materials,” in Polytechnic Institute and State University, 2020.
 IEEE Transactions on Instrumentation and Measurement, vol. 28, no. 2, [28] R. Wang, S. Xiang, C. Feng, P. Wang, S. Ergan, and Y. Fang, ”Through-
 pp. 109-112, June 1979, doi: 10.1109/TIM.1979.4314778. Wall Object Recognition and Pose Estimation”, Proceedings of the 36th
[7] M. Bouza, A. O. Altieri and C. G. Galarza, ”UWB target classification ISARC, Banff, Canada, pp. 1176-1183, 2019.
 using SVM,” 2018 IEEE Biennial Congress of Argentina (ARGENCON), [29] D. Avrahami, M. Patel, Y. Yamaura, and S. Kratz, ”Below the
 2018, pp. 1-8, doi: 10.1109/ARGENCON.2018.8646072. Surface: Unobtrusive Activity Recognition for Work Surfaces us-
[8] G. Agresti and S. Milani, ”Material Identification Using RF Sensors and ing RF-radar sensing”’. Proceedings of the 23rd International Con-
 Convolutional Neural Networks,” ICASSP 2019 - 2019 IEEE Interna- ference on Intelligent User Interfaces (IUI ’18). Association for
 tional Conference on Acoustics, Speech and Signal Processing (ICASSP), Computing Machinery, New York, NY, USA, pp. 439-451, 2018.
 2019, pp. 3662-3666, doi: 10.1109/ICASSP.2019.8682296. DOI:https://doi.org/10.1145/3172944.3172962
[9] H. S. Yeo, G. Flamich, P. Schrempf, D. Harris-Birtill, and A. Quigley, [30] H. Niu, Y. Wang, T. Zhao, Y. Chen, ”A Low-cost Soil Moisture
 ”Radarcat: Radar categorization for input & interaction,” In Proceedings Monitoring Method by Using Walabot and Machine Learning Algo-
 of the 29th Annual Symposium on User Interface Software and Technol- rithms”, IFAC-Papers OnLine, vol. 53, no. 2, pp. 15784-15789, 2020,
 ogy, pp. 833-841, ACM, 2016. https://doi.org/10.1016/j.ifacol.2020.12.206.
[10] H. S. Yeo, B. Ens, and A. Quigley, ”Tangible UI by object and material [31] D. Cai, X. He and J. Han, “SRDA: An Efficient Algorithm for
 classification with radar”, SIGGRAPH Asia 2017 Emerging Technologies, Large-Scale Discriminant Analysis,” in IEEE Transactions on Knowl-
 no. 14, pp. 1-2, 2017. https://doi.org/10.1145/3132818.3132824. edge and Data Engineering, vol. 20, no. 1, pp. 1-12, Jan. 2008, doi:
[11] J. WeiB and A. Santra, ”Material Classification using 60-GHz Radar and 10.1109/TKDE.2007.190669.
 Deep Convolutional Neural Network,” 2019 International Radar Confer-
 ence (RADAR), 2019, pp. 1-6, doi: 10.1109/RADAR41533.2019.171265.
[12] J. WeiB and A. Santra, ”One-Shot Learning for Robust Material
 Classification Using Millimeter-Wave Radar System,” in IEEE Sensors
 Letters, vol. 2, no. 4, pp. 1-4, Dec. 2018, Art no. 7001504, doi:
 10.1109/LSENS.2018.2878041.
[13] A. Brook, E. Cristofani, M. Vandewal, C. Matheis and J. Jonuscheit,
 ”3-D radar image processing methodology for Non-Destructive Testing
 of aeronautics composite materials and structures,” 2012 IEEE Radar
 Conference, 2012, pp. 0806-0811, doi: 10.1109/RADAR.2012.6212248.
[14] B. Jamali, D. Ramalingam and A. Babakhani, ”Intelligent Material
 Classification and Identification Using a Broadband Millimeter-Wave
 Frequency Comb Receiver,” in IEEE Sensors Letters, vol. 4, no. 7, pp.
 1-4, July 2020, Art no. 3501104, doi: 10.1109/LSENS.2020.3002715.
You can also read