Racial Inequality and Minimum Wages in Frictional Labor Markets
←
→
Page content transcription
If your browser does not render page correctly, please read the page content below
IRLE WORKING PAPER
 #101-21
 January 2021

Racial Inequality and Minimum Wages in Frictional Labor
Markets

Jesse Wursten and Michael Reich

Cite as: Jesse Wursten and Michael Reich. (2021). “Racial Inequality and Minimum Wages in Frictional Labor
Markets”. IRLE Working Paper No. 101-21.
http://irle.berkeley.edu/files/2021/01/Racial-Inequality-and-Minimum-Wages.pdf

http://irle.berkeley.edu/working-papers
January 25, 2021

 Racial Inequality and Minimum Wages in Frictional Labor
 Markets

 Jesse Wursten* and Michael Reich**

 We examine how the racial patchwork of federal and state minimum wage changes
 between 1990 and 2019 has affected racial wage gaps, with specific attention to
 effects on labor market frictions. Black workers on average are less likely to live in
 high-wage states that have raised their wage floors. The effect of state minimum
 wages on the national racial wage gap is thus not self-evident.
 Using five different causal specifications, including the “bunching” estimator of Cengiz
 et al. (2019), and data from the CPS and the QWI, we find that minimum wage changes
 since 1990 did reduce the 2019 racial wage gaps, by 12 percent among all workers
 and 60 percent among less-educated workers. The reductions are greater among
 black women and among black prime age workers. The gains for black workers are
 concentrated well above the new minimum wage, beyond the usual spillover
 estimates. Earnings of all race/ethnic/gender groups grew, with larger effects among
 black workers. We do not find disemployment effects for any group.
 Surprisingly, racial differences in initial wages do not explain the reduction in the
 racial wage gap. Rather, minimum wages expand job opportunities for black workers
 more than for white workers. We present a model in which minimum wages assist the
 job search of workers who do not own automobiles and who live farther from jobs.
 Our causal results using the ACS show that minimum wages increase commuting via
 automobile among black workers, supporting our model. Minimum wages also reduce
 racial gaps in separations and hires, further suggesting the policies especially enhance
 job opportunities for black workers.

Keywords: racial wage gaps, minimum wages, black wages, Hispanic wages, labor markets
JEL codes: J7, J15, J31, J38
We thank our universities for research support and Joslyn Jingjing Fu for excellent research
assistance. Benjamin Bowser, David Card, David Cooper, Anna Godoey, Joslyn Jingling Fu,
Lawrence Katz, Patrick Kline, Steven Raphael, William Spriggs, and members of the Berkeley
Labor Lunch provided helpful suggestions.
*KU Leuven; jesse.wursten@kuleuven.be. This author gratefully acknowledges financial support
of the Research Foundation Flanders (FWO) under grant number 1125818N.
**University of California, Berkeley; mreich@econ.berkeley.edu

1. Introduction
Racial wage and employment gaps have increased steadily since the late 1970s, both overall and
separately among males and females (Daly, Hobijn and Pedtke 2017; Miller 2018). This widening
has occurred despite reductions in black-white educational attainment and achievement score
gaps and the implementation of numerous policies to remedy labor market inequality. 1 The
fraction of the racial wage gap that cannot be explained by state of residence, years of schooling,
age, job type, industry and occupation has increased in this period (Daly et al. 2017).

In this paper, we consider the effects of minimum wage policy on these racial wage gaps. The Fair
Labor Standards Act was extended to more industries and occupations, especially in the latter
1960s, and intermittently since. As Derenoncourt and Montialoux (2021) show, these reforms
substantially reduced the racially disparate effects of the 1938 Act.

Federal and state minimum wage policies began to diverge in the late 1980s. The real value of the
federal minimum wage last increased in 2009 and remains approximately at its 1990s level. In
response, 29 states and the District of Columbia have enacted their own, higher, minimum wage
standards. These states tend to be higher cost and higher wage states, while those that remain at
the federal level consist mainly of low-wage states, many located in the Old South. These southern
states contain disproportionately large concentrations of black workers. In other words,
minimum wage policy in the U.S. has evolved in a manner that, despite the 1966 extensions, has
increasingly left behind black workers in low-wage states. This patchwork system of federal and
state minimum wage policies may therefore have increased national racial wage gaps, despite
potentially narrowing them in individual states.2

Our causal analyses find that the intermittent federal minimum wage increases and the growth
of state minimum wage policies since the 1990s have narrowed racial wage inequality. Our
counterfactual simulation indicates that, absent the policies, the gap in hourly wages between
black and white workers would have been 12 percent larger among all workers and 60 percent
larger among those with at most a high school diploma. These results are consistent with the
magnitudes in Derenoncourt and Montialoux (2021), who find that the minimum wage reforms
of that era reduced racial inequality by about 10 percent. They are inconsistent with the estimates
for subsequent years reported in Cengiz et al. (2019).3

1Reardon et al. 2014. The remaining racial gaps in educational attainment and achievement are increasingly

accounted for by increasing differences in parental income and education, as Reardon et al. show. As a
result, these racial educational gaps have not narrowed since 2002 (de Brey et al. 2019).
2 Black workers represent 6.7 percent of all employment in the [unweighted] median state-quarter in the

period since 1990, versus 4.9 percent in the state-quarters with at least one state minimum wage event
(defined as per Cengiz et al. 2019), a 27 percent difference (calculations based on the CPS).
3 Appendix A shows this possibility by comparing minimum wage effects in Mississippi and Washington

State. Cengiz et al. 2019 (Table I, column 2) report an average wage increase of 6.8 percent among all
workers and a wage increase of only 4.4 percent for the sample of black or Hispanic workers (Table II,
column 5; Cengiz et al. do not report wage effects for blacks or Hispanics with a high school degree or less.)
This discrepancy with our results may arise from compositional effects (e.g., minimum wage changes were
smaller in states with larger concentrations of black workers); our specifications are robust to such
confounding factors. Their bunching estimator requires large sample sizes, greater than the sample size
among blacks with a high school degree or less. In Figure 6 below we show that our finding of
disproportionate wage gains for black workers is supported by a simplified bunching estimator. The
estimator is simplified in the sense that we reduce the number of coefficients to be estimated and
harmonize the control variables with the treatment indicators.

 2
The reduction in racial wage inequality results less from pre-existing racial wage differentials
among the most exposed workers, but rather from black workers’ reacting more strongly to
minimum wage changes. Using an entropy balancing design that reweights observations to
equalize initial wages, we show that these differences cannot be explained by differences in initial
wages. Moreover, our bunching estimates (Cengiz et al. 2019) indicate that black wage gains are
concentrated among workers (eventually) earning $4 above the new minimum wage, well above
previous spillover effect ranges.
We present a model in which these disproportionate wage gains arise through the indirect effect
of minimum wage policies on the job opportunities of low-wage black workers. Higher minimum
wages expand the financial resources at their disposal, improve their credit ratings and thus their
access to automobile financing and to expanded commuting options. In turn, the expanded
commuting options allow black workers to reach better paying jobs and find better matches. This
mechanism is consistent with earlier findings on the mismatch between the location of black
workers’ residential locations and higher-paying job opportunities (Raphael and Riker 1999;
Miller 2018) and the minimum wage effects on credit access and car loans (Cooper, Luengo-Prado
and Parker 2020; Aaronson et al. 2012). We then use commuting data from the ACS Journey to
Work files and employment flow data from the Quarterly Workforce Indicators dataset to verify
empirically that minimum wage increases lead to higher rates of automobile commuting and
lower job turnover for black workers. These effects are either absent or considerably smaller for
white workers.
The gains for black workers do not crowd out those of white or Hispanic workers. Rather,
minimum wages increase earnings for all race/age/gender groups; they simply increase more for
black workers and women in general. We do not find any disemployment effects. 4 On the
contrary, black workers are less likely to lose their jobs after minimum wage changes. The wage
gains for all groups without disemployment effects makes sense if these policies reduce labor
market frictions.5

Relation to the literature The voluminous minimum wage literature includes numerous
estimates of the effects of the policy on black and white employment, but very few estimates of
the separate effects on black and white workers’ wages. The lion’s share of these studies focuses
only on racial gaps in employment effects. Card and Krueger (1995), who devote one chapter to
wage effects, report (p. 282) only that nonwhite workers are more exposed to minimum wages;
they do not estimate the policy’s effects on racial wage differentials. The same is true of the
extensive and more recent survey of the minimum wage literature by Belman and Wolfson
(2014). Allegretto, Dube and Reich (2011) show that minimum wages increase wages of black
teens more than wages of white teens. As we discuss below, teens constitute only 8 percent of all
workers. Our analysis focuses on workers with a high school diploma or less, who constitute 49
percent of respondents in our sample, thereby providing more generalizability.

Minimum wage policies may act directly upon the racial wage gap as well as indirectly through
the amelioration of other factors that generate racial inequality. As we have noted, our results

4 Manning (2020, 2021) reviews the relevance of labor market frictions in explaining the absence of
disemployment effects.
5 The minimum wage literature also shows that minimum wages are partly absorbed by productivity gains

(Ruffini 2020) and small price increases in some industries (Cooper, Luengo-Prado and Parker 2020).
Moreover, studies of noncompliance suggest that minimum wage increases do not always reach their
targets (Levine 2018) and that noncompliance differs by racial groups (Cooper and Kroeger 2017). This
literature is beyond our scope here.

 3
indicate that the direct mechanism alone cannot explain the reduction of the racial wage gap.
Indirect mechanisms that have been previously studied include effects on labor market
discrimination (Charles and Guryan 2008; Pager and Pedulla 2015), discrimination in tasks or
skills (Hurst et al. 2020), job search frictions (Raphael and Riker 1999; Johnson 2006; Stoll and
Covington 2012) and through interactions with other markets, such as housing, that constrain
black job opportunities (Ihlanfeldt and Sjoquist 1998; Bergmann et al. 2020).6 Our examinations
of racial differences in the effects of minimum wages on commuting modes and employment
flows lend support to an explanation based on reductions in search frictions for black workers.

Our paper is most related to Derenoncourt and Montialoux (2021) and Bailey, DiNardo and Stuart
(2020), both of whom examine the effects of the 1966 minimum wage reform on different racial
groups. Our paper uses subsequent policy changes and makes use of the longitudinal feature of
the CPS MORG data, which have rarely been used to study minimum wage effects. Our paper is
also related to the literature on heterogeneous effects of minimum wages (Cengiz et al. 2019;
Wursten 2020; Godoey and Reich forthcoming) as well as to an earlier literature on the political
economy of racial inequality by economists (Reich 1978, 1981; Alesina et al. 2001) and more
recent work by political scientists (such as Lopez 2014). This literature suggested that union
power and the extent of the welfare state are weakened by racial divisions, hurting white workers
as well as black workers.

Methods and results Our analyses focus on workers with a high school diploma or less. We begin
by using descriptive evidence to demonstrate that minimum wages continue to have the potential
to reduce racial inequality. Next, we use four causal estimation strategies to determine whether
minimum wages raise earnings more for black workers. We start with standard panel models
based on the CPS MORG, in line with Allegretto et al. (2017).

Second, to control more tightly for individual characteristics and better target our sample to
affected workers, we exploit that respondents report their earnings twice over a twelve-month
period. This setup closely resembles a difference in differences design, in which the pre- and post-
period are respectively the first and second wave of interviews; we determine treated vs control
status by the presence of a minimum wage change in the twelve months between interviews. This
approach also allows us to test whether minimum wage increases are race-neutral; that is, do
black and white workers at the same initial wage receive the same wage increase? Using an
entropy-balancing technique to reweight the black wage distribution, we find that minimum
wage increases are not at all race-neutral: our observed greater wage increases for black workers
do not diminish when we compare workers with similar initial wages.

Third, we run an event study at the state-quarter level to test for robustness to confounding time
trends (Cengiz et al. 2019, Godoey et al. 2019). Fourth, we implement a bunching estimator
(Cengiz et al. 2019), which provides additional information on the spread of wage gains
throughout the wage distribution.

6 These mechanisms are not mutually exclusive. For example, greater search frictions for black workers can
arise from employer discrimination as well as from spatial disparities between black neighborhoods and
the location of jobs. Much of the empirical debate about “race versus space” is based on cross-sectional data
that cannot identify causal effects (Glaeser, Hanushek and Quigley 2014). For two studies with a causal
research design, see Stoll and Raphael (2000) and Miller (2018). For a more detailed discussion of race and
labor market frictions, see Lang and Spitzer (2020).

 4
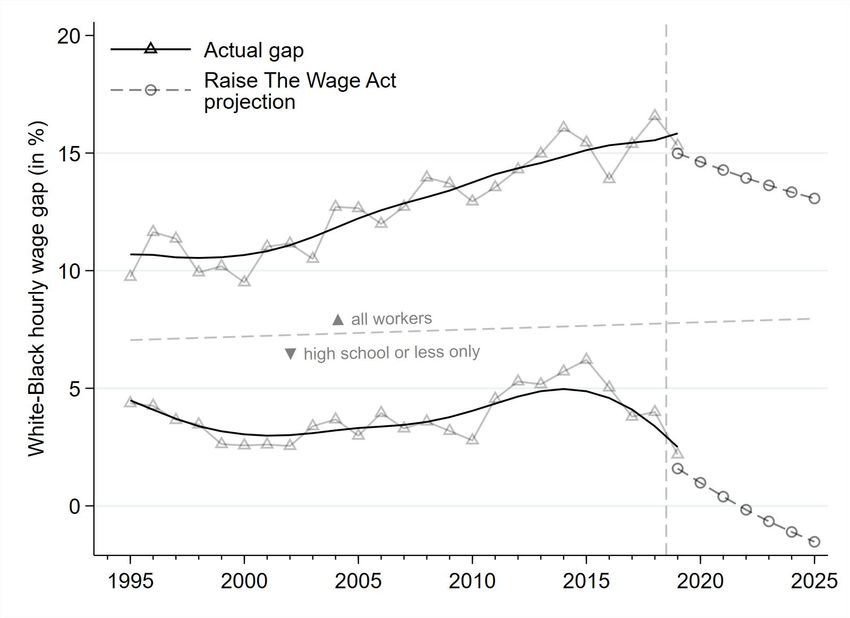
Since we find that the direct mechanical effects of minimum wage increases do not fully explain
the reduction in the racial wage gap, we then turn to possible indirect mechanisms that might be
at play. We develop a model motivated by previous studies that find that minimum wages have
large effects on credit ratings and on acquisition of automobiles. In the model, minimum wage
increases indirectly allow workers to switch from low to high outside option type. This
improvement of their bargaining position in turn leads to a new wage that can exceed the new
minimum wage. This channel is less relevant to white workers because they are more likely to be
situated in a location with good outside options and have higher starting wealth.

 We test the model by examining the effects of minimum wages on the probability of commuting
to work by automobile instead of public transit, using the American Community Survey Journey
to Work files.7 We find that higher minimum wages lead to increased automobile commuting for
young (ages 26-35) black workers in poor households. In line with our expectations, the effects
are smaller to non-existent for workers from richer households, workers 21 to 25 (who do not
easily qualify for car loans) and older workers (most of whom already own a car; see Appendix
Figure A3).

Additionally, we estimate the effect of minimum wages on job stability using the Quarterly
Workforce Indicator dataset. Here we follow the panel setup of Dube et al. (2016) and find that
turnover rates of food services workers decline twice as much among black workers, regardless
of specification. In line with our expectations, these effects are even stronger in low-wage
counties within states (see also Wursten 2020). They are also robust to using the Cross Border
County Pair method introduced in Dube et al. (2010).

Finally, we use our results to estimate the size of the racial inequality reduction that can be
attributed to the minimum wage. For workers with at most a high school education, minimum
wage increases since 1995 reduced the 2019 racial wage gap by 60 percent, from five percentage
points to two percentage points. They also reduced the overall racial wage gap by 12 percent and
reduced the growth of the racial wage gap by 20 percent.

Additional results We also find that minimum wages especially benefit female workers of all
race/ethnicities. Our findings for different age groups indicate that minimum wages have greater
wage effects on young (16-24) white workers than on young black workers. But they have larger
effects on black workers in prime age groups (25-54) than among white workers in those age
groups.

Some studies suggest that white workers believe that improvements for black workers must
come at the expense of the white workers (Craig and Richeson 2014). However, Lempinen shows
that explaining to white workers how black and white workers share common interests lead to
different results (Lempinen, 2020). Our finding that minimum wage policies increase white
workers’ wages indicates that the policies do not constitute a zero-sum game between blacks and
whites.8 This result explains the broad appeal of minimum wage policies to white workers.

We conclude that minimum wage increases continue to be a powerful tool for ameliorating racial
inequality, especially for workers at the bottom of the wage distribution.

7 We are the first to study of the effects of minimum wages on commuting modes. Public transit systems
outside central city limits generally are much slower per mile than commuting by automobile.
8 These findings are similar to those of Reich (1978, 1981).

 5
Our paper proceeds as follows. Section 2 discusses the data and institutional context. Section 3
presents our descriptive and causal evidence. Section 4 examines indirect effects. Section 5
provides our counterfactual simulation of how much minimum wage increases since 1995 have
remedied racial wage inequality. Section 6 concludes.

2. Data and institutional context
Our main analysis is based on three datasets: Current Population Survey Monthly Outgoing
Rotation Group (CPS-MORG) 9 files for individual-level characteristics and hourly wages, the
Quarterly Workforce Indicator (QWI) dataset for county-level employment stocks and flows
(hires, separations) and the regularly updated state minimum wage levels dataset described by
Vaghul and Zipperer (2019).

CPS Table 1 provides descriptive statistics for the 1990-2019 CPS sample. We exclude the self-
employed, those in the armed forces and unpaid family workers. 71 percent of the remaining
respondents are non-Hispanic whites, 10 percent are black and 11 percent are Hispanic. We
group the remaining race and ethnicities as well as mixed races in the restgroup Other.10 Teens
make up 9 percent of the full sample, increasing to 16 percent when we consider only those with
a high school degree or less (HSOL), and to 19 percent of those earning less than 1.5 times the 24-
month smoothed minimum wage (< 1.5 MW). They represent just 2 percent of workers earning
between 1.5 and 2.5 times the smoothed minimum wage.

A similar pattern emerges for those identifying as black or Hispanic. They are overrepresented in
the high school or less and < 1.5 MW subsamples and less present in the higher wage groups (e.g.
black workers make up just 6 percent of the > 2.5 MW group). The opposite holds for white
workers, providing suggestive evidence of an (unadjusted) racial earnings gap. Employment rates
differ substantially by race and ethnicity. They are highest for non-Hispanic white respondents
(72 percent), dropping to 65 and 61 percent for Hispanic and black respondents, respectively.
Rates are lower for those without a college degree. By construction, the initial employment rate
is 100 percent in the last three columns, as these are based on a wage criterion.

Hourly pay (in 2019 dollars) averaged $18 over the sample period, $0.74 higher for (non-
Hispanic) white workers and $3.20 and $2.09 lower for Hispanic and black workers. These
differences are less pronounced within low-wage groups, e.g. Hispanic workers earn more than
their white counterparts in the < 1.5 MW sample. On the other hand, white workers do earn an
average of $1.71 more per hour in the top wage group (> 2.5 MW). This difference in patterns
between the bottom group and the top wage group could result from the equalizing effects of
minimum wage policy at the bottom. The small differences in hourly pay by race and ethnicity for
workers in the
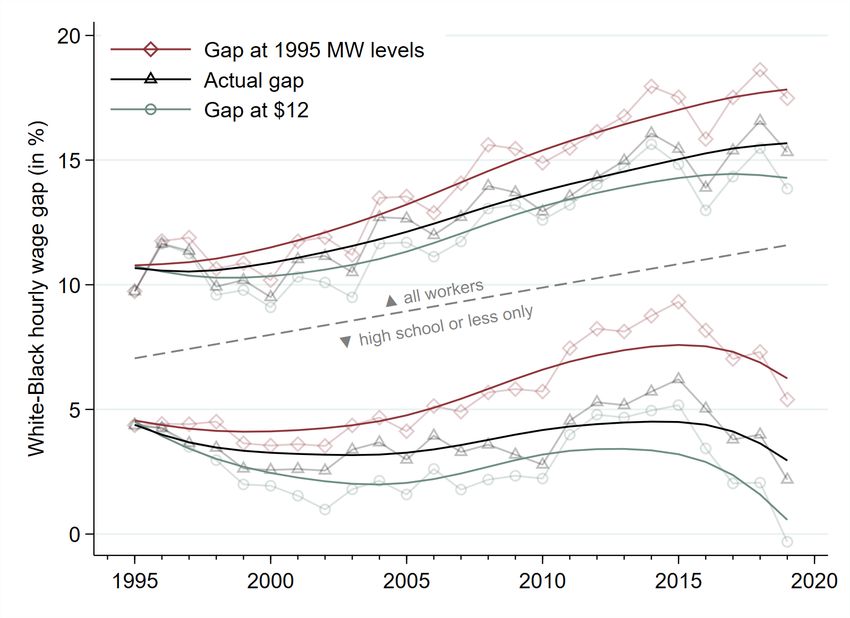
and flows for most U.S. counties.11 In recent years the QWI has incorporated race, gender and
ethnicity variables. The dataset is available in different endpoints, which split the data into
different population groups. We start from the ‘rh’ endpoint, which splits workers by their race
and ethnicity. We define hiring, separation and turnover rates as per Dube et al. (2016), where
each rate is defined as the new flows divided by employment at the start of the quarter ( 0 ), e.g.
 ℎ
the quarterly hiring rate = 0
 and the separation rate = 0
 . The turnover rate
is the average of the hiring and separation rate. We restrict all analysis to the food services sector
(NAICS 722).

 Table 1 CPS descriptive statistics
 Full Sample HSOL < 1.5 MW 1.5-2.5 MW >2.5 MW
 Sample shares 1.00 (0.00) 0.49 (0.50) 0.01 (0.08) 0.01 (0.09) 0.01 (0.09)
 Teen (16-19) 0.09 (0.28) 0.16 (0.36) 0.19 (0.39) 0.02 (0.14) 0.00 (0.04)
 Hispanic 0.11 (0.32) 0.16 (0.36) 0.16 (0.36) 0.10 (0.30) 0.05 (0.23)
 Black 0.10 (0.31) 0.12 (0.33) 0.10 (0.30) 0.09 (0.29) 0.06 (0.24)
 White 0.71 (0.45) 0.66 (0.47) 0.68 (0.47) 0.75 (0.43) 0.83 (0.37)
 Other 0.07 (0.25) 0.06 (0.24) 0.06 (0.24) 0.05 (0.23) 0.05 (0.21)

 Employed 0.70 (0.46) 0.60 (0.49) 1.00 (0.00) 1.00 (0.00) 1.00 (0.00)
 Hispanic 0.65 (0.48) 0.60 (0.49) 1.00 (0.00) 1.00 (0.00) 1.00 (0.00)
 Black 0.61 (0.49) 0.51 (0.50) 1.00 (0.00) 1.00 (0.00) 1.00 (0.00)
 White 0.72 (0.45) 0.62 (0.49) 1.00 (0.00) 1.00 (0.00) 1.00 (0.00)

 Hourly wage (2019$) 17.92 (10.72) 15.17 (7.76) 9.58 (1.54) 15.15 (2.57) 28.99 (9.68)
 Hispanic 14.72 (7.85) 13.41 (6.17) 9.84 (1.62) 15.12 (2.68) 27.41 (8.55)
 Black 15.83 (8.74) 13.80 (6.65) 9.42 (1.52) 14.82 (2.46) 27.42 (8.30)
 White 18.66 (11.15) 15.81 (8.14) 9.52 (1.51) 15.17 (2.55) 29.12 (9.75)
 Notes: White refers to non-Hispanic white workers. Table reports means, with standard deviations in parentheses.
 Statistics are unweighted. Hourly wages are in 2019 dollars, deflated using the CPI-U. HSOL refers to the high school
 or less sample. < 1.5 MW is the sample of workers earning less than 1.5 times the 24-month smoothed minimum wage.
 1.5-2.5 and > 2.5 MW are then the samples earning respectively between 1.5 and 2.5 and more than 2.5 times the 24-
 month smoothed minimum wage. These three groups are by definition employed. Period: 1990-2019. Data obtained
 through IPUMS.

Table 2 provides descriptive QWI statistics for 1990-2017. The average county employed about
500 black workers, 550 Hispanic workers and almost 3000 non-Hispanic white workers in the
food services sector (with large standard deviations). Quarterly hiring and separation rates are
high among white workers (40 percent) and higher still among black and Hispanic workers (over
50 percent), suggesting considerable workforce churn in this sector. Average monthly earnings
for black workers are also considerably lower than for their Hispanic and white coworkers.

Minimum Wages We observe 550 changes in federal and state minimum wages between 1990
and 2019, with an average size of $0.50 (8.4 percent).12 The bottom line in Figure 1 represents
the federal minimum wage floor, the lines above show states that decided to exceed the federal
floor. In 2019, the District of Columbia had the highest minimum wage, at $14 per hour.

11 The QWI fuzzes certain data cells to protect confidentiality. Moreover, entry into the QWI program was
staggered and non-random. In our baseline specification, we use all data provided in the QWI as is. All
results are robust to excluding heavily distorted cells and limiting the sample to 2000+, at which point most
states had entered the program.
12 We include small cost-of-living changes as they affect wages. We exclude local minimum wage changes

because of the limited CPS sample size.

 7
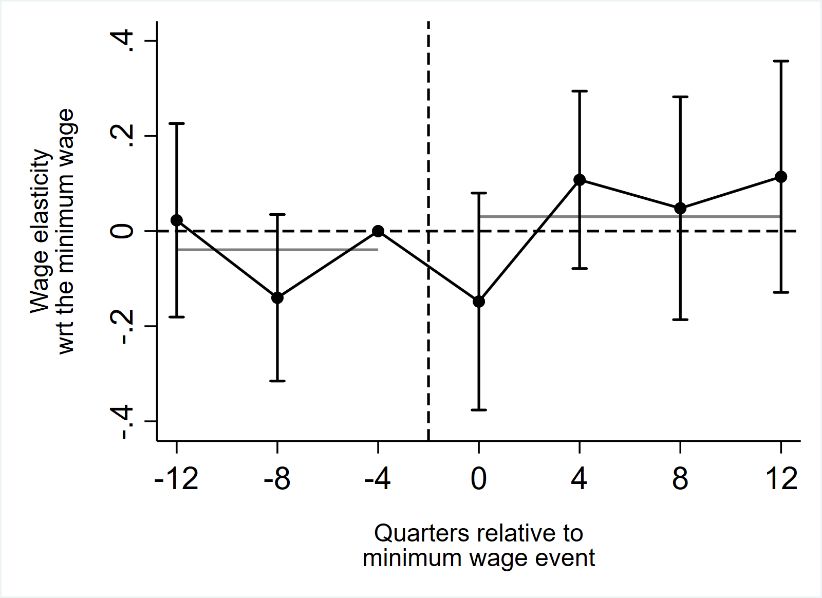
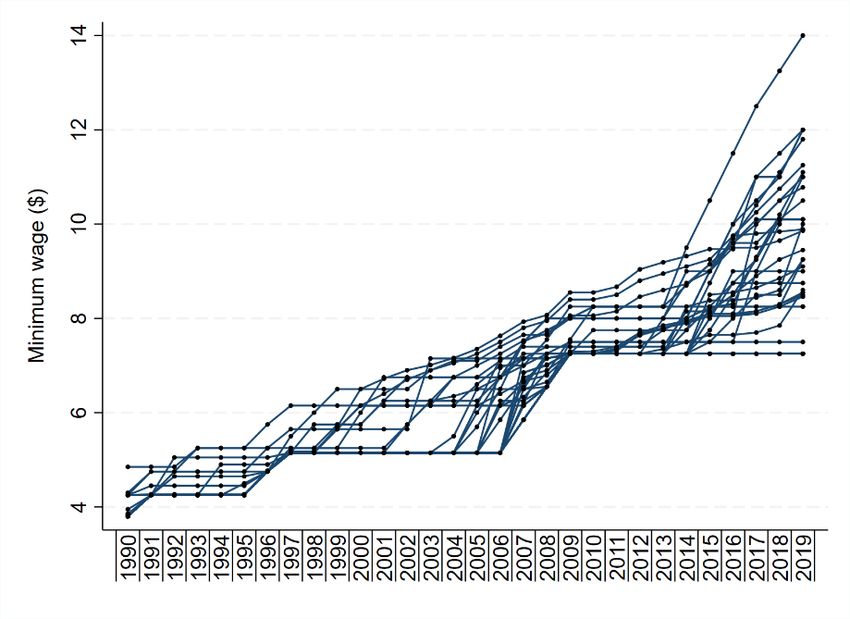
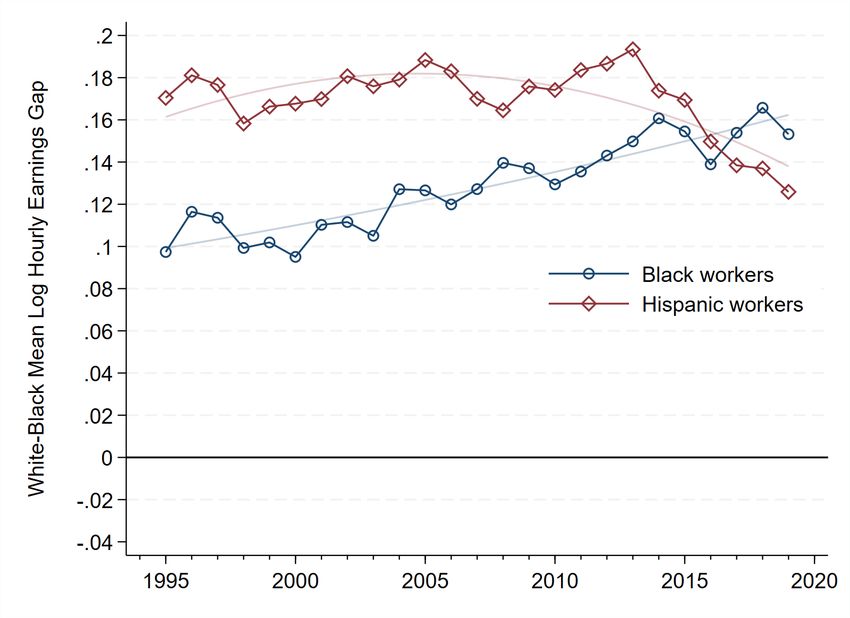
Table 2 QWI descriptive statistics
 Black Hispanic White
 Employment 499 (1596) 550 (2688) 2732 (6579)
 Hiring rate (%) 55 (36) 50 (41) 40 (16)
 Separation rate (%) 52 (28) 47 (29) 39 (13)
 Turnover rate (%) 54 (31) 49 (33) 40 (13)
 Monthly earnings ($) 816 (726) 913 (344) 924 (289)
 Notes: White refers to non-Hispanic white workers. Table reports means by county,
 with standard deviations in parentheses. Statistics are unweighted. Hiring rate is
 defined as new quarterly hires divided by start-of-quarter employment,
 analogously for separations. Turnover rate is the average of the two. Period: 1990-
 2017. Includes only counties with data on all three groups. Food services sector
 only (NAICS 722).

 Figure 1 Minimum wage evolution by state, 1990-2019

 Source: Vaghul and Zipperer 2019

3. Descriptive and causal results
In the first part of this results section, we present descriptive evidence of the continued existence
of racial earnings gaps. These differences illustrate why minimum wage policy could be a useful
tool to close those gaps. In the second part, we estimate causal models using the CPS-MORG to
show that minimum wages indeed raise wages more for black and Hispanic workers and that
these racial disparities cannot be explained by differences in initial wages.

3.1. Descriptive results
In this section we present trends in unadjusted and then adjusted racial earnings gaps since 1995.
We then explore the relative exposures of black, Hispanic and non-Hispanic white workers to
minimum wage increases as well as the predicted share of wage bill increases by race/ethnicity.
Unadjusted race/ethnicity earning gaps Figure 2 shows the unadjusted racial hourly earnings
gap from 1995 to 2019 for black and Hispanic workers versus (non-Hispanic) white workers,
using CPS-MORG individual level hourly wages. We aggregate log wages by year and

 8
race/ethnicity and then calculate differences relative to the average log wage of white workers.
 Over our sample period, black and Hispanic workers earn 10 to 20 percent less per hour than
 white workers.13 This gap has widened in recent years for black workers (from 10 percent to 16
 percent) and narrowed for Hispanic workers (from 17 percent to 12 percent).

 Figure 2 Unadjusted racial earnings gaps, 1995-2019

Notes: Based on CPS-MORG hourly wages. Weighted using MORG weights. Includes all earners above 16 years of age. Log
 wages are aggregated by race/ethnicity and year. Gaps can be roughly interpreted as percentage point differences. The
 lightly colored lines represent a quadratic fit of the yearly differences.

 Adjusted race/ethnicity earnings gaps. Figure 2 above does not account for demographic,
 geographic and other compositional differences among racial groups. In Table 3 we present
 race/ethnicity earnings gaps adjusted for state, time, age, gender and marital status differences
 as per Equation (1).

 ℎ = + + + + + + (1)

 The dependent variable is the log hourly wage in 2019 dollars of individual i in month t. We
 include state, quarter, age, gender and married status fixed effects. We do not control for
 education or industry as these might themselves reflect race/ethnicity gaps.

 13 The black-white earnings gap in Derenoncourt and Montialoux (2021, figure 1) is somewhat larger than
 ours (25 percent versus 16 percent). They display annual earnings, for workers 25 to 64 only, which are
 affected by differences in hours worked per year as well as by differences in hourly wages. And their
 measure abstracts from the large declines in the proportion of young workers, who are more exposed to
 minimum wages. Our concern is with hourly pay among workers of all ages, including young workers. We
 examine age differences in minimum wage effects below.

 9
Table 3 shows the coefficients on the race/ethnicity dummies . These coefficients estimate
the earnings gap relative to white workers, controlling for individual characteristics.

 Table 3 Adjusted racial earnings gaps, 1990-2019
 Earnings gap
 Hispanic -0.24***
 (0.02)
 Black -0.12***
 (0.01)

 N 2,482,159
 Notes: The reference category is non-Hispanic whites. Period: 1990-
 2019. Data: CPS-MORG. Replication tag: #adjRacialGap. Standard
 errors in parentheses, clustered at state level. Stars: * p
Predicted share of wage bill increase by race/ethnicity Additionally, we examine whether a
disproportionate share of the wage bill increase goes to black and Hispanic workers if compliance
is perfect and there are no wage spillovers. For each year y and ethnicity r we calculate the total
weekly wage bill,

 = ∑ ℎ ∗ ℎ (3)
 ∈( , )

Then we calculate how much the hourly wage of worker i would need to change to comply with
minimum wage regulation six months in the future. Multiplied by initial hours worked, this gives
us the wage bill increase by year and ethnicity,

 = ∑ max[( , +6 − ℎ ) ∗ ℎ , 0] (4)
 ∈( , )

For each ethnicity we then calculate its share of the wage bill (5a), its share in the wage bill
increases (5b) and the ratio thereof (5c):

 ℎ = (5a)
 ∑

 ℎ = (5b)
 ∑

 ℎ
 ℎ = (5c)
 ℎ
where collects the relevant ethnicities studied. If wages are identically distributed among
race/ethnic groups (and minimum wage effects are homogeneous), then we would expect
shareRatiory to equal one for all race/ethnic groups. If individual race/ethnic groups stand to
benefit more from minimum wage increases, we would expect their ratios to exceed one, which
is what we find in Figure 3.

In all years except 1994 and 1999, the projected share of Hispanics and black workers in the total
wage bill increase exceeds their share of the total wage bill (ratio >1).15 The right panel of Figure
3 shows that this would continue to hold if the federal minimum were increased to $15 per hour.16
In summary, these descriptive statistics suggest that minimum wage increases should have a
modest direct effect on reducing racial and ethnic wage inequality.

3.2. Causal estimates
In this section, we present our causal estimates. We begin with our main results, which exploit
between-state variation in minimum wage changes to examine whether wage effects vary by race
and ethnicity. We then extend this analysis to incorporate differences by gender and age. Next,
we examine within-individual effects, exploiting the longitudinal feature of the CPS MORGs. We

15 Vermont was the only state with a projected minimum wage increase in 1994; and was 99.2 percent
white at the time.
16 We combined the two minorities for readability. Appendix Figure A1 shows that the results hold when

we plot the results for Hispanic and black workers separately, albeit with more noise.

 11
then use entropy balancing to test whether the effects of minimum wage changes result from
differences in initial wages. This test addresses the racial neutrality of the policy.

 Figure 3 Ratio of share in wage bill increase to share in wage bill, by race/ethnicity

 Notes: Based on CPS-MORG hourly wages. Left panel shows ratio of wage bill increase share relative wage bill share
 by racial group. A value above one indicates that the group receives a larger share of the wage bill increase due to
 minimum wage changes than their initial share in the total wage bill. We use actual minimum wages, but calculate
 wage bill increases as they would be in a world of perfect compliance but zero wage spillovers or employment
 effects.

Between-state variation—main results Using the CPS, we leverage state-level variation in
minimum wages to evaluate whether minimum wages raise wages and whether such wage effects
are heterogeneous by race and ethnicity. We perform separate regressions by race, as per
Equation 3, on a sample of workers with a high school diploma or less. The dependent variable
 is either the log hourly wage in 2019 dollars or an employment dummy (one: employed; zero:
not employed). The variable of interest is the log minimum wage in state s. We add the
monthly state unemployment rate as well as state, age, gender, education and married
status dummies to control for individual characteristics.

 = ∗ + + + +
 + + + +

 (6a) 2FE = ℎ (6)

 (6b) Trends = ℎ + ∗ ℎ
We show the results in Table 5. The earnings coefficients are elasticities (percent change in hourly
wage due to a one percent change in minimum wage). Panels A and B display results for the two-
way fixed effects (2FE) model, which includes state and month fixed effects. Panels C and D show
comparable results for the Trends model, which adds linear state time trends and, following

 12
Allegretto et al. (2017), is our preferred model. The wage cutoff, at $20 in 2019 dollars, reduces
the share of workers in the sample unaffected by minimum wage policies.

We display results for both the entire sample period 1990-2019 and for the sample period 2002
to 2019. Previous research (Cengiz et al. 2019) has demonstrated that welfare reform and the
introduction of the Earned Income Tax Credit in the 1990s and some peculiarities of the 2001
recession can confound minimum wage estimates, especially for teens. We therefore regard the
period since 2002 as our preferred sample.

In the 2FE model with all years and no wage cutoff, earnings effects are smaller for black workers.
This result reverses if we consider our preferred sample from 2002-2019. Including the wage
cutoff in the 2FE model raises the wage elasticities but does not result in any difference among
race/ethnicity groups (Panel B).

 Table 5 Minimum wage effects on wages, by race/ethnicity
 All years 2002 to 2019
 Log hourly wage (1) (2) (3) (4) (5) (6)
 White Hispanic Black White Hispanic Black
 A. 2FE no wage cutoff 0.07*** 0.10** 0.04 0.06** 0.06** 0.08**
 (0.03) (0.04) (0.04) (0.02) (0.03) (0.04)
 N 942065 209448 138326 352850 115665 49522
 B. 2FE with wage cutoff 0.12*** 0.12*** 0.10*** 0.12*** 0.10*** 0.12***
 (0.02) (0.03) (0.03) (0.02) (0.02) (0.03)
 N 724813 186130 119471 277012 103966 44357
 C. Trends no wage cutoff 0.09*** 0.10** 0.18*** 0.06** 0.11** 0.10***
 (0.02) (0.05) (0.04) (0.02) (0.05) (0.03)
 N 942065 209448 138326 352850 115665 49522
 D. Trends with wage cutoff 0.12*** 0.10** 0.17*** 0.11*** 0.13*** 0.13***
 (0.02) (0.04) (0.03) (0.02) (0.04) (0.03)
 N 724813 186130 119471 277012 103966 44357
 Notes: White refers to non-Hispanic white workers. Wage cutoff specifications exclude workers earning more than
 $20 in 2019 dollars. Weighted by the outgoing rotation group person-weights. Sample years include either 1990-
 2019 or 2002-2019. Restgroup consisting of other race/ethnicities not shown in table. Restricted to workers with
 at most a high school degree. See Appendix Figure A2 for an analysis of pre-existing trends. Data: CPS-MORG.
 Replication tag: #ptr_microState_base. Standard errors in parentheses, clustered at state level. Stars: * p
elasticities for black workers are larger for both genders, indicating that our results are not driven
by racial differences in gender composition in the workforce.
The age-specific results in Table 7 follow the expected pattern, with wage effects largest for
teens/young adults (16-24 years old) and older workers (55-100). Nevertheless, for black and
Hispanic workers we also see meaningful wage increases for adult workers (25-…-54), indicating
the gains from minimum wages are widely distributed.

 Table 6 Minimum wage effects on wages, by race/ethnicity and gender
 Log hourly wage (1) (2) (3)
 White Hispanic Black
 Male 0.04* (0.02) 0.09* (0.05) 0.13*** (0.04)
 Female 0.14*** (0.02) 0.12** (0.05) 0.22*** (0.04)
 A. All
 N 942,065 209,448 138,326
 Male 0.08*** (0.02) 0.09** (0.04) 0.14*** (0.03)
 Female 0.14*** (0.02) 0.11*** (0.04) 0.20*** (0.03)
 B. Wage cutoff
 N 724,813 186,130 119,471
 Male 0.07*** (0.02) 0.08** (0.03) 0.08** (0.03)
 C. Wage cutoff Female 0.14*** (0.02) 0.20*** (0.05) 0.16*** (0.03)
 Post 2002
 N 277,012 103,966 44,357
 Notes: Trends specification only, restricted to workers with at most a high school degree. White refers to
 non-Hispanic white workers. Wage cutoff specifications exclude workers earning more than $20 in 2019
 dollars. Weighted by the outgoing rotation group person-weights. Sample years include either 1990-
 2019 or 2002-2019. Restgroup consisting of other race/ethnicities not shown in table. Data: CPS-MORG.
 Replication tag: ptr_microState_gender. Standard errors in parentheses, clustered at state level. Stars: *
 p
(ℎ − ℎ ) = ∗ (
 )
 −
 2
 ℎ ℎ
 + + ( ) +

 + + 5 + + + 8 + +
 (7a) 2FE = (7)
 (7b) Trends = + ∗ ℎ
The dependent variable is the log difference in the deflated hourly wages for an individual i first
observed in month t. The superscripts A and B refer respectively to the first observation (in
month t) and the second observation (in month t+12). The variable of interest is the change in the
minimum wage between the first and second observation. The coefficient has a subscript r to
indicate we allow the effect to differ by race (non-Hispanic white, black or Hispanic). This
notation also applies to the control variables and fixed effects.

 Table 7 Minimum wage effects on wages, by race/ethnicity and age group
 (1) (2) (3)
 Log hourly wage
 White Hispanic Black
 A. All 16-24 0.16*** (0.02) 0.16*** (0.04) 0.27*** (0.04)
 25-34 0.03 (0.02) 0.10* (0.05) 0.18*** (0.04)
 35-44 0.04 (0.02) 0.07 (0.05) 0.12*** (0.04)
 45-54 0.05* (0.03) 0.09 (0.06) 0.09* (0.05)
 55-100 0.14*** (0.03) 0.12* (0.06) 0.26*** (0.04)

 N 942,065 209,448 138,326
 B. Wage cutoff 16-24 0.14*** (0.02) 0.13*** (0.04) 0.20*** (0.03)
 25-34 0.05*** (0.02) 0.09** (0.04) 0.16*** (0.03)
 35-44 0.08*** (0.02) 0.07 (0.04) 0.15*** (0.03)
 45-54 0.10*** (0.02) 0.10** (0.05) 0.12*** (0.04)
 55-100 0.18*** (0.02) 0.12** (0.05) 0.25*** (0.04)

 N 724,813 186,130 119,471
 C. Wage cutoff 16-24 0.17*** (0.02) 0.18*** (0.04) 0.15*** (0.03)
 Post 2002 25-34 0.05** (0.02) 0.12*** (0.03) 0.09** (0.04)
 35-44 0.06*** (0.02) 0.10** (0.04) 0.13*** (0.03)
 45-54 0.05** (0.02) 0.12*** (0.04) 0.11** (0.04)
 55-100 0.14*** (0.02) 0.16*** (0.05) 0.18*** (0.03)

 N 277,012 103,966 44,357
 Notes: Trends specification only, restricted to workers with at most a high school degree. White refers to
 non-Hispanic white workers. Wage cutoff specifications exclude workers earning more than $20 in 2019
 dollars. Weighted by the outgoing rotation group person-weights. Sample years include either 1990-
 2019 or 2002-2019. Restgroup consisting of other race/ethnicities not shown in table. Data: CPS-MORG.
 Replication tag: #ptr_microState_age. Standard errors in parentheses, clustered at state level. Stars: *
 p
locations in the wage distribution may experience different wage growth even in the absence of
a minimum wage change.20

The race/ethnicity, state, age, gender, married and education dummies control for individual
characteristics of the worker. The variable adds quarter dummies (2FE model) or quarter
dummies plus linear state time trends (Trends model).

Minimum wages affect only those earning low wages. In our main regressions we therefore
restrict the sample to workers earning up to 1.5 times the 24-month average minimum wage in
the baseline period.21 We perform placebo tests on workers for whom the ratio falls between 1.5
and 2.5, as well as on workers for whom the ratio exceeds 2.5. These results test the robustness
of our results to using different estimation methods and different sample selection criteria.

We present earnings results for this within-individuals estimation in the top panel of Table 8. For
the sample with wages
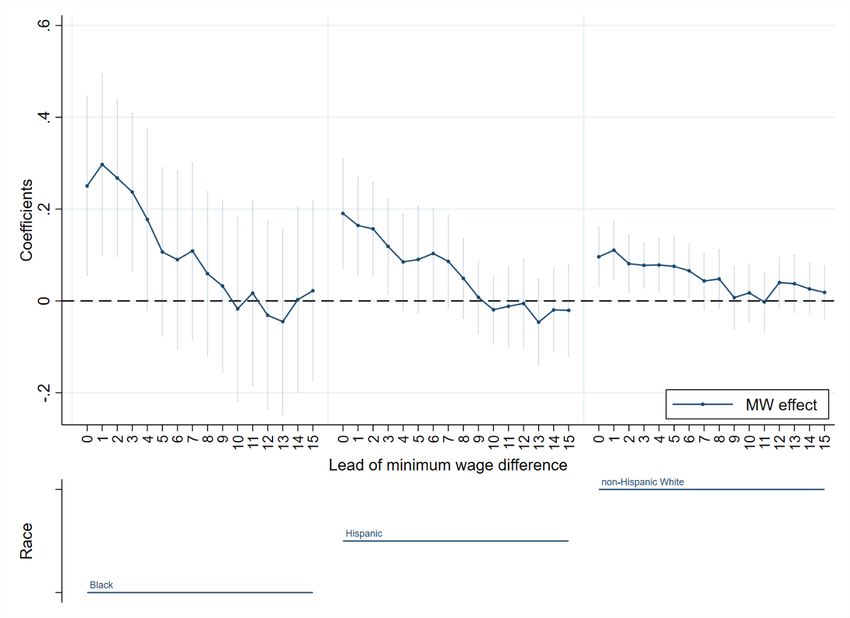
Table 8 Minimum wage effects on wages and employment, by race/ethnicity
 Within-individual estimates
 Trends 2FE
 DV: Difference window B
 (1) (2) (3) (4) (5) (6)
 - window A
 < 1.5 1.5-2.5 > 2.5 < 1.5 1.5-2.5 > 2.5
 White 0.10*** 0.04 0.03 0.11*** 0.05* 0.04
 (0.03) (0.03) (0.03) (0.03) (0.03) (0.04)
 Hispanic 0.19*** -0.01 0.00 0.25*** 0.04 0.02
 A. Wages (0.06) (0.03) (0.06) (0.06) (0.03) (0.07)
 Black 0.25** -0.05 -0.00 0.18* -0.04 -0.01
 (0.10) (0.06) (0.05) (0.10) (0.06) (0.06)

 N 155,005 217,282 208,909 155,005 217,282 208,909
 White 0.04 -0.01 0.00 0.03 -0.00 0.01
 (0.02) (0.02) (0.01) (0.03) (0.02) (0.01)
 Hispanic 0.03 0.05 -0.00 0.01 0.04 0.02
 B. Employment (0.05) (0.05) (0.05) (0.04) (0.04) (0.05)
 Black 0.31*** 0.01 -0.02 0.30*** 0.01 -0.02
 (0.11) (0.07) (0.04) (0.10) (0.07) (0.04)

 N 230,213 306,494 297,419 230,213 306,494 297,419
Notes: White refers to non-Hispanic white workers. Weighted by the outgoing rotations group person weights.
 Restgroup of other race/ethnicities not shown in table. The dependent variable in Panel B is a dummy indicating
 whether the individual i was employed at their second observation (month 16 of the CPS). As a result, the dependent
 variable will be 0 if the respondent is employed in both periods and -1 if they lose their job. Over the entire sample,
 18.9% of black workers lost employment in the 12 month window between interviews. Replication tag:
 #ptr_microInd_baseline. Standard errors in parentheses, clustered at state level, ∗ p < 0.1, ∗∗ p < 0.05, ∗∗∗ p < 0.01.

As Figure 5 shows, we indeed find positive wage effects for each racial group at the original
window (k=0, cf. Table 8), which gradually decline as we shift the window forward. The gaps then
stabilize around an insignificant effect that is close to zero, after a shift of 8 to 10 months. These
results suggest the within-individual results are not affected by confounding time trends.

 Figure 4 Time placebo illustration

 Notes: Illustration of the time placebo concept. Original minimum wage window is shown for t=[0,12]. At k=3, the time
 placebo still overlaps the original window and could thus pick up actual effects. At k = 13 there is no overlap anywhere
 and we would expect a zero effect (as we do not expect future minimum wages to affect contemporaneous wages and
 employment).

Race neutrality of the minimum wage Table 9 shows that the racial differences in wage gains
cannot be explained purely by initial racial wage differences. Column (1) repeats the baseline
estimate of Table 8. In column (2) we use entropy balancing (Hainmueller and Xu 2013) to
remove differences in average wages among the three racial groups.23 The sample for columns
(3) and (4) excludes race-state-year cells with fewer than five observations so that we can use

23 Specifically, we reweight the Hispanic and black worker observations such that their average initial wage
equals that of the white workers in the sample. We do not balance the other covariates as they are either
the variable of interest (minimum wage changes) or because our baseline specification is already very
flexible in that dimension (e.g. small age group dummies with race-specific coefficients).

 17
entropy balancing to remove average differences at the state-year level. Column (3) shows the
 results using the initial outgoing rotation group person weights for this reduced sample and
 column (4) uses the adjusted weights generated by the entropy-balancing routine.
 If the racial differences in wage gains resulted primarily mechanically from racial differences in
 initial wages, we would expect to find much smaller effects after we balance initial wages by race.
 Instead, we find that the size and significance of the white-black differential is basically
 unchanged. This finding holds whether we balance the overall sample or each state-year cell. In
 other words, minimum wage policy particularly benefits black workers beyond what we would
 expect, based on the initial wage distribution of black and white workers. These results suggest
 that black workers receive indirect benefits from the policy.24 We discuss these indirect effects
 further in Section 3.3.

 Figure 5 Time placebo test of within-individual earnings effects by race/ethnicity

Notes: Figure shows time placebo test for the estimates of column (1) in Table 8 (within-individual estimates of the effect of
 minimum wages on earnings growth over one year). The first panel shows the effect for black workers, the second for
 Hispanic workers and the final panel for non-Hispanic white workers. The x-axis shows the k in ( , +
 − , + ).
 Because we cover a one-year span, positive earnings effects up to 12 months ahead are in line with expectations, whereas
 effects beyond that would indicate the presence of spurious correlations. The vertical bars show 95 percent confidence
 intervals (standard errors clustered at the state level).

 24 This pattern remains if we restrict our earnings measure to either the hourly measure (which excludes
 tips) or the weekly earnings (divided by usual hours worked) measure, which includes tips. We also
 conducted entropy-balancing reweighting on subsamples, such as by gender, industry and for High School
 or Less. The results remained the same.

 18
Table 9 Race neutrality of minimum wage effects on wages
 Within-individual estimates
 (1) (2) (3) (4)
 Dependent
 Full sample State year sample
 variable: Wages
 Base Overall Unadjusted Adjusted
 White 0.10*** 0.10*** 0.10*** 0.10***
 (0.03) (0.03) (0.03) (0.03)
 Hispanic 0.19*** 0.20*** 0.20*** 0.08
 (0.06) (0.06) (0.06) (0.07)
 Black 0.25** 0.25** 0.28*** 0.24**
 (0.10) (0.10) (0.10) (0.10)

 N 155,005 155,005 152,018 152,018
 Notes: White refers to non-Hispanic white workers. Column (1) repeats the baseline estimate of Table 8. All columns are
 based on the trends specification and limited to workers earning < 1.5 times the minimum wage. In column (2) we
 use entropy balancing to ensure the average wage of all racial groups equals that of white workers. In column (4) we
 use entropy balancing to ensure this holds per state and year. As some state-year combinations have none or very
 few observations for certain racial groups, we exclude workers of that race for those state-year combinations. Column
 (3) shows unbalanced (= weighted by the outgoing rotation group person weights) estimates for that reduced sample.
 Restgroup of other race/ethnicities not shown in table. Replication tag: #ptr_microInd_raceNeutrality. Standard
 errors in parentheses, clustered at state level, ∗ p < 0.1, ∗∗ p < 0.05, ∗∗∗ p < 0.01.

 Table 10 Minimum wage effects on wages, by race/ethnicity and age
 Within-individual estimates, three age groups. 1990-2019
 A. Wages B. Employment
 (1) (2) (3) (4) (5) (6)
 < 1.5 1.5-2.5 > 2.5 < 1.5 1.5-2.5 > 2.5
16-24 White 0.12*** 0.08 -0.04 0.09*** -0.01 -0.12
 (0.04) (0.06) (0.11) (0.03) (0.04) (0.08)
 Hispanic 0.27*** -0.14* 0.17 -0.03 0.08 -0.15
 (0.06) (0.08) (0.19) (0.08) (0.11) (0.24)
 Black 0.08 -0.04 -0.33 0.28* 0.17 0.30
 (0.10) (0.15) (0.40) (0.14) (0.14) (0.25)
25-54 White 0.09** 0.03 0.03 -0.00 0.00 0.02
 (0.04) (0.03) (0.04) (0.03) (0.02) (0.01)
 Hispanic 0.13* 0.02 -0.02 0.06 0.06 0.02
 (0.07) (0.03) (0.07) (0.05) (0.04) (0.06)
 Black 0.33*** -0.04 0.05 0.36*** 0.01 -0.02
 (0.11) (0.06) (0.06) (0.13) (0.07) (0.05)
55-100 White 0.05 0.04 -0.01 -0.03 -0.05 -0.07***
 (0.05) (0.03) (0.03) (0.05) (0.04) (0.02)
 Hispanic 0.31*** -0.09 0.11 0.05 -0.01 -0.13
 (0.11) (0.07) (0.14) (0.10) (0.12) (0.09)
 Black 0.31 -0.14 -0.15 0.23 -0.15 -0.09
 (0.21) (0.14) (0.11) (0.17) (0.12) (0.07)

 N 155005 217282 208909 230213 306494 297419
Notes: White refers to non-Hispanic white workers. Weighted by the outgoing rotations group person weights. Restgroup
 of other race/ethnicities not shown in table. The dependent variable in Panel B is a dummy indicating whether the
 individual i was employed at their second observation (month 16 of the CPS). As a result, the dependent variable will
 be 0 if the respondent is employed in both periods and -1 if they lose their job. Controls are interacted by age group,
 fixed are pooled across age groups. Period: 1990-2019, data: CPS-MORG. Replication tag: #ptr_microInd_age3.
 Standard errors in parentheses, clustered at state level, ∗ p < 0.1, ∗∗ p < 0.05, ∗∗∗ p < 0.01.

 19
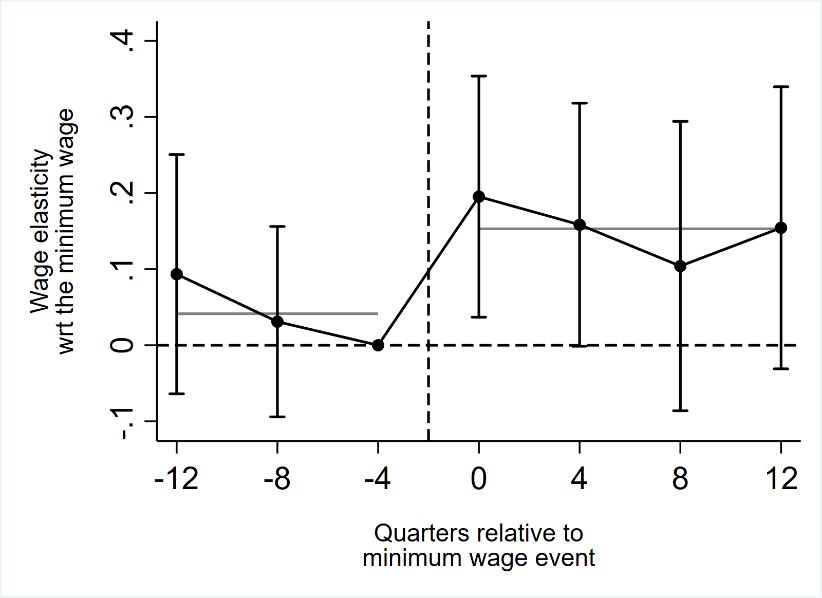
Within-individual effects by gender and age Appendix Table A7 shows that the within-
individual minimum wage effects are similar across genders, with two exceptions. The positive
earnings effect for white workers appears concentrated among women (+0.11 vs +0.07), whereas
the positive employment effect for black workers is particularly pronounced for men (+0.41 vs
+0.25).25
Table 10 shows within-individual results by age groups for our preferred Trends specification.
We collapse ages to three groups (youth: 16-24, adults: 25-54, older adults: 55-100) due to
sample size constraints. 26 Again, we find that adult black workers particularly benefit from
minimum wage increases, whereas among white workers the benefits are concentrated among
younger workers. We find positive employment retention effects for black workers of all ages (at
differing significance levels) and for white youths.
Event study We also implement an event study analysis at the state-quarter level. We use the
outgoing rotation group person weights to aggregate the individual level CPS data, restricting the
sample to workers with at most a high school diploma who earn less than $20 (2019 dollars). The
event study design follows Cengiz et al. (2019) and Godoey et al. (2019). We define treatment
events as all minimum wage increases exceeding five percent that do not coincide with federal
minimum wage increases. The control states for each event are then those states that do not
experience such a qualifying minimum wage increase during the event window (3 years prior, 4
years post).
This yields 143 events between 1990 and 2019. For each event e, we define the event moment as
 and group the event time indicators by year relative to the event:
 −12 = 1 ∈ [ − 12, − 9]
 Pre −8 = 1 ∈ [ − 8, − 5]
 −4 = 1 ∈ [ − 4, − 1]
 Contemporaneous 0 = 1 ∈ [ , + 3] (8a)
 +4 = 1 ∈ [ + 4, + 7]
 Post +8 = 1 ∈ [ + 8, + 11]
 +12 = 1 ∈ [ + 12, + 15]
We interact those event time indicators with the size of the log minimum wage increase, ,
and an indicator variable identifying the treated state in each event, . We include event
specific state and quarter fixed effects:

 = + + ∑( ∗ ∗ Δmw ∗ ) + + (8b)

where k iterates over the event time indicators defined in Equation (8a). All variables include a
subscript e to indicate we stack observations per event and includes education, age,
married status and gender shares as well as three indicator variables equal to one if in quarter t
state s has experienced respectively a qualifying, small or federal minimum wage change in the
past 4 years.27 We omit −4 , as the coefficients are only identified relative to each other. The

25 Based on Appendix Table A7, where we allow for gender-specific coefficients for the minimum wage and
the control variables (unemployment rate and the wage to median wage ratios) but pool the fixed effects
to avoid saturating the model entirely. We show complete split sample results in Appendix Table A8 and
Appendix Table A9. The results are qualitatively similar, except for the placebo tests. For example, we find
significant wage effects in the 1.5-2.5 group for black workers.
26 Appendix Table A10 shows that results based on five groups are too noisy to be useful.
27 We include an indicator for qualifying minimum wage events to account for treated states that

experience multiple qualifying events in one event window. A small minimum wage change is one that does
not meet the 5 percent threshold.

 20
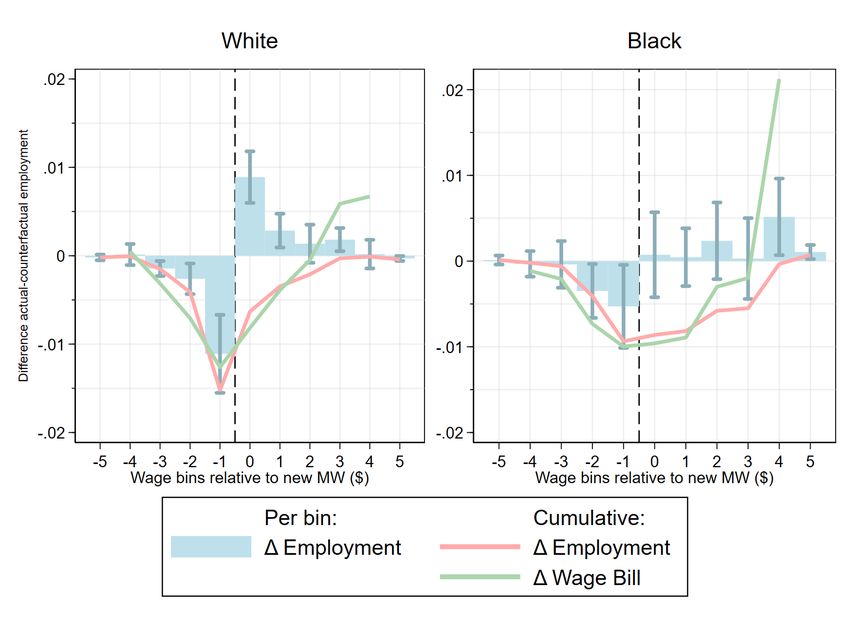
dependent variable is either the average log hourly wage or the share of the sample that is
employed in state s at quarter t.
 Table 11 Minimum wage effects on wages and employment.
 Event study estimates. 1990-2019
 White Hispanic Black
 Wages Pre 0.02 (0.03) 0.06 (0.07) 0.05 (0.09)
 Post 0.11 (0.05)** 0.15 (0.07)** 0.15 (0.08)**

 N 115353 108605 101191
 Employment Pre 0.00 (0.03) -0.04 (0.06) -0.06 (0.09)
 Post -0.02 (0.03) -0.02 (0.08) 0.03 (0.09)

 N 115413 113038 109337
 Notes: White refers to non-Hispanic white workers. Coefficients show the average effect over respectively the
 pre- and post- period. Results are based on 143 events and include controls for education, age, marital status
 and gender shares as well as three indicator variables equal to one if in quarter t state i has experienced
 respectively a qualifying, small or federal minimum wage change in the past 4 years. Period: 1990-2019,
 data: CPS-MORG. Replication tag: #ptr_eventStudy. Standard errors in parentheses, clustered at the state
 level, * p < 0.1, ** p < 0.05, *** p < 0.01.
Table 11 shows results averaged over respectively the pre- and post-periods.28 Reassuringly, we
do not find any significant effects in the pre period, not do we find any negative employment
effects. In line with previous results, we do find that wages increase for all racial groups and that
they increase more for Hispanic (+0.15, se 0.07) and black workers (+0.15, se 0.08) than for white
workers (+0.11, se 0.05).29
Bunching estimator Finally, we adapt the bunching estimator described in Cengiz et al. (2019)
to illustrate differences in the pattern of earnings gains per race. Figure 6 shows the estimated
employment and wage bill effects by wage bins. The underlying data are the same CPS-MORG
dataset that we used in our previous analyses, but now binned into 25 cent groups, from $1.25 to
$30 and two endpoint bins: [0, 1.25[ and [30, +∞[.
We generate treatment dummies that turn to one if bin j is within k dollars of a new state
minimum wage. We follow the Cengiz et al. (2019) definition of suitable minimum wage events,
but restrict k to [-4, 4[ rather than [-5, 17[ to improve efficiency (see also Equation 1 in their
paper). We control for federal and small minimum wage effects and include bin-by-quarter and
bin-by-state fixed effects. We omit the pre-treatment year dummies; thus, all effects are measured
relative to the year before the event. For further details, see the notes to Figure 6 and Cengiz et
al. (2019).
We plot the coefficients averaged over the entire post period. These coefficients can be
interpreted as the percentage point difference (relative to the average over the control states) in
the change (relative to the previous year) of the employment-population ratio for each bin. The
red line shows the cumulative employment effects over the bins.
The green line shows the contribution of each relative wage bin to the total wage bill change,
normalized by population (see Appendix B and the notes to Figure 6 for more details). For white
workers we find similar results to Cengiz et al. 2019, with missing jobs concentrated in the dollar
bin just below the new minimum wage, and excess jobs in the dollar bin just above. The total
employment effect is indistinguishable from zero.

28 The post period includes the contemporaneous effect.
29 See Appendix Figure A4 for results per event time.

 21
Figure 6 Employment and wage effects by bin

Notes:
Specification
This figure shows estimated employment and wage bill effects by wage bins. The underlying data are the same CPS-MORG
dataset used in our other analyses, but now binned into 25cent groups, from $1.25 to $30 and two endpoint bins: [0, 1.25[
and [30, +∞[. We generate treatment dummies that turn to one if bin j is within k dollars of a new state minimum wage.
We follow the Cengiz et al. (2019) definition of suitable minimum wage events, but restrict k to [-4, 4[ rather than [-5, 17[
to improve efficiency (see also Equation 1 in their paper). We add dummies -5 and 5 to collect bins outside this range. We
include up to three year leads and four-year lags to capture dynamic effects (graph available on request, pre-treatment
trends are absent). We control for federal and small minimum wage effects as in Cengiz et al. (2019), with the distinction
that we include separate control dummies for the -5, [-4, 0[, [0, 4[ and 5 groups rather than just the middle bins. We follow
their specification by including bin-by-quarter and bin-by-state fixed effects as well as dummies for the number of
treatment events occurring over the [-3, 4] year window. We omit the pre-treatment year dummies, thus all effects are
measured relative to the year before the event. We plot the coefficients averaged over the entire post period, multiplied by
four (as the underlying bins are 1/4th of a dollar) but do not divide by pre-treatment employment-population ratios as they
do. As such, the coefficients are to be interpreted as the percentage point difference (relative to the average over the control
states) in the change (relative to the previous year) of the employment-population ratio for each bin. The red line shows
the cumulative employment effects over the bins, the green line the cumulative effect on the wage bill, where the wage bill
effect is defined as the wage at the midpoint of the bin times the employment-population ratio change (this line is not
included in Cengiz et al, 2019 and differs from their wage bill calculations; we exclude the endpoint bins from these
calculations).

Results
For white workers, we find very similar results as Cengiz et al. 2019, with missing jobs concentrated in the dollar bin just
below the new minimum wage and excess jobs in the dollar bin just above. The total employment effect is indistinguishable
from zero. For black workers, the missing jobs are spread over the two bins below the new minimum wage and the gains
are focused on the higher +$4 bin. As a result, the wage bill effect is much larger for black workers, in line with our findings
using other methods. The total employment effect remains zero. Note that if the minimum wage were wage neutral, we
would expect to find the same bin pattern for white and black workers. By contrast, we observe a concentration of excess
jobs in the high relative bin for black workers, consistent with the findings and mechanisms described in Section 3.2.

 22
You can also read