R 735 - Do house prices reflect climate change adaptation? Evidence from the city on the water - Banca d'Italia
←
→
Page content transcription
If your browser does not render page correctly, please read the page content below
Questioni di Economia e Finanza
                (Occasional Papers)

                Do house prices reflect climate change adaptation?
                Evidence from the city on the water

                by Matteo Benetton, Simone Emiliozzi, Elisa Guglielminetti,
                Michele Loberto and Alessandro Mistretta
November 2022

                                                                                       735
                                                                              Number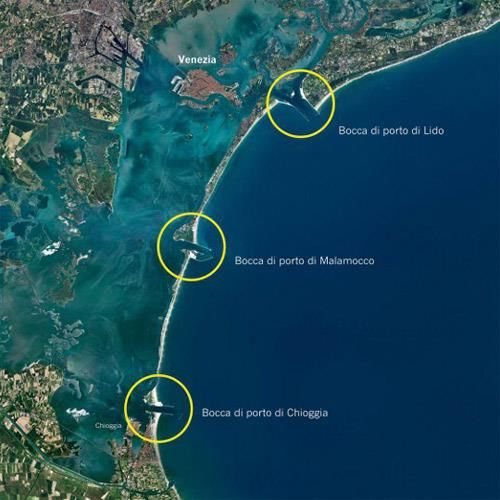
Questioni di Economia e Finanza
(Occasional Papers)

Do house prices reflect climate change adaptation?
Evidence from the city on the water

by Matteo Benetton, Simone Emiliozzi, Elisa Guglielminetti,
Michele Loberto and Alessandro Mistretta

Number 735 – November 2022
The series Occasional Papers presents studies and documents on issues pertaining to
the institutional tasks of the Bank of Italy and the Eurosystem. The Occasional Papers appear
alongside the Working Papers series which are specifically aimed at providing original contributions
to economic research.

                 The Occasional Papers include studies conducted within the Bank of Italy, sometimes
in cooperation with the Eurosystem or other institutions. The views expressed in the studies are those of
the authors and do not involve the responsibility of the institutions to which they belong.

                 The series is available online at www.bancaditalia.it .

ISSN 1972-6643 (online)

Designed by the Printing and Publishing Division of the Bank of Italy
DO HOUSE PRICES REFLECT CLIMATE CHANGE ADAPTATION?
                   EVIDENCE FROM THE CITY ON THE WATER

                      by Matteo Benetton*, Simone Emiliozzi†, Elisa Guglielminetti†,
                               Michele Loberto† and Alessandro Mistretta†

                                                                Abstract
       Investment in climate adaptation is a critical strategy to reduce the damages from
climate change, yet there is limited evidence of its effectiveness and costs. We study the
operation of a sea wall built to protect the city of Venice from increasingly high tides and
provide new evidence on the capitalization of infrastructure investment in climate change
adaptation into housing values. Exploiting the variations before and after the activation of the
sea wall and the varying exposures of different properties based on their features (e.g. ground
vs higher floors, stilts elevation), we find that the sea wall increased house prices by 3 per
cent for properties above the sea wall activation threshold and by an additional 7 per cent for
ground-floor properties. Overall, one year after its inception, the sea wall generated an
estimated 4.5 per cent increase in the value of the total residential housing stock in Venice,
which is a lower bound of the total welfare gains potentially generated by this infrastructure.

JEL Classification: Q54, R21, R38, O18, H54.
Keywords: housing, climate change, adaptation, infrastructure.
DOI: 10.32057/0.QEF.2022.0735

                                                                Contents

1. Introduction ........................................................................................................................... 5
2. Setting .................................................................................................................................. 10
   2.1 High Tides in Venice .................................................................................................... 10
   2.2 The Sea Wall ................................................................................................................ 12
3. Data and Descriptive Evidence............................................................................................ 14
   3.1 Sources and Summary Statistics ................................................................................... 14
   3.2 Descriptive Evidence .................................................................................................... 17
4. Empirical Analysis of the Effects of the Sea Wall .............................................................. 20
   4.1 The Effects of the Sea Wall on Ground-Floor Properties ............................................ 20
   4.2 The Effects of the Sea Wall on Low-Elevation Properties........................................... 26
   4.3 Interpretation of the Estimates...................................................................................... 31
5. Capitalization of the Sea Wall ............................................................................................. 33
   5.1 Approach and Results ................................................................................................... 33
   5.2 Discussion .................................................................................................................... 35
6. Conclusions ......................................................................................................................... 38
References ................................................................................................................................ 39
Appendix .................................................................................................................................. 43

_______________________________________
* Haas School of Business, University of California, Berkeley.
† Bank of Italy.
1 Introduction1
An estimated 10 million people around the globe experience coastal flooding each year and this
fraction could increase five-fold by 2080 as a result of climate change, with estimated damages
exceeding $1 trillion by 2050 (Adger et al., 2005; Hallegatte et al., 2013; Hinkel et al., 2014). An
important factor of uncertainty behind these estimates is the endogenous adaptation by agents
as well as countervailing policy by governments to reduce the damages from climate change.2
While a large literature has studied global mitigation via emission controls and carbon taxes, local
adaptation is becoming increasingly important and might play a major role going forward (Bouwer
et al., 2007; Hong et al., 2020; Fried, 2021). Empirically grounded estimates of the costs and
benefits of adaptation investment are therefore valuable for both researchers estimating climate
models and policy makers considering alternative strategies to confront climate change.3
This paper exploits the activation of a sea wall to protect the city of Venice to provide new
evidence on the capitalization of infrastructure investment reducing flood risk into housing values
and quantify the associated welfare gains. The sea wall activation was a milestone in a multi-
decades effort to make the city of Venice more resilient to increasing high tides and related flooding
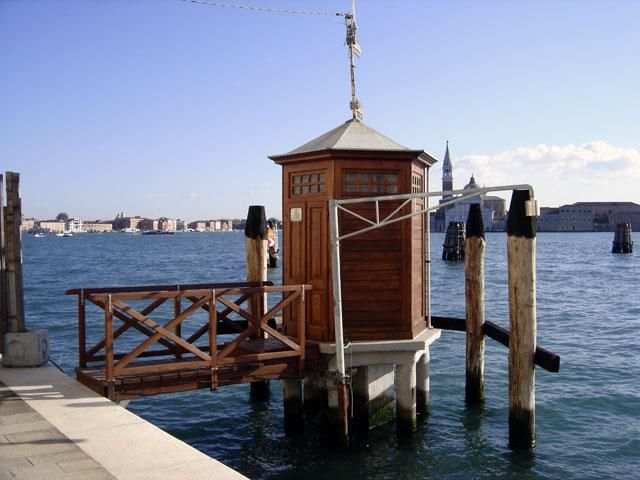
events.4 Built on stilts, Venice has been exposed to sea level changes since its foundation, with high
tides and flooding becoming worse in recent years.5 Recent climate change studies have warned
that Venice might be underwater by 2100 as a result of an expected increase of the Mediterranean
Sea by up to 110 cm (over three feet) (Lionello et al., 2021; Zanchettin et al., 2021).
1
We thank Laura Bartiloro, Aymeric Bellon, Andrea Beltratti, David Card, Federico Cingano, Guido De Blasio,
Ivan Faiella, Christian Ferrarin, Stephie Fried, Harrison Hong, Òscar Jordà, Ben Keys, Chloe Larkou, Enrico Moretti,
Stefano Neri, Monika Piazzesi, Paolo Pinotti, Tiziano Ropele, Alfonso Rosolia, Brigitte Roth Tran, Parinitha Sastry,
Stijn Van Nieuwerburgh, Reed Walker, Roberta Zizza and seminar participants at 1st workshop of the ESCB Research
Cluster on Climate Change, the Bank of Italy, Berkeley Haas, Bocconi University, the 2022 Site Conference on Climate
Finance, Innovation and Challenges for Policy, and the San Francisco Fed for helpful comments and suggestions. We
are extremely grateful to the municipality of Venice and to Immobiliare.it for providing the data and Andrea Luciani
for his assistance. The opinions expressed are those of the authors and do not necessarily reflect the views of the
Bank of Italy or of the Eurosystem.
2
For example, the World Bank (2011) estimates that the cost of adapting to an approximately 2 degrees warmer
world by 2050 is in the range of $70 to $100 billion a year. In the related literature we discuss recent papers showing
that not accounting for adaptation can have a large impact on the expected damages from climate change.
3
Recent proposals in the US include building an 8-mile seawall around Charleston with an estimated cost of
$2 billion, and a 1-mile wall for Miami-Dade with an estimated cost of $4.6 billion. The city of New York has
recently started building a system of walls and floodgates, which is expected to cost $1.45-billion and be completed
in 2026 (See: https://www.greenbiz.com/article/coastal-flooding-here-are-seawalls-answer-rising-tides
and https://phys.org/news/2021-12-vulnerable-climate-york-seawall.html).
4
The Major of Venice described the first activation of the sea wall as an “historic day for Venice” and for
residents the event felt “like the first step of Armstrong on the moon.” (Source: https://www.cnn.com/travel/
article/venice-flood-barrier/index.html).
5
In Section 2 we look at both high and low tides going back to 1870. Our detailed data on house listings cover
only recent years. However, one advantage of looking at the city of Venice is the availability of precise data on
high tides and flooding, which we believe is a strength of our analysis, given the usually short time series and large
uncertainty about inundation projections due to measurement error (Gesch, 2009; Keys and Mulder, 2020)
515
16
Sea wall first activated -->
Number of high tides & sea wall activation
14
Ads mentioning flood risk (%)
10
10 12
5
68
0
2016m1 2017m1 2018m1 2019m1 2020m1 2021m1 2022m1
High tides Sea wall activation Attention index
Figure 1: High tides, sea wall and attention to flood risk
Note: The green line shows the fraction of ads mentioning flood risk in their text. The red vertical bars
show the number of times the sea level in Venice was higher than 110 cm. The blue vertical bars show the
number of times the sea wall has been activated in the respective month.
Figure 1 shows an increasing number of high tides in Venice between 2016 and 2021, with
the month of November 2019 witnessing the highest number since accurate measurement of tides
started in 1870. Not surprisingly, the trend in high tides has been reflected in the fraction of house
listings mentioning high-tide and flood risk (attention index), which doubled from about 8% in
2018 to almost 16% by 2020. The sea wall activation in October 2020 represented a stark inversion
in the upward trend. This inversion in the attention index is consistent with a surprise effect from
the sea wall successful activation – which we further document in the paper – after many years
of delayed works and uncertainty on its ability to effectively protect the city. One year after the
first activation of the sea wall, the fraction of house listings mentioning high-tide and flood risk
has decreased from 16% to slightly above 10%. Since December 2020 the city of Venice has never
experienced a tide greater than 110 cm as a result of the protection offered by the sea wall.
We exploit the quasi-experimental temporal discontinuity in the exposure to sea floods from
the first activation of the sea wall to identify the causal effect on house prices, overcoming well-
known econometric issues affecting cross-sectional studies (Greenstone, 2017; Giglio et al., 2021).
Most notably, we implement a difference-in-differences (DD) hedonic design, using a rich high-
frequency dataset on house listings from the largest online portal for real estate services in Italy
(Immobiliare.it) and exploiting two sources of heterogeneity in properties’ exposure to flood risk
(and hence to the benefits of the sea wall). Our first identification strategy uses variation based
6on the floor of the property, as ground floors are likely to benefit more from the activation of the
sea wall relative to higher floors, all else equal. Our second strategy focuses on higher floors and
exploits variation in properties stilts elevation, as a measure of differential exposure to the sea wall.
First, we find that after the activation of the sea wall ground floor properties experience an
increase in price of about 4% relative to higher floor properties in the same neighbourhood. This
result is entirely driven by properties located in low-elevation areas (110-140 cm) and thus more ex-
posed to flooding, which appreciate by 7%. Second, we focus on higher-floors properties. Although
less likely to be directly flooded than ground-floor ones, higher-floor properties are indirectly af-
fected by flooding of common areas and the street to access the premises. After the activation of
the sea wall, we find that the price of low-elevation properties increases by almost 3% relative to
the price of high-elevation properties.
Additional analyses allow us to sharpen the interpretation and test the robustness of our results.
We rule out possible anticipation effects showing that sale prices of properties more or less exposed
to flooding exhibited parallel trends before the activation of the sea wall. Moreover, we estimate
a placebo specification assuming the sea wall was activated one year before the true date, as
an additional test to lower concern about anticipation effects and possible interaction with the
seasonality of the housing market. We also look as dependent variable at rental prices, which may
capture changes in the flow utility of properties as a result of the sea wall activation. We do not
find significant differential effects for rental prices following the sea wall activation, consistent with
sale prices reflecting the present discounted benefit from lower high-tide risk, rather than just a
temporary increase in the amenity value. Finally, we estimate a specification using property fixed
effects and exploiting variation in listing prices within ad. Despite the limited times list prices are
revised, we find that after the activation of the sea wall properties at lower elevation experience an
increase in prices by about 0.5%, relative to the average price per square meter posted before the
activation of the sea wall. Notice that our results are unlikely to be contaminated by endogenous
supply side responses, such as new construction, which are often a factor that may bias the causal
estimates from event studies on house prices, as housing supply in Venice is extremely inelastic
due to building constraints.
We propose a simple interpretation of the estimated effects of the sea wall on housing prices
through the lens of an asset pricing equation for housing (Poterba, 1984). The revaluation after the
activation of the sea wall can be traced back to (a combination of) three factors: (i) higher expected
future rents, (ii) lower expected future damages, and (iii) a reduction in the discount factor. While
a full decomposition requires stark assumptions, we find an important role for the expected damage
channel under fairly general conditions. Assuming that the reduction in the risk premium is the
same for ground and upper floor properties, we back out a reduction in average annual expected
damages of about e1100 for an average ground floor apartment of 95 square meters. While we
do not have data on maintenance costs to repair damages from floods, our estimate of expected
7maintenance expenses absent the sea wall is in line with additional data we collected on claimed
damages from households and businesses after the high flood occurred in November 2019.
In the last part of the paper we quantify the overall valuation gains from the sea wall and how
they are distributed across different property types and locations. We use census data and our
listing data to obtain the value of the overall residential area in the center of Venice, distinguishing
six categories based on three elevation levels (140 cm) and two floor
groups (ground floor vs higher floors). By combining our econometric estimates we obtain an
overall increase in residential properties values from the activation of the sea wall of almost e340
millions. A year after the activation the impact is e670 millions, that is 4.5% of the residential
housing stock of the city of Venice. Compared with the sea wall’s cost, the revaluation of residential
properties account for approximately 20% (10%) of the original (actual) costs.6
Our estimates provide a lower bound on the overall gain from the sea wall for at least two
reasons. First, our DD hedonic design exploits the activation of the sea wall as a permanent shock
to amenities (a reduction in flood risk) and identifies how this shock has been capitalized into
housing prices. Following Banzhaf (2021), we suggest that the DD hedonic estimates provide a
lower bound on the total welfare effects of the policy. Second, we only focus on the residential
properties, while the sea wall is likely to benefit commercial properties and related activities (e.g.,
tourism) as well. Under the assumption that ground floor commercial properties would appreciate
as residential properties after the activation of the sea wall, we estimate an increase in the value
of commercial properties used as shops and restaurants of about e165 millions after a year. Our
estimated magnitudes are specific to the context that we study, but the capitalization result could
be informative about the return on and financing of public investment in adaptation, which has
attracted increasing attention of both policy makers and economists around the world.
Related Literature. Our paper is related to the growing literature on mitigation and adaptation
policies in relation to climate change (Barreca et al., 2016; Hsiang, 2016; Partridge et al., 2017;
Hong et al., 2020; Dechezleprêtre et al., 2022; Carleton et al., 2022). A growing theoretical and
quantitative literature has shown how adaptation could have profound effects on the damages from
climate change. Desmet et al. (2021) studies in a general equilibrium framework the dynamic
response of investment and migration to sea level rise, showing that these endogenous responses
lower the losses in real GDP in 2200 from 4.5% to 0.11%. Fried (2021) studies adaptation and
aid for disaster relief in a macro heterogeneous-agent model and finds that adaptation reduces the
damage from climate change related storms by approximately one-third. Given the sensitivity of
models’ estimates to adaptation strategies, empirically grounded estimates of the impact of actual
6
The comparison with the sea wall’s cost is complicated by several additions to the original e3.3 billions budget (in
terms of today euros) due to delays and scandals, which led to cumulative expenses reaching e7 billions. Additionally,
the sea wall involves an estimated cost of e300 thousands for each activation (see: https://www.metropolitano.it/
mose-dietro-le-quinte-come-funziona/).
8adaptation to sea level rise on labor and capital could be valuable. Our work is closely related to
Kocornik-Mina et al. (2020), who find little permanent movement of economic activity in response
to floods, and Gandhi et al. (2022), who shows that cities protected by dams suffer more floods,
but the effect of each flood is mitigated substantially.
We complement these works based on a large cross-section of cities, by focusing only on one
city, but exploiting granular within-city variation to identify the effect of adaptation, overcoming
potential issues with local idiosyncratic shocks or heterogeneous trends across different cities. We
also study how house prices capitalize the benefit of lower exposure to sea level rise following the
activation of the sea wall. Thus our work is also related to the large literature that exploits house
prices to infer the local benefits from pollution abatement and air quality (Chay and Greenstone,
2005; Greenstone and Gallagher, 2008; Currie et al., 2015; Keiser and Shapiro, 2019), school quality
(Black, 1999; Cellini et al., 2010), and investment in transportation infrastructure (Gupta et al.,
2020; Tsivanidis, 2018; Severen, 2019). We apply quasi-experimental techniques to retrieve a
consistent estimation of the hedonic price schedule. We are the first to study the capitalization
into property prices of a large public investment in climate change adaptation to mitigate the
damages from flooding and sea level rise.
Finally, our paper also contributes to the growing empirical literature on the effect of climate
change and environmental risk on the housing market. A large literature studies the capitalization
of current flood risk in housing markets. A key identification challenge is that housing is a unique
combination of location and structure (Murfin and Spiegel, 2020; Giglio et al., 2021). Cross-
sectional analyses then struggle to identify causal effects, given the difficulties in controlling for
all price-relevant characteristics that might also be correlated with current or future flood risk.
Indeed, a survey of existing evidence by Beltrán et al. (2018) shows huge heterogeneity in price
effects. To address this identification issue, some papers have focused on the response of house
prices to flood events, such as the Hurricane Katrina in New Orleans or Hurricane Sandy in New
York, with mixed results (Vigdor, 2008; Ortega and Taspinar, 2018; Addoum et al., 2021). Other
recent works have instead combined granular cross-sectional variation in exposure with time-series
variation in attention and households belief about climate change, to study the capitalization of
future flood risk through sea level rise in housing values (Bernstein et al., 2019; Baldauf et al.,
2020; Keys and Mulder, 2020; Giglio et al., 2021; Bakkensen and Barrage, 2022).
We contribute to this growing literature in two ways. First, we combine cross-sectional variation
in properties exposed to high tides with time-series variation from an event study that only changes
flood risk. Second, all the aforementioned papers study increase in actual or expected risk of
flooding. Our work provides a new angle by looking into the effect on house values of a decrease
in flood risk, as a result of infrastructure investment to adapt to sea level rise.
Overview. The rest of the paper is organized as follows. Section 2 discusses the setting. Section
3 describes the data. Section 4 presents the empirical results using the variation from ground
9floor and stilts elevation, and discusses the interpretation. Section 5 shows the results from the
capitalization exercise. Section 6 concludes.
2 Setting
2.1 High Tides in Venice
The city of Venice has been exposed to sea level changes since its foundation. The city is built on
118 small islands that are separated by canals and linked by over 400 bridges. The city is often
threatened by high flood tides coming from the Adriatic Sea and these events have become more
frequent and extreme in recent years, as a result of both sea level rise and subsidence of the surface
of Venice (Lionello et al., 2021).
Figure 2 shows that the high-tides phenomenon occurs several times a year and has been part
of the city’s history for centuries. The blue bars show the number of high tides (defined as a tide
greater or equal to 110 cm or approximately 3.6 feet) since the end of the 19th century. Up until
the 1950s high tides in Venice happened on average every two years, while low tides were more
frequent, occurring three times per year. The situation has reversed since then. In the second half
of the 20th century, Venice has experienced on average three high-tide events per year, while low
tides have almost disappeared (only two low tides have been recorded in 1989). The first twenty
years of the 21st century have been even more dramatic, with an average number of high tides per
year fluctuating around nine.
Figure 2 shows the maximum level of high tides registered in each year since 1870. Not only
the number of high tides but also their level has increased over time. Tides higher than 150 cm
were unheard of before 1950. In the last 50 years of the 20th century, tides higher than 150 cm
occurred four times, while the first twenty years of the 21st century have already witnessed three
of them. Of the 17 years with tides higher than 140 cm, nine are in the 21st century (Ferrarin
et al., 2022).7
The high-tide phenomenon has material implications for Venice. In November 12th 2019 the
sea level reached almost 190 cm, which is the second highest level ever recorded in the history of
Venice, causing about 90% of the city center to be flooded.8 Panel (b) of Figure A1 in Appendix
A shows days properties were flooded based on elevation level in the twenty years from 1930 to
1950, as well as in the twenty years from 1999 to 2019. Between 1930 and 1950 properties with an
elevation below 110 cm were flooded no more than five times per year, properties with an elevation
7
Panel (a) of Figure A1 in Appendix A shows the maximum tide for each day in 1924 – the first year for which
we have daily data on tide level – and 2019 – the last year before the activation of the sea wall. In 95% of the days of
the year the maximum tide was higher in 2019 than in 1924, with an average difference of 33 cm or about one feet.
8
The highest level ever recorded was 194cm in 1966 (See: https://www.comune.venezia.it/it/content/le-acque-
alte-eccezionali).
10200
25
180
Max tide (if tide >=110 cm)
20
Number of tides
160
15
140
10
120
5
100
0
70
80
90
00
10
20
30
40
50
60
70
80
90
00
10
20
70
80
90
00
10
20
30
40
50
60
70
80
90
00
10
20
18
18
18
19
19
19
19
19
19
19
19
19
19
20
20
20
18
18
18
19
19
19
19
19
19
19
19
19
19
20
20
20
High tides (>=110 cm) Low tides = 110cm (%) Flooded with tide >= 150cm (%)
5.6 50.4
13.3 73.1
2.8 27.9
8.6 79.4
11.6 2.2 78.1 35.2
17.4 88.8
(11.6,17.4] 4.2 (78.1,88.8] 26.6
(7.1,11.6] 9.5 (60.5,78.1] 70.5
(2.8,7.1] (27.9,60.5]
[1.4,2.8] 1.4 [9.1,27.9] 9.1
Figure 2: High Tides and Flooding
Note: The top left figure shows the number of high and low tides since 1870. High tides are defined as
episodes in which the tide reaches levels greater or equal than 110 cm; low tides are defined as episodes in
which the tide is lower than -90 cm. The top right figure shows the maximum level of high tides registered
in each year since 1870 and a quadratic trend. The bottom figures shows the fraction of different areas of
Venice that are flooded for sea levels equal to 110 cm and equal to 150 cm.
between 110 and 140 cm – the majority of properties in Venice – were flooded once or twice every
year, while properties with an elevation above 140 cm were never flooded. In the more recent twenty
years between 1999 and 2019 flooding has increases across the distribution of elevation. Properties
with an elevation below 110 cm were flooded more than twenty times per year, properties with an
elevation between 110 and 140 cm were flooded a few times every year, an even properties with an
elevation above 140 cm have been flooded at least once per year. The year 2019 was particularly
difficult for Venice, with the tide going above the 110 cm threshold almost 30 times.
The bottom panel of Figure 2 shows the fraction of different areas of Venice that are flooded
for two different levels of high tides.9 When the sea level is at 110 cm, about 12% of Venice is
flooded, while tides reaching 150 cm cause 70% of the city to go underwater. The bottom panel of
Figure 2 also shows significant heterogeneity in flooding across areas within Venice. For example,
the San Marco area is about 17% flooded with a high tide of 110 cm and almost 90% with a high
tide of 150 cm. The area of Castello to the far right is barely affected by a high tide of 110 cm,
and is about 10% flooded when the sea level reaches 150 cm.
9
Figure ?? in the Appendix shows the name and areas of the different neighborhoods in Venice main island.
11High tides and associated floods impose a substantial burden on Venice, affecting everyday life
(e.g., schools opening), economic activity (e.g., tourism) and damaging the stock of capital and
housing. The burden of reparations falls on residents (and local government) as private insurer
refuse to write policies on homes that have an extremely high likelihood of claiming damages every
year. The increasing frequency and size of recent high tides is going to make these costs higher
for residents and local governments, in line with the recent trend observed for other environmental
risk in other parts of the world.10
2.2 The Sea Wall
Since the extreme high tides of 1966, the city of Venice has invested in adaptation strategies to cope
with increasing frequency and level of high tides. The major step in this direction has been the
construction of a sea wall called MOSE (Modulo Sperimentale Elettromeccanico - Experimental
Electromechanical Module) to protect Venice from flooding.
Discussions about a sea wall date back to the Eighties, but a public announcement was made
only in 1992 and construction work began in 2003, with an estimated completion date of 2011. The
project experienced delays and a huge political scandal in 2014 which pushed the completion date
beyond 2021 and costs up to e7 billion, plus an estimated e100 million of annual maintenance
and operating costs. Up to now, in November 2022, this infrastructure is not completed and
the deadline has been moved to 2023. Despite the long history of the project, its first successful
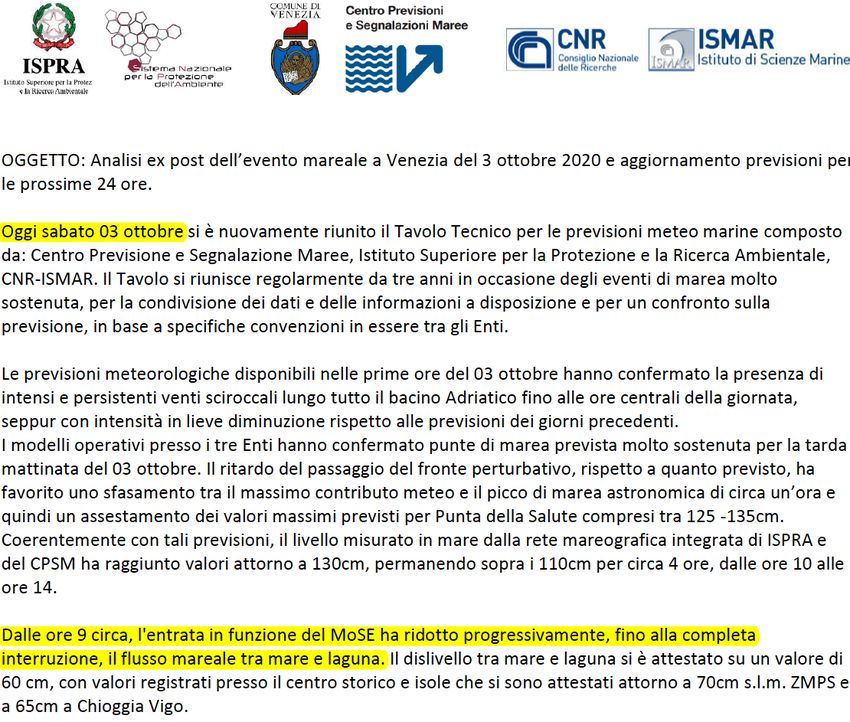
activation on October 3rd, 2020 has been an unexpected surprise for the city and its inhabitants.
Figure A2 shows the briefing from the official municipality of Venice website about the tide level
on the day before and the day of the first activation of the sea wall. On October 2nd, the expected
tide for the following day was 135-140 cm and there was no mention of the sea wall at all. On
October 3rd the briefing mentioned the successful activation of the sea wall, which created a gap
in the tide level between the open sea and the lagoon.11
The sea wall is a system of four mobile barriers composed of 78 gates located in three inlets
into the Venice lagoon.12 This infrastructure is different from a classic Dutch sea wall. The latter
could have done permanent damage to the lagoon ecosystem and impaired the activity of the port
of Venice. In normal times, the barriers of the Venice sea wall are not visible because they are
placed on the seafloor. When high tides are expected, the gates are temporarely raised and block
the tide. This very innovative approach, combined with delays in construction, created additional
10
For example, Issler et al. (2020) show that while insurance companies have been able to absorb fire losses in
California, the increasing frequency and size of recent events cast doubt on their ability to continue to provide such
protection.
11
In our empirical strategy we will exploit the high frequency nature of listing data to test for pre-trends and
anticipation effects.
12
The left panel of Figure A3 in the Appendix shows the location of the barriers at the three inlets relative to the
city of Venice.
12150
28
5
Sea wall active -->
24
Venice Center - Offshore Platform
130
Number of tides >=110cm
0
20
Max tide level (cm)
110
16
-5
90
8 12
-10
70
4
50
-15
0
01dec2020
02dec2020
03dec2020
04dec2020
05dec2020
06dec2020
07dec2020
08dec2020
09dec2020
10dec2020
11dec2020
12dec2020
13dec2020
14dec2020
15dec2020
16dec2020
17dec2020
18dec2020
19dec2020
20dec2020
21dec2020
22dec2020
23dec2020
24dec2020
25dec2020
26dec2020
27dec2020
28dec2020
29dec2020
30dec2020
31dec2020
83
85
87
89
91
93
95
97
99
01
03
05
07
09
11
13
15
17
19
21
20
19
19
19
19
19
19
19
19
19
20
20
20
20
20
20
20
20
20
20
Venice Center Offshore Platform Gap Venice Center Max (Offshore,Inlets)
(a) Venice center VS Offshore Platform (b) Tides in December 2020
Figure 3: Sea Wall
Note: The left figure shows the number of high tides (>=110 cm) registered in the city of Venice and the
offshore platform and the gap between the two. The right figure shows the highest tide for each day for
the month of December 2020. We show the highest tide recorded in the city of Venice and the highest tide
among the offshore platform and the three inlets. The grey vertical bar denote the dates when the sea wall
is activated. The red horizontal lines denote the activation thresholds at 130 cm and 110 cm.
uncertainty about the effectiveness of the infrastructure until it was firstly activated.
The sea wall has been activated 33 times since October 2020 until the end of 2021, preventing
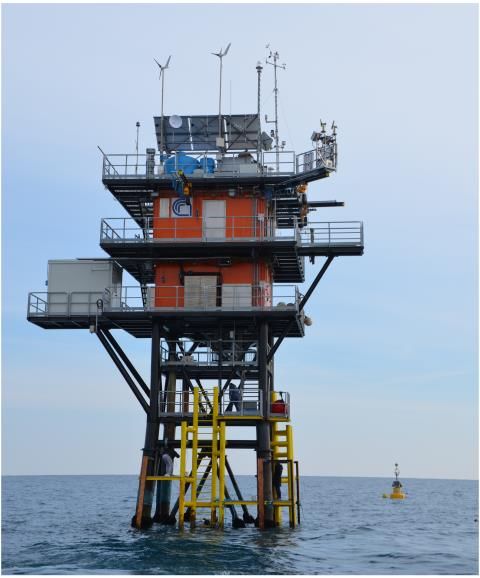
high tides from flooding the city of Venice. Panel (a) of Figure 3 shows the number of high tides
measured in the city center of Venice and in an offshore platform.13 From 1983 until 2019 the
number of high tides registered in the city of Venice and the offshore platform closely track each
other. Some differences can be due to changing meteorological conditions (e.g., winds) which can
affect the tides between the two locations. Hence the gap in high tides between the city of Venice
and the offshore platform is close to zero in most years up until 2020 when the sea wall was first
activated. In 2020, the offshore platform recorded 16 high tides events, while in Venice only 2 high
tides were recorded. Similarly, in 2021 ten high tides events were measured in the offshore platform
and none of them affected the city of Venice.
The decision to raise the barriers is taken when the sea level in Venice is expected to exceed a
given threshold, established at 110 cm for a fully operational sea wall. The predictions are based
on the sea level measured on the offshore platform and the three inlets, as well on other factors
such as wind and rain. Though still in an experimental phase – where the activation threshold
could have been higher, at 130 cm – the de facto threshold has always been 110 cm. Detailed data
on sea levels measured at different points indeed reveal that since the end of 2020 the barriers
have been raised when the measured tide in the open sea was often below or very close to 110 cm.
13
The platform was installed in 1970 following the high tide of 1966 and since 1983 it is used to measure the tide
levels (see: https://www.comune.venezia.it/it/content/3-piattaforma-ismar-cnr).
13Our empirical strategy will thus exploit that the sea wall sharply reduced the risk of flooding for
properties with an elevation above 110 cm.
To illustrate the activation process, panel (b) of Figure 3 shows the highest tide for each day
for the month of December 2020. We show the highest tide recorded in the city of Venice and the
highest tide among the offshore platform and the three inlets.14 The first two days of December
2020 provide an example of the activation process. On December 1st 2020, the measured tide in
the open sea was 98cm, the sea wall was not activated and the recorded tide in the city of Venice
was slightly lower at 92cm. On December 2nd 2020, the measured tide in the open sea was 132cm,
the sea wall was activated protecting the city of Venice, which experienced a tide of less than 80
cm.
Panel (b) of Figure 3 provides two additional insights into the functioning of the sea wall.
First, on December 8th the sea wall was not activated, as the predicted tide was below the 130 cm
experimental threshold. The measured tide in the open sea reached almost 150 cm, and without
the sea wall the center of Venice was flooded with a recorded high tide of 138cm. The failure to
raise the barrier on December 8th reflects the uncertainty around the estimates on tide levels which
depend on the measured sea level, as well as on wind, rain and river water.
Second, and perhaps related to the failed activation of December 8th, the sea wall was activated
toward the end of 2020 for lower levels of the tide measured in the open sea. For example, on
December 29th and 31st the tide measured in the open sea was below 110 cm but the sea wall was
activated, protecting the city of Venice, which experienced tides around 80 cm. Figure A4 in the
Appendix shows the measured tide offshore and in the center of Venice for all dates in which the
sea wall was activated in 2020-2021. In the more recent period, the sea wall was activated even
when the measured tide in the open sea was well below the 130 cm threshold and not more than
20 cm below the 110 cm threshold. This behavior is consistent with a more conservative approach.
Since December 8th 2020 the city of Venice has never experienced a tide greater than 110 cm.
3 Data and Descriptive Evidence
3.1 Sources and Summary Statistics
We combine several data sources for our analysis. Our primary data are from the largest online
portal for real estate services in Italy: https://www.immobiliare.it/. We have a weekly snap-
shots of all ads visible on the website every Monday for the municipality of Venice. From the
snapshot we observe detailed information about the physical characteristics, the location, and the
asking price of a dwelling. We also know the date when the seller created and removed the ad. In
14
In the right panel of Figure A3 we show the tide measured in the offshore platform and each of the inlets
separately.
14Appendix B we report the list of all the dwelling characteristics we observe and additional details
on the steps we take to construct our final dataset. An important caveat is that we do not observe
the final transaction prices for each sold dwelling. However, we collected additional information on
average transaction prices from the Italian tax office and we find a 0.99 correlation between asking
and transaction prices, consistent with previous evidence (Loberto et al., 2022).15
We combine our main dataset with two additional sources. First, we exploit the coordinate
of the dwelling to infer the elevation of the property. We obtain access to a database created
by the city of Venice in collaboration with a private company which contains a three-dimensional
representation of the historic city centre paving with centimeter accuracy.16 We then match this
highly-detailed information on altimetry of the paving to each property in our main dataset located
in the historical city center of Venice. Second, we obtain information on the frequency and level
of high tides as well as on the activation of the sea wall from the historical archive of the city of
Venice.17
The dataset is a panel of housing ads from 2016 to 2021. Table 1 shows the summary statistics
for the main variables in our database at the monthly level. The average residential property
price is e550 thousands, and there is a lot of heterogeneity across properties whose value range
from e20 thousands to e6.5 millions. The average price per square meter is almost e5,000, again
with wide range of variation from a minimum of about 570e/m2 to a maximum of 14,000e/m2.
The average floor area is approximately 100 square meter. About 9% of properties in our data
are ground floors. The vast majority (95%) are flat, and most properties are in good (33%) or
very good (48%) conditions. Only 3% are new properties and 13% needs renovation.18 The vast
majority of properties have no garage (99%) or garden (81%), while about 10% are in buildings
with an elevator.19
The average elevation of properties relative to the reference point is about 130 cm, with a wide
range of variation.20 The lowest elevation is just above 80 cm, while the highest is almost 290 cm.
Depending on historical observations of the sea levels and their elevation, properties have different
flood probabilities. The average daily flood probability for houses in our sample is about 0.5%.
However, some properties are never flooded while some properties have a daily flood probability
of more than 15%. Finally, we construct a measure of climate attention which is a dummy equal
15
Figure A7 in the Appendix shows that average transaction and listing prices for different areas are close to the
45 degree line.
16
Additional information and data are available here: http://smu.insula.it/index.php@option=com_content&
view=frontpage&Itemid=103&lang=en.html.
17
The data can be downloaded here: https://www.comune.venezia.it/it/content/
le-acque-alte-eccezionali.
18
Complete renovations are classified as new properties. The 3% of properties classified as new likely capture
complete renovations, rather than new construction on previously undeveloped land.
19
In the final sample used in the regressions, we remove listings with extreme values for price per square meter
(those below the 2.5 percentile or above the 97.5 percentile). More details are available in Appendix B.
20
Since 1897 the measurement of the sea level and paving elevation is relative to the zero tide of Punta della
Salute. Figure A5 in the Appendix shows the location of houses in our dataset in Venice main island.
15Table 1: Summary Statistics
Observations Mean Std. Dev. Minimum Median Maximum
Panel A: Property characteristics
Price (e.000) 50,839 551.03 401.59 20.00 440.00 6,500.00
Price (e/m2) 50,839 4,987.91 1,460.95 571.43 4,793.10 14,444.44
Floor area (m2) 50,839 110.79 65.98 30.00 95.00 570.00
Ground floor (dummy) 50,839 0.09 0.28 0.00 0.00 1.00
Single family (dummy) 50,839 0.05 0.22 0.00 0.00 1.00
Flat (dummy) 50,839 0.95 0.22 0.00 1.00 1.00
Need renovation (dummy) 50,839 0.13 0.33 0.00 0.00 1.00
Good status (dummy) 50,839 0.33 0.47 0.00 0.00 1.00
Very good status (dummy) 50,839 0.48 0.50 0.00 0.00 1.00
New property (dummy) 50,839 0.03 0.17 0.00 0.00 1.00
Elevator (dummy) 50,839 0.10 0.30 0.00 0.00 1.00
No garage (dummy) 50,839 0.99 0.08 0.00 1.00 1.00
Parking slot (dummy) 50,839 0.00 0.02 0.00 0.00 1.00
Private box (dummy) 50,839 0.01 0.07 0.00 0.00 1.00
No garden (dummy) 50,839 0.81 0.39 0.00 1.00 1.00
Shared garden (dummy) 50,839 0.08 0.27 0.00 0.00 1.00
Private garden (dummy) 50,839 0.11 0.31 0.00 0.00 1.00
Elevation (cm) 40,693 131.79 26.49 80.31 125.11 285.30
Flood probability (%) 40,693 0.46 0.89 0.00 0.19 10.18
Attention index (dummy) 50,839 0.11 0.31 0.00 0.00 1.00
Panel B: Tide and sea wall variables
Max tide Venice (cm) 72 99.12 19.07 72.00 94.00 187.00
High tides Venice (number) 72 0.57 1.87 0.00 0.00 13.00
Sea wall activation (number) 72 0.47 1.91 0.00 0.00 13.00
Note: The Table shows the main variable in our analysis. Price is the listing price of the property in thousand eand e/m2.
Elevation is the level of historic city centre paving of the street or square where the property is located. Flood probability is the
daily probability that the building is flooded based on the elevation and the daily level of tides since 1923. Climate attention is a
dummy equal to one if the property description mentions flooding, high tide or the sea wall. Max tide is the highest tide recorded
in Venice in each month. High tides is the number of high tides (≥ 110 cm) recorded in Venice in each month. Sea wall activation
is the number of times each month the sea wall has been operated.
to one if the property description mentions flooding, high tide or the sea wall.21 About 11% of
property listings in our dataset mention one of this flood-risk-related variables.
Panel B of Table 1 reports the main variables from the historical archive of the city of Venice.
The average maximum tide across months in Venice during our sample period was 100 cm, ranging
from a low of about 70 cm to a high of almost 190 cm. The average number of tides greater than
110 cm was about 0.6. Most months experience no high tides, but some months have more than
ten high tides. The sea level has a strong seasonal component and high tides tend to hit Venice
21
The italian words used to compute the attention index are: “marea”, “maree”, “MOSE”and “acqua alta”. The
majority of listings in our attention index have descriptions that emphasize the lack of flood risk, consistent with the
examples of property listings entering the climate attention index by Giglio et al. (2021). In the city of Venice, sellers
have a strong incentive to advertise when a property is not/less exposed to the seasonal high tides.
161 Percentage 12% 46% 70% 82%
flooded:
.8
Cumulative Probability
.6
Every 10 years and 10 months
Every 3 years and 10 months
Every 2 years and 3 months
.4
Every 10 months
Every 4 months
Every 18 years
Yearly average
frequency of high tide:
.2
0
50 70 90 110 130 150 170 190 210 230 250
Level relative to Punta Salute (cm)
Figure 4: Properties across elevation
Note: The figure shows the cumulative distribution of houses in our dataset based on their elevation relative
to the reference point of Punta della Salute. We also report the yearly average frequency of high tide based
on historical estimates from 1924 to today.
in the Winter season from October to March. We also report the average number of times the sea
wall has been activated. Most months the sea wall is not active because either the sea level is low
or the months are in the pre-activation period. Some months experience several activation of the
sea wall. For example in December 2020 the sea wall has been raised 13 times.
3.2 Descriptive Evidence
Do house prices in Venice reflect high tide risk? In this Section we investigate the relation between
flood risk and house prices using variation across properties based on their elevation and floor.
Figure 4 shows the cumulative distribution of houses in our dataset based on their elevation relative
to the reference point. We also report the yearly average frequency of high tide based on historical
estimates from 1924 to today. Slightly less than 20% of properties have an elevation below 110
cm, which leads to frequent flooding each year. A large number of properties, about 40%, have an
elevation between 110 cm and 130 cm, which is associated to one to three floods each year. About
20% of houses have an elevation between 130 cm and 150 cm and they are inundated every two to
four years. Finally, the remaining 20% of properties are located at 150 cm or above the reference
level and experience flooding only every 10 years or more.
We study the relationship between elevation and house prices per square meter controlling for
other determinants of house prices with the following empirical specification:
17yilkt = αExposurei + θXi + γlk + γt + ϵilkt , (1)
where yilkt is the house price per square meter for house i in location l of type k in period t;
Exposurei is a measure of house i exposure to high-tide risk; Xi are other house characteristics;
γlk is an interacted location-type fixed effect; γt is a time fixed effect; and ϵilkt is an error term
capturing unobservable determinants of house prices.22 We define property type as the interaction
of a house type (single-family or multi-family) and maintenance status (to be renovated, good
conditions, very good conditions, new-built). As additional house characteristics we include floor
surface, number of bathrooms, a dummy for garage and garden type, a dummy for the presence of
an elevator, and several measures of distance of the property from tourist attractions (San Marco
Cathedral, Rialto Bridge, Canal Grande), bridges and public boats stations. Our measures of
exposure are: (i) the daily probability that the building is flooded based on its elevation and the
historical measurements of daily sea level; (ii) a dummy for the property being on the ground floor;
and (iii) the interaction of the previous two measures.
Table 2 shows the the estimates from equation (1) in the year before the activation of the sea
wall. Given the limited time-variation, these estimates may be affected from the well-known mis-
specification issues in cross-sectional studies and we do not argue they have a causal interpretation.
Yet, they can provide a useful guidance on the extent flood risk affected house prices before the
activation of the sea wall.
In column (1) we look at the effect of a higher probability of flooding on house prices per
square meter. A higher flood probability is associated to lower house prices. Most notably, a one-
percentage-point higher probability of flooding is associated to 135e/m2 lower house prices. In
column (4) we estimate the same specification, but using the logarithm of house prices per square
meter. We find that a one-percentage-point higher probability of flooding is associated to a 3%
lower house price.
Column (2) and (5) report the estimates of equation (1) using a dummy for ground floor as a
measure of differential exposure to flooding. Properties on the ground floor suffer more directed
damages as a result of high tides. We indeed find that that properties on the ground floor have
significantly lower asking prices. Most notably, ground floor properties sell at about 300e/m2 less
or a 7% discount relative to otherwise similar properties. While we control for several characteristics
of house prices, the reason why ground floor properties sell at a discount relative to higher floor
ones may be not necessarily related to flood risk. For example, ground floor properties may have
a worse exposure to sunlight, which lowers their values relative to otherwise similar higher floor
22
Location in our setting is a neighborhood, which is based on the urban partition developed by the Italian tax
office. The population in a neighborhood in the city of Venice is between about 1,800 and 9,000 people. Thus, a
neighborhood in our setting is comparable to a census tract in the US, which generally has 2,500 to 8,000 residents.
We discuss the characteristics of neighborhood in details in Appendix B.
18Table 2: Effect of flood risk on property values
Price (level) Price (log)
(1) (2) (3) (4) (5) (6)
∗∗∗ ∗ ∗∗∗
Flood probability -134.33 -87.22 -0.03 -0.02∗∗
(39.93) (44.48) (0.01) (0.01)
Ground floor -303.75∗ -261.43∗∗ -0.07∗∗ -0.05∗∗
(146.71) (111.54) (0.03) (0.02)
Flood probability × Ground floor -301.88 -0.06∗
(173.41) (0.03)
FE location-type Yes Yes Yes Yes Yes Yes
FE year-month Yes Yes Yes Yes Yes Yes
Controls Yes Yes Yes Yes Yes Yes
Mean Y 4999.49 5006.58 4999.49 8.49 8.49 8.49
SD Y 1200.56 1192.09 1200.56 0.24 0.23 0.24
R2 0.38 0.38 0.40 0.40 0.39 0.41
Obs. 6996 7596 6996 6996 7596 6996
Note: The Table shows the estimates from equation (1) in the year before the activation of the sea wall. In columns (1) to (3) the
dependent variable is the asking price in euro per square meter; in columns (4) to (6) the dependent variable is the log of the asking
price in euro per square meter. Flood probability is the daily probability that the building is flooded based on the elevation and the
daily level of tides since 1923. Ground floor is a dummy equal to one for properties located on the ground floor. Location-type fixed
effects are interacted fixed effect for location and property type. Controls include floor surface, number of bathrooms, a dummy for
garage and garden type, a dummy for the presence of an elevator, and several measures of distance of the property from tourist
attractions (San Marco Cathedral, Rialto Bridge, Canal Grande), bridges and public boats stations. Standard errors are double
clustered at at the location-type and year-month level. ∗ , ∗∗ , and ∗∗∗ denote significance at the 10%, 5% and 1% levels, respectively.
properties.
In column (3) and (6) of Table 2 we report the estimates interacting the probability of flooding
with a dummy for ground floor properties. Both a higher flood probability and being on the ground
floor are associated to lower prices per square meter. As expected, ground floor properties in areas
with a higher flood risk are listed at a relative higher discount that ground floor properties in areas
with lower flood risk. Most notably, moving from the 25th to the 75th percentile of the flood risk
distribution is associated to an increase in the ground floor discount by about 3.5%.23 Overall,
given the limitation of cross-sectional analyses discussed in the related literature, we interpret the
results in Table 2 as descriptive and exploit joint variation across properties and over time for
identification in our empirical strategy.
Finally, Table A1 in the Appendix reports the estimates of equation (1) in the year before the
activation of the sea wall for rent prices. The correlation between a higher probability of flooding
and rent prices per square meter is negative but non statistically significant, and the estimates are
small in magnitudes. The ground floor discount for rent prices is only marginally significant and
also small in magnitudes. Additionally ground floor properties in areas with a higher flood risk are
23
The average discount for ground floor properties with a flood probability at the 25th percentile is about 5.5%
relative to otherwise similar properties. Ground floor properties with a flood probability at the 75th percentile are
listed for about 9% less than otherwise similar properties.
19not associated to significantly lower rents than ground floor properties in areas with lower flood
risk. While rental properties exposed to floods are less attractive, leading to a negative relation
between exposure and prices, counterbalances forces might weaken this relation. For example,
individuals interested in ground floor properties might prefer renting rather than buying it, if they
are worried about flood risk, driving up rents in equilibrium. Another related possible explanation
for the weaker and insignificant relation between exposure to flooding and rent prices – as compared
to list prices – is that the burden of the damage for flooding falls on landlords, who pass some of
it to renters in the form of higher rents.
4 Empirical Analysis of the Effects of the Sea Wall
4.1 The Effects of the Sea Wall on Ground-Floor Properties
Our first identification strategy exploits the activation of the sea wall and its differential effect on
ground-floor properties. Figure 5 shows the average price per square meter in a two year window
around the first activation of the sea wall for ground floor and higher floor properties. The price
is normalized to 100 in October 2020, which is the month when the sea wall was first activated.
The prices of higher floor properties experienced an increase toward the end of 2019, started to
decrease in January 2020 and have been on a declining trend since then. This pattern is consistent
with the aggregate trends in several Italian cities following the Covid-19 pandemic. The prices of
ground floor properties tend to be more volatile, but the overall trend is similar to that of other
properties until about the end of 2020 (in what follows we will test the parallel trend assumption
more formally). From the beginning of 2021, after the sea wall successfully operated several times,
ground floor properties have experienced an increase in values relative to October 2020, in sharp
contrast to the declining trend observed for other properties.
To isolate the differential effect of the sea wall on ground-floor properties, we estimate the
following difference-in-difference specification:
yilkt = αGround Floori + βGround Floori × Sea Wallt + θXi + γlk + γt + ϵilkt , (2)
where Ground Floori is a dummy equal to one if property i is on the ground floor; Sea Wallt is a
dummy equal to one in all months after October 2020, when the sea wall was first activated; and
other control variables and fixed effects are as in equation (1). The main coefficient of interest is
β which captures the differential effect of the sea wall on ground floor properties.
We show in Section 3 that the discount for ground floor properties is higher in areas more
exposed to flood risk. For the same reason, we might expect higher house price gains from the sea
wall for ground floor properties in locations more exposed to flood risk. Figure A6 in the Appendix
2015
110
Sea wall first activated -->
Price/m2 (October 2020=100)
Number of sea wall activation
10
100 105
5
95
0
2019m10 2020m4 2020m10 2021m4 2021m10
Ground floor Floor >=1 Sea wall active
Figure 5: Prices per m2 : Ground vs higher floors
Note: The figure shows the average price per square meter in a two-year window around October 2020,
which is the month when the sea wall was first activated. The figure shows the average prices for ground
floor and higher floor properties. The price is normalized to 100 in October 2020. The blue vertical bars
show the number of times the sea wall has been activated in the respective month.
shows the average price per square meter in a two-year window around the first activation of the
sea wall for ground floor and higher floor properties, similarly to Figure 5, but splitting the sample
by the elevation of the property. We find that the differential increase after the first activation
of the sea wall in ground floor property prices is driven by properties at lower elevation levels, as
expected. To allow for heterogeneity across locations we estimate equation (2) both in the full
sample and separately for properties with different elevation levels.24
In the estimation of equation (2) – and equation (4) in the next section, which exploit variation
across elevation levels – we focus on properties with an elevation above 110 cm, which is the level
of predicted tide when the sea barriers are activated, as we discussed in Section 2. Properties with
lower elevation will also potentially benefit from the activation of the sea wall. On the one hand,
properties with elevation level below 110 cm still experience flooding from high tides, that do not
trigger the sea wall activation. On the other hand, these properties benefit from the sea wall, as
they are protected from potentially even more damaging floods from high tides that lead to the
sea wall activation. Hence, our estimates could be interpreted as a lower bound on the effect of
the sea wall on property values.25
24
We consider properties below relative to above and elevation of 140 cm, which is approximately the median
across properties in the full estimation sample.
25
We discuss these issues further when we perform the capitalization exercise in Section 5.
21You can also read


