Quantification metrics for telangiectasia using optical coherence tomography - Nature
←
→
Page content transcription
If your browser does not render page correctly, please read the page content below
www.nature.com/scientificreports
OPEN Quantification metrics
for telangiectasia using optical
coherence tomography
Jillian L. Cardinell1*, Joel M. Ramjist1, Chaoliang Chen1,2, Weisong Shi1,2, Nhu Q. Nguyen1,
Tiffany Yeretsian3, Matthew Choi3, David Chen3, Dewi S. Clark4, Anne Curtis5, Helen Kim6,
Marie E. Faughnan7, Victor X. D. Yang1,2,8 & the Brain Vascular Malformation Consortium HHT
Investigator Group*
Hereditary hemorrhagic telangiectasia (HHT) is an autosomal dominant disorder that causes
vascular malformations throughout the body. The most prevalent and accessible of these lesions are
found throughout the skin and mucosa, and often rupture causing bleeding and anemia. A recent
increase in potential HHT treatments have created a demand for quantitative metrics that can
objectively measure the efficacy of new and developing treatments. We employ optical coherence
tomography (OCT)—a high resolution, non-invasive imaging modality in a novel pipeline to image
and quantitatively characterize dermal HHT lesion behavior over time or throughout the course of
treatment. This study is aimed at detecting detailed morphological changes of dermal HHT lesions
to understand the underlying dynamic processes of the disease. We present refined metrics tailored
for HHT, developed from a pilot study using 3 HHT patients and 6 lesions over the course of multiple
imaging dates, totalling to 26 lesion images. Preliminary results from these lesions are presented
in this paper alongside representative OCT images. This study provides a new objective method
to analyse and understand HHT lesions using a minimally invasive, accessible, cost-effective, and
efficient imaging modality with quantitative metrics describing morphology and blood flow.
Hereditary Hemorrhagic Telangiectasia (HHT) is an autosomal dominant genetic disorder characterized by the
presence of vascular malformations (VMs), with an estimated prevalence of 1 in 50001–3. Smaller malformations,
telangiectases, typically occur in the nasal, oral, and gastrointestinal mucosa, or on the skin, and result in acute
or chronic bleeding and anemia. Larger lesions, arteriovenous malformations (AVMs), typically occur in the
brain and lungs, with diffuse and confluent telangiectases typically affecting the l iver4,5. More than 90% of adults
with Hereditary Hemorrhagic Telangiectasia (HHT) develop chronic epistaxis, leading to significant morbidity,
including anemia, emergency room visits, and impaired quality of life6–10. A recent explosion of potential new
therapies for HHT, with most being antiangiogenic therapies, have the potential to rescue malformations and
cure disease. Thus, there is a pressing need to develop outcome measures for trials in HHT that can relate lesional
response to therapy. Our aim is to develop microimaging techniques for telangiectases in HHT as these lesions
are frequent and accessible on the skin and mucosa, and should provide a window into response to new therapies.
Telangiectases in HHT are characterized by the loss of capillary bed between arterioles and venules, with
dilated post-capillary v enules11,12. This disordered interchange between arteriole and venules generates high
perfusion pressure that can lead to chronic hemorrhage. Current knowledge of VM structure and morphology in
HHT is based primarily on imaging of visceral AVMs with computed tomography, magnetic resonance imaging,
and Doppler ultrasound4,5. There are only limited imaging studies of telangiectasia lesions, with one case study
doing only visual analysis on dermal lesions and another study only performing ex vivo analysis, which lacks
1
Deparment of Electrical, Computer, and Biomedical Engineering, Ryerson University, Toronto, ON,
Canada. 2Department of Optical Engineering, Nanjing University of Science and Technology, Nanjing, Jiangsu,
China. 3Physical Sciences Platform, Hurvitz Brain Sciences Research Program, Sunnybrook Research Institute,
Toronto, ON, Canada. 4Toronto HHT Centre, Division of Respirology, Department of Medicine, St. Michael’s
Hospital, University of Toronto, Toronto, ON, Canada. 5Division of Dermatology, University of Toronto, Toronto,
ON, Canada. 6Department of Neurological Surgery, University of California, San Francisco, San Francisco, CA,
USA. 7Li Ka Shing Knowledge Institute, St. Michael’s Hospital, Toronto, ON, Canada. 8Department of Surgery,
Division of Neurosurgery, Sunnybrook Health Sciences Centre, University of Toronto, Toronto, ON, Canada. *A list
of authors and their affiliations appears at the end of the paper. *email: jillian.cardinell@ryerson.ca
Scientific Reports | (2022) 12:1805 | https://doi.org/10.1038/s41598-022-05272-1 1
Vol.:(0123456789)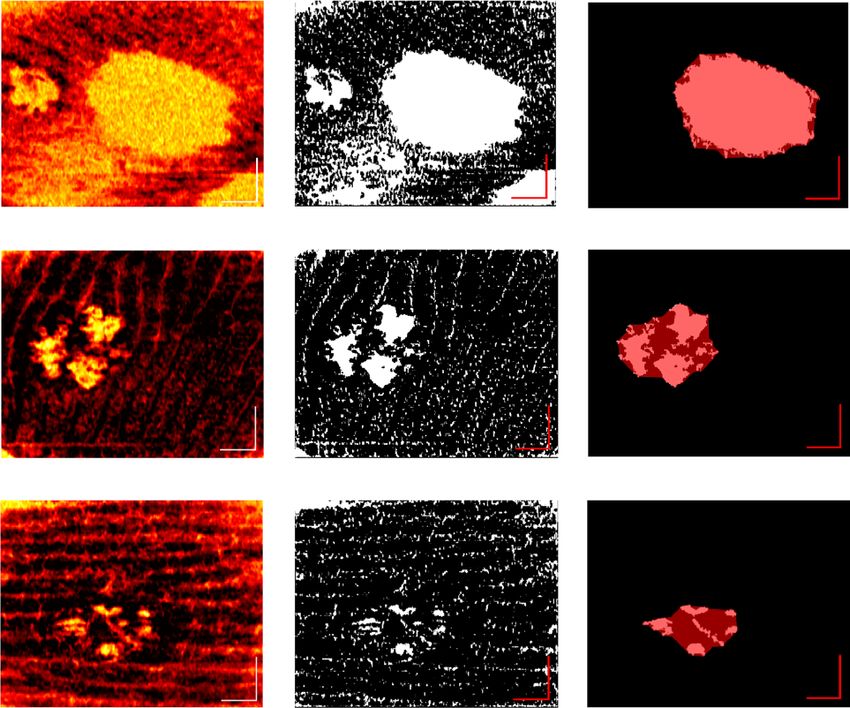
www.nature.com/scientificreports/
information about live morphology and r esponsiveness12,13. Few studies are focused on analysing therapeutic live
responses of lesions, though our group has previously reported a detailed study of optical coherence tomography
(OCT) applied to an HHT p atient14. OCT is a non-invasive light interferometry imaging modality that can obtain
high-resolution (< 10 µm), non-contrast, sub-surface (up to > 2 mm) images, and can provide the possibility of
repetitive imaging studies to assess lesional treatment response in HHT t rials15,16.
OCT Angiography (OCT-A) can delineate microvasculature by detecting blood flow through Doppler OCT
(D-OCT) or Speckle Variance OCT (SV-OCT) methods17,18. SV-OCT is more resilient to different flow condi-
tions making it a preferred to D-OCT14,17,18. SV-OCT methods are used by the VivoSight OCT System (Michel-
son Diagnostics Ltd., UK)—a Health Canada and FDA approved dermal OCT/OCT-A system16. Cheng et al.
from our group had demonstrated the potential for OCT as an HHT imaging method by applying OCT flow
mapping to HHT cutaneous lesions in vivo14. Their method was applied to the raw VivoSight data and their
vascular images showed great potential, but were computationally expensive and noisy, and only were applied
to one p atient14. Shi et al. have since improved SV-OCT by enhancing delineation of dermal microvasculature,
and increasing signal-to-noise ratio and spatial resolution with their differential standard deviation of log-scale
intensity (DSDLI) a lgorithm19.
Other studies have seen success in using OCT-A to analyse dermal vascular pathologies, and have imple-
mented quantitative metrics. Baran et al. used vascular OCT images to calculate area-based vessel density to
use as a biomarker for acne lesion h ealing20. A detailed quantitative analysis of mouse ear vasculature was
performed by Reif et al. using vessel density, box-counting fractal dimension, and vessel length fraction. Vessel
length fraction modified vessel density using a skeletonized vessel image. Fractal dimension was also calculated
on the skeletonized image21. Fractal dimension describes self-similarity and has been proven useful in studying
pathological biological s tructures22.
A study using OCT methods on mouse cerebral vasculature used a more local analysis on skeletonized images
to obtain a density measure to characterize a ngiogenesis23. Vakoc et al. used optical frequency domain imaging
to image tumors in vivo on mice subjects and measured intratumor vessel length, tortuosity, volumetric fractal
dimension, and mean vessel diameter to successfully track tumor progression through t herapy24. A histological
cancerous tumor study used numerical vessel density and vessel surface proportion within tumor hotspots as
metrics25. Demidov et al. created radiation injuries in mice and imaged the area using SV-OCT. They were able
to find significant differences between irradiated tissue and healthy tissue using vessel diameter measured from
the SV-OCT images, which conform to the findings from histology-based m ethods27. These metrics have proven
important in tracking angiogenesis and tumor progression, and can be applied to HHT lesions throughout a
course of treatment; however, there is still a need to develop metrics tailored to progression monitoring of the
unique morphology of telangiectases.
In this paper, we propose a pipeline for the processing and semi-automated structural feature quantification
of telangiectases scanned using the VivoSight s ystem16. Images were acquired during a pilot study for a topical
beta-blocker treatment. This pilot allowed for the development and refinement of a set of quantitative metrics
capable of analyzing lesion behaviour and response to therapies. These metrics were based off lesions with varying
morphologies, and are capable of giving insight into progression and changes in the angiogenic process. Further,
they can enable the development of personalized and responsively dynamic therapeutic plans to improve long
term efficacy of treatments.
Methods
Patient selection. Three patients with definite clinical diagnosis of HHT were recruited, with at least 5 skin
telangiectases available for imaging, for the Topical Antiangiogenic Pilot in HHT Trial (NCT01752049) from the
Toronto HHT Centre—an HHT Centre of Excellence at St. Michael’s Hospital, University of Toronto. The study
protocol was approved by the Unity Health Research Ethics Board of St. Michael’s Hospital. All patients provided
written, informed consent to participate, and provided consent to publish results. All methods were performed
in accordance with the relevant guidelines for human topical drug trials and imaging studies, as approved by the
St. Michael’s Hospital.
Image acquisition protocol. The location of the lesion was photographed and labelled with a lesion
number. The lesions were scanned during imaging appointments using the dynamic acquisition mode on the
VivoSight, with appointments scheduled approximately once per month. Each patient attended 4–5 imaging
sessions after a topical antibiotic treatment had begun.
Once scanned on the VivoSight, raw data was extracted and used to construct angiographic images. Two
enface vascular images (6 × 6 mm) were made using DSDLI (Fig. 1a). Superficial images were made from slices
at approximately 330–510 µm below the skin surface, and deep images were made from slices 510–690 µm below
the surface as shown in Fig. 1f. These images were displayed with a custom colourmap in order to maximize the
contrast between vessel and tissue without losing vascular information. Structural enface images were also made
at these depths. Four cross-sectional structural slice images showing the skin stratum at the lesion were generated
from standard OCT extraction algorithms from each channel of the Vivosight (Fig. 1e).
Four lesions were included in the analysis for the first patient, 3 from the second patient, and 2 from the third.
Lesions were excluded if there were less than 2 valid scans from separate imaging sessions. Valid scans required
that both deep and superficial images could be acquired without major artefacts. A total of 28 valid lesion scans
were collected across the 9 lesions.
Image filtering. The vascular enface images from DSDLI (Fig. 1a), herein referred to as the original image,
were filtered using compounded filtering techniques. First, the original image was passed through a 2D median
Scientific Reports | (2022) 12:1805 | https://doi.org/10.1038/s41598-022-05272-1 2
Vol:.(1234567890)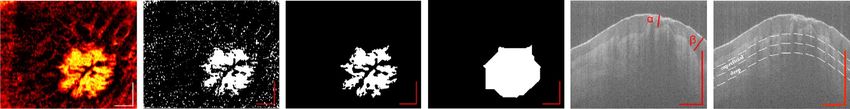
www.nature.com/scientificreports/
a b c d e f
Figure 1. Image analysis pipeline for lesion quantification. (a) Enface image generated by DSDLI, (b) filtered
and binarized image, (c) isolated lesion vasculature, (d) dilated and closed image, (e) structural slice image, and
(f) shows the depths from where the deep and superficial images are constructed from. The axis in each image
represents a 1 mm × 1 mm bar.
filter with a 3 × 3 neighborhood to smooth out salt and pepper noise. A gaussian filter was then applied to the
median-filtered image with a 3 × 3 kernel with a standard deviation of 3. This resultant image was then sub-
tracted from the original image to create a difference image to reduce structural artefacts such as fingerprints.
Another median filter with a large 8 × 8 neighborhood was applied to the original image and added to an ampli-
fied version of the difference image to restore and enhance the central region of the lesion that was reduced in the
gaussian filtering. An optimal threshold of 0.6 was selected for binarization to further eliminate noise but retain
vascular information (Fig. 1b). All processing was carried out in MATLAB.
Metric calculation. The binary vascular enface images (Fig. 1b) were used to calculate Vascular Fraction
(VF) which was defined as vascular pixels divided by total pixels in the image. This same binary image was also
used to calculate the box fractal dimension using Fractalyse software (Fractalyse v2.4, 2006). Vascular binarized
images were then area filtered to isolate lesion vasculature (Fig. 1c). The vertical and horizontal resolutions were
used to calculate the Vascular Area (VA) of the lesion in mm2. To achieve approximate lesion area (LA), the
isolated lesion vasculature was dilated and closed, and the area was calculated as previously described (Fig. 1d).
A secondary metric was calculated as VA/LA to classify lesions as dense or diffuse and was termed the Vascular
Area Lesional Value (VALVe). This process was done on both the superficial and the deep images.
The structural cross-sectional B-mode images were used to calculate epidermal fraction (EF). An observed
relative thickness measure of the epidermis was taken over the lesion (α) and over healthy tissue (β), and the EF
was calculated as α/β to classify lesions as deep or superficial (Fig. 1e). This unitless index allows for the relative
measurement of lesion depth that is unaffected by any refractive index differences of patient tissues. This measure-
ment was taken from each of the four channel cross-sectional images and the final EF was taken as the average.
Approval for human experiments. All methods were performed in accordance with the guidelines for
human topical drug trials and imaging studies, as approved by the St. Michael’s Hospital research ethics board,
the Unity Health Research Ethics Board.
Consent to participate. All sites received approval from their local institutional review boards and all
patients provided written informed consent for participation.
Consent for publication. All sites received approval from their local institutional review boards and all
patients provided written informed consent for participation and publication.
Results
We analysed 6 lesions from 3 patients over multiple sessions, providing a total of 26 image stacks. We will be
specifying the lesions by a patient number and lesion number in the notation P#L#. The lesions imaged in this
study had a wide variety of morphologies and presented dynamic behaviour over imaging sessions. The range
of metrics used allowed detection of changes in overall blood supply, lesion size, structure, and density. Several
lesions from different patients are presented in this paper to demonstrate the purpose and versatility of the
proposed metrics.
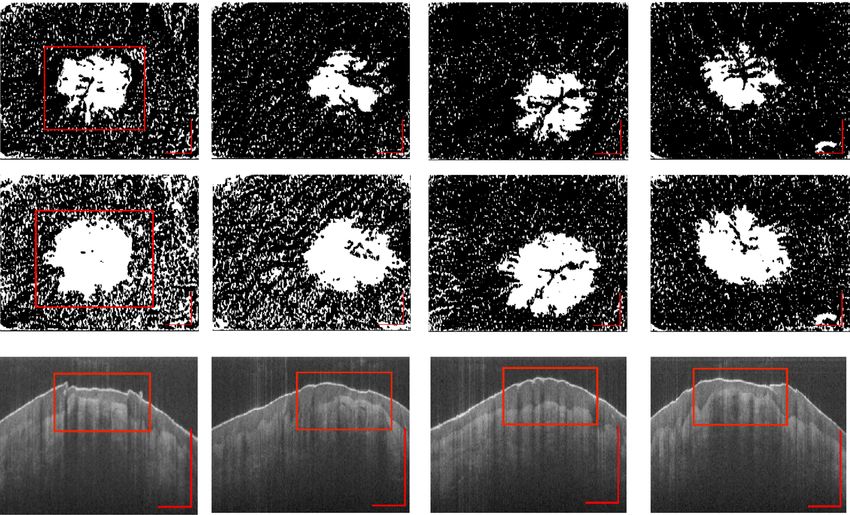
Progression analysis. The images in Fig. 2a-d and e–h show the 6 × 6 mm filtered and binarized en face
images from superficial and deep vascular ranges, respectively, of P2L1 over the course of imaging sessions.
These figures reveal the densely concentrated network of the dilated and interconnected vasculature of the tel-
angiectasia, as well as the supporting vessels. With the lesions shown at two depths, structural differences can
be observed as the lesion protrudes into deeper dermal vascular networks. Figure 2i-l are the structural cross-
sectional images generated from Channel 4 of the VivoSight that show the changes in the dermal and epidermal
layers around the lesion. Uneven and bulging areas of the dermis are visible where the lesion swells into the
epidermis.
Tables 1 and 2 show the changes in metrics from both the superficial and the deep layers, respectively, of the
lesion shown in Fig. 2, P2L1, over the course of imaging sessions. From these metrics, we can see that the lesion
exhibited an overall decrease in VF and VALVe in both superficial and deep layers; however, changes in LA and
VLA were more variable. The third imaging session demonstrated a peak in most of the measurements, which
could have been due to a warmer body temperature causing vascular dilation. The EF had also peaked at the
3rd imaging session. This measure corresponded with the increases in deep lesion vasculature enface metrics,
Scientific Reports | (2022) 12:1805 | https://doi.org/10.1038/s41598-022-05272-1 3
Vol.:(0123456789)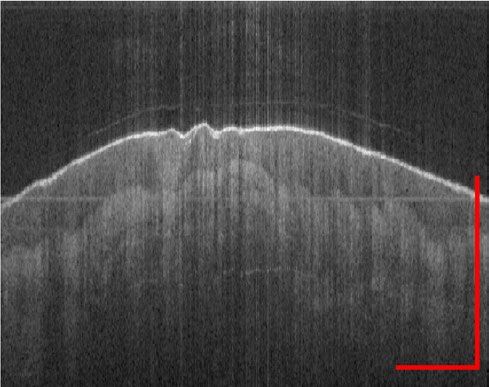
www.nature.com/scientificreports/
a b c d
e f g h
i j k l
Figure 2. Progression at the superficial (a-d) and deep (e–h) slice-stacks, and the structural cross-sections (i-l)
over the course of four imaging sessions P2L1. The axis in each image represents a 1 mm × 1 mm bar.
Imaging session VF VA (mm2) LA (mm2) VALVe FD
1 0.208 3.68 5.21 0.706 1.83
2 0.137 2.65 4.75 0.558 1.87
3 0.129 3.35 5.69 0.589 1.86
4 0.113 2.32 4.51 0.513 1.88
Table 1. Changes in quantitative metrics calculated from the superficial images of P2L1.
Imaging session VF VA (mm2) LA (mm2) VALVe FD EF
1 0.402 5.35 6.84 0.782 1.83 0.25
2 0.345 4.49 6.51 0.689 1.85 0.30
3 0.250 5.63 7.67 0.735 1.84 0.71
4 0.234 5.25 7.08 0.741 1.84 0.24
Table 2. Changes in quantitative metrics calculated from the deep images as well as the EF of P2L1.
potentially indicating a temporary shift in lesion centroid. FD showed a fairly consistent increase in both the
superficial and the deep, demonstrating a decrease in vessel density and complexity. It should be noted that the
lesions can be dynamic, being affected by both environmental (such as temperature) and external factors (includ-
ing, possibly, the administered drug), leading to changes in the features at times.
Characterization of lesion types. The VALVe provided a detailed and unique insight on the lesion behav-
ior and progression, and also served as a classification metric. Figure 3 shows three different lesion stack slices
with different density classifications based on the VALVe. Figure 3a,d,g show the DSDLI images of each lesion
and Fig. 3b,e,h show the filtered binary images. From these images, the differences in density are clearly visible;
however, the VALVe provides a metric to quantitatively define more minute differences in densities. Figure 3c,f,i
show an overlay of the lesion area in red on the isolated vascular area, providing a more definitive image of lesion
density. A VALVe close to 1 indicated that the lesion was densely vascularized and likely very active like P2L2
shown in Fig. 3a, whereas VALVe closer to 0 indicated a very poorly vascularized and diffuse lesion as shown
in Fig. 3g from P3L1. Density classification can provide insight on the complexity and robustness of the lesion
being studied. These classifications are made at each depth for every lesion, which provides a more quantitative
view of the nature of the vascular network of a lesion.
Another metric also capable of lesion classification is the EF. Figure 4a is an example of a superficial lesion
with the epidermis being very thin over the lesion relative to the healthy tissue. Figure 4b shows a deep lesion
Scientific Reports | (2022) 12:1805 | https://doi.org/10.1038/s41598-022-05272-1 4
Vol:.(1234567890)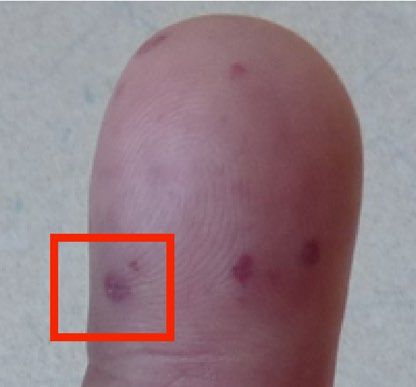
www.nature.com/scientificreports/

                                   a                      b                       c

                                   d                      e                       f

                                   g                      h                       i

                                 Figure 3.  Three lesions from different patients demonstrating very different morphologies classifiable by
                                 VALVe. (a-c) is a deep slice example of a dense lesion, P2L2, with a VALVe = 0.903, (d-f) is a superficial slice
                                 example of an intermediate lesion, P1L1, with VALVe = 0.512, and (g-i) is a superficial slice example of a diffuse
                                 lesion, P3L1, with a VALVe = 0.290. The axis in each image represents a 1 mm × 1 mm bar.

                           a                                  b                                c                                    d

                                 Figure 4.  Two lesions from different patients demonstrating EFs and classifications. (a) is a superficial lesion,
                                 P2L2, with EF = 0.46 and (b) is the surface photograph of P2L2. (c) is a deep lesion, P1L1, with EF = 0.93 and (d)
                                 is the surface photograph of P1L1. The axis in each image represents a 1 mm × 1 mm bar.

                                 with the epidermis being relatively thick. This metric shows important information regarding the location and
                                 coverage of the lesion. Surface images of both the superficial and deep lesions are shown in Fig. 4b,d respectively.
                                 These photos further emphasize the need of OCT imaging and metrics as these images cannot show the depth
                                 and other physiological differences between different lesions.

                                 Overall quantitative changes. The overall quantitative changes from the metrics of VF, VALVe, FD, and
                                 EF over the 4-month period are displayed in the graphs in Fig. 5. While images were acquired in all visits, not
                                 all images were suitable to the processing methods described above, and thus, some months do not have associ-
                                 ated quantitative values. A generalized trendline has been used for each dataset to indicate any general changes
                                 observed throughout the imaging. These graphs demonstrate the capability of the metrics of tracking different
                                 morphological changes in lesions over time. By plotting the metrics of placebo and treated lesions, researchers
                                 can see the differences in dynamic behavior of lesions. Since this study did not control for confounding factors,
                                 these figures serve only to demonstrate the capacity of the metrics to track changes, and may not show the pure
                                 response to the treatment; however, this does demonstrate the ability to visualize differences between visits, and
                                 future studies that better control these confounding factors can allow for the rapid elucidation and identification
                                 of key trends that may demonstrate earlier positive or negative response to treatments.

                                 Environmental factors. A major confounding factor is temperature. The lesion shown in Fig. 6 demon-
                                 strates the impact of temperature on the lesion due to vasodilation, with the lesion being barely visible upon
                                 arrival for the visit (a) and after cooling (c), but clearly visible after the application of a warm cloth (b). Note that
                                 this lesion image was collected from a fourth patient, not included in the data presented in Fig. 5. This image was
                                 collected after the study was completed for proof of concept. This lesion appears completely different given dif-
                                 ferent temperature conditions, and is practically undetectable from the VivoSight. This study took place across
                                 two seasons, increasing the likelihood that the temperature differences affected the presented results. Given
                                 these figures, it would be ideal to apply a warm wrap upon arrival before imaging to increase visibility and defini-
                                 tion of the lesion and its surrounding structures in future studies.

Scientific Reports |   (2022) 12:1805 |                https://doi.org/10.1038/s41598-022-05272-1                                                       5

                                                                                                                                                   Vol.:(0123456789)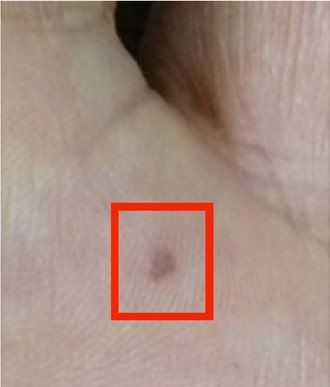
www.nature.com/scientificreports/

                                           Figure 5.  Graph of results for (a,b) vascular fraction, (c,d) VALVe, (e,f) Fractal Dimension, and (g) epidermal
                                           fraction, with (a,c,e) being superficial and (b,d,f) being deep, with (h) as a legend for all graphs.

          Scientific Reports |   (2022) 12:1805 |               https://doi.org/10.1038/s41598-022-05272-1                                                    6

Vol:.(1234567890)
www.nature.com/scientificreports/
a b c
Figure 6. Vascular images directly from the VivoSight showing the same lesion (a) upon arrival, (b) after
heating, (c) after cooling. The axis in each image represents a 1 mm × 1 mm bar.
Discussion
This pilot study was an exploratory study to develop a protocol for acquiring, processing, analysing, and quantify-
ing OCT images of cutaneous HHT lesions. As a result of this pilot, an integrated protocol can be defined which
will optimize patient experience, usability, image quality and reliability, and measurement accuracy.
Current practice in analysing telangiectases relies mostly on visual inspection or histological imaging. In
these practices, tracking and assessment is primarily qualitative, or is done by measuring approximate visible
surface diameters12,13. In this paper, we have employed OCT-A and developed specific metrics that were able
to track lesional changes and dynamic patterns in angiogenesis and blood flow, as well as structural changes
in vivo. Dynamic angiographic metrics include VF—which was able to quantify blood flow of both the lesion
and supporting vasculature, VLA—which provided isolated information on blood flow changes within the lesion
area, LA—which showed information on the spread of the lesion and possibly indications of angiogenesis, and
VALVe—which described lesion density. FD described size and complexity with a lower fractal dimension indi-
cating lower complexity and decreased vasculature. EF indicated changes in the epidermis related to the lesion.
Each metric provided important information on the lesion and its progression and were considered together to
provide comprehensive analysis.
All lesions showed unique variations across the metrics indicating that meaningful morphological changes to
lesion structures were detected over time. Although VF, VLA, and LA are all reliant on blood flow to the lesion,
the changes over time in each of these metrics for a single lesion did not necessarily follow the same trend, which
indicated the importance of collecting and analysing each of the metrics separately. Additionally, differences
between superficial and deep metrics also were noted, revealing differences in lesion response depending on
depth, and enforcing the need to measure metrics at different depths. Large scale, easily noticeable changes are
easy to visually observe, but differences in the finer details may not be noticeable, providing the need for quan-
titative metrics capable of detecting the small changes in morphology and angiogenesis not visible to normal
perception. The produced quantitative metrics show good potential for minute study of the underlying dynamic
processes occurring below the surface.
Little major change or correlation could be determined from the quantitative metrics used above. Some lesions
appeared to have little to no response, while others changed dramatically. As seen in Fig. 5, all lesions seemed to
show a general decline in values related to the amount of blood flowing to vasculature; however, P3L2 seemed
to show the opposite trend. It is difficult to determine if these changes are a consequence of treatment, natural
changes to lesion morphology, or simply due to variability in external environment affecting the lesions. It is
very possible that the treatment had no effect to the lesion and all of the noted changes in this study were due to
variability in environmental factors and patient physiology. As well, given that the lesions themselves varied in
size and morphology, some metrics are more effective than others at describing changes to morphology. Future
studies with a larger treatment and control patient cohorts are needed in order to validate this pipeline for use
as a clinical treatment assessment tool.
Given that vascular fraction evaluates the entire en face area imaged, changes to both the lesion and surround-
ing vasculature would have an impact on this metric. While used in analysis in other fields, this metric would
be subject to error from global changes affecting the entire imaging area, and thus may not be representative of
the dynamic processes in the lesion. Comparatively, VALVe isolates the vasculature in the lesion area, and would
provide a more accurate analysis of how the lesion has changed over time. This is more clearly seen in Fig. 5a-d,
where though a decrease in VF is observed in both deep and superficial, a very slight increase in the superficial
VALVe and a variable trend for the deep VALVe is seen. Thus, this more direct approach could potentially give
better insights into morphological changes compared to more traditional metrics like VF.
This analysis also provided valuable insight into potential sources for variability in a lesion, relating to both
environmental factors and biological processes. Throughout the study, many of the lesions showed a peak in
metrics late in treatment. Many of the imaging sessions started during a colder season and the peak in metrics
was noticed in the imaging sessions completed in the warmer seasons. From this, we can predict that the dilation
of the blood vessels was likely due to the change in temperature. This dilation can be seen in the sample data
provided in Tables 1 and 2, as well as Fig. 2. The test performed with a single lesion under different temperature
conditions, shown in Fig. 6, also demonstrates this phenomenon. The same lesion appears drastically different
upon arrival, after heating, and after cooling, emphasizing the drastic need for temperature controls in future
Scientific Reports | (2022) 12:1805 | https://doi.org/10.1038/s41598-022-05272-1 7
Vol.:(0123456789)www.nature.com/scientificreports/
studies. A method of characterization and grouping of lesions can also be observed through both VALVe and EF.
These metrics provide valuable insight related to the density and focus of the lesion, and could serve as useful
tools in treatment planning. In this, we propose that lesions be classified as “dense” or “diffuse” using the VALVe
measurement, and as “deep” or “superficial” according to EF. Figures 3 and 4 help to demonstrate the differences
between these classifications. While a binary classification may be possible, a more graded scale may need to be
employed; however, a larger dataset with more lesions should be studied in order to numerically assign values
to these classifications. Nonetheless, these characterizations can help with treatment planning. For example, a
deep, diffuse lesion may respond less well to topical therapies, or require adjustments to laser power to allow
sufficient penetration for lesion ablation using laser therapies. There is also potential to apply these characteriza-
tion metrics in diagnostic pipelines for younger patients or to diagnose uncertain lesions; however, more studies
are necessary to determine the metric thresholds that could successfully differentiate a telangiectasia from other
malformations. OCT can easily be adapted to and employed in a workflow to determine specific correlations
not only for HHT, but beyond to other dermatological and lesional analysis which has previously been through
qualitative visual inspection alone.
The process of image acquisition also revealed some systematic issues that could be improved upon. The
primary issue was that the image acquisition is very slow, with a single scan requiring up to 3 min. This long
acquisition period made the process very prone to motion artefacts. Many of the collected scans were rendered
unsuitable for quantification due to these large motion artefacts. This long acquisition time also limited feasi-
ble imaging regions. Some lesions of interest found on other skin surfaces were not feasible for imaging as the
patient and/or the technician were unable to maintain position for the full acquisition period. Additionally,
the current probe system has a plastic offset that sets a focusing distance between the laser source and the skin
surface. Depending on the skin location or consistency, epidermal thickness varies and the plastic offset needs
to be changed. This can be tedious, with an optimal offset often unavailable. Further, holding the probe still
against the skin will often induce pressure around the imaging region which can affect fine blood flow, potentially
impacting the angiographic metrics observed. After imaging an area, there was often an indent on the skin sur-
face from the plastic offset. Overall, system improvements including faster image acquisition and an adjustable
probe standoff would increase the range of application of the current system. A completely non-contact probe
would be a preferable solution, but may not be feasible without significant improvements to system acquisition,
and compensatory mechanisms for bulk motion. Potentially, a real-time imaging system could alleviate much
of this burden, but would require significant hardware improvements and optimization of current processing
methods to be fully realized. Additionally, a previous study has indicated that structural OCT image quality may
be slightly affected by skin tone; however, further investigation into OCT-A limitations with regard to skin tone
need to be c onducted26. Future improvements to acquisition methods to combat this issue would likely benefit
this study as well as many others.
Conclusion
In this pilot study, we have described a method for OCT acquisition, and outlined a post-processing pipeline
that could potentially be used to provide quantitative analysis of HHT lesions. In this, we have reprocessed data
taken from a clinical OCT system through a DSDLI algorithm with a series of standardized morphological opera-
tions in order to create an en face visualization of the complex vascular networks associated with HHT lesions.
These images were then used to determine quantitative measures that could be of value for analyzing changes to
these networks over time. While some attempts have been made at creating quantitative metrics for retinal OCT
imaging, this is a significantly underdeveloped area for dermatological OCT. Thus, this provides a potentially
generalized framework that could be employed not only for the study of HHT, but for other dermatological
conditions where OCT imaging may be appropriate. As well, improvements to workflow and limitations to the
current imaging system from experience are noted, with future work looking to overcome these limitations.
Larger studies are needed to validate these measures for clinical trials in HHT.
Data availability
The data used in this study is property of St. Michael’s Li Ka Shing Knowledge Institute and Sunnybrook Research
Institute. The datasets generated during and/or analyzed during the current study are available from the cor-
responding author on reasonable request.
Code availability
The software used in this application is written in MATLAB R2019A and can be obtained upon reasonable request
from the lead or corresponding author. The appropriate version of MATLAB can be downloaded from https://
www.mathworks.com/products/new_products/release2019a.html. Additionally, Fractalyse v2.4 was used and
can be downloaded at http://fractalyse.org/.
Received: 29 July 2020; Accepted: 17 February 2021
References
1. Faughnan, M. E. et al. International guidelines for the diagnosis and management of hereditary haemorrhagic telangiectasia. J.
Med. Genet. 48, 73–87 (2011).
2. Dakeishi, M. et al. Genetic epidemiology of hereditary hemorrhagic telangiectasia in a local community in the northern part of
Japan. Hum. Mutat. 19, 140–148 (2002).
3. Bideau, A., Plauchu, H., Brunet, G. & Robert, J. Epidemiological investigation of Rendu–Osler disease in France: Its geographical
distribution and prevalence. Population 44, 3–22 (1989).
Scientific Reports | (2022) 12:1805 | https://doi.org/10.1038/s41598-022-05272-1 8
Vol:.(1234567890)www.nature.com/scientificreports/
4. Guttmacher, A. E., Marchuk, D. A. & White, R. I. Hereditary hemorrhagic telangiectasia. N. Engl. J. Med. 333, 918–924 (1995).
5. Carette, M. F. et al. Imaging of hereditary hemorrhagic telangiectasia. Cardiovasc. Intervent. Radiol. 32, 745–757 (2009).
6. Plauchu, H., De Chadarevian, J. P., Bideau, A. & Robert, J. M. Age-related clinical profile of heredity hemorrhagic telangiectasia
in an epidemiologically recruited population. Am. J. Med. Genet. 32, 291–297 (1989).
7. Porteous, M. E. M., Burn, J. & Proctor, S. J. Hereditary haemorrhagic telangiectasia: A clinical analysis. J. Med. Genet. 29, 527–530
(1992).
8. Assar, O. S., Friedman, C. M. & White, R. I. The natural history of epistaxis in hereditary hemorrhagic telangiectasia. Laryngoscope
101, 977–980 (1991).
9. Brinjikji, W. et al. High rates of bleeding complications among hospitalized patients with hereditary hemorrhagic telangiectasia
in the United States. Ann. Am. Thorac. Soc. 13, 1505–1511 (2016).
10. Zarrabeitia, R. et al. Quality of life in patients with hereditary haemorrhagic telangiectasia (HHT). Health Qual. Life Outcomes
15(1), 19 (2017).
11. Shovlin, C. L. Hereditary haemorrhagic telangiectasia: Pathophysiology, diagnosis and treatment. Blood Rev. 24, 203–219 (2010).
12. Braverman, I. M., Keh, A. & Jacobson, B. S. Ultrastructure and Three-Dimensional Organization of the Telangiectases of Hereditary
Hemorrhagic Telangiectasia. J. Invest. Dermatol. 95, 422–427 (1990).
13. Fernández-Jorge, B., Losada, J. D. P., Paradela, S., Martínez-González, C. & Fonseca, E. Treatment of cutaneous and mucosal
telangiectases in hereditary hemorrhagic telangiectasia: Report of three cases. J. Cosmet. Laser Ther. 9, 29–33 (2007).
14. Cheng, K. H. Y. et al. Histogram flow mapping with optical coherence tomography for in vivo skin angiography of hereditary
hemorrhagic telangiectasia. J. Biomed. Opt. 19(086015), 1–6 (2014).
15. Tearney, G. J. et al. In vivo Endoscopic Optical Biopsy with Optical Coherence Tomography. New Series 276 (1997).
16. Michelson Diagnostics. VivoSight Scanner Specifications. (2015). https://vivosight.com/researcher/vivosight-scanner/#specificat
ion.
17. Morofke, D., Kolios, M. C., Vitkin, I. A. & Yang, V. X. D. Wide dynamic range detection of bidirectional flow in Doppler optical
coherence tomography using a two-dimensional Kasai estimator. Opt. Lett. 32, 253–255 (2007).
18. Mariampillai, A. et al. Speckle variance detection of microvasculature using swept-source optical coherence tomography. Opt.
Lett. 33, 1530–1532 (2008).
19. Shi, W., Gao, W., Chen, C. & Yang, V. X. D. Differential standard deviation of log-scale intensity based optical coherence tomography
angiography. J. Biophotonics 10, 1597–1606 (2017).
20. Baran, U., Li, Y., Choi, W. J., Kalkan, G. & Wang, R. K. High resolution imaging of acne lesion development and scarring in human
facial skin using OCT-based microangiography. Lasers Surg. Med. 47, 231–238 (2015).
21. Reif, R. et al. Quantifying optical microangiography images obtained from a spectral domain optical coherence tomography system.
Int. J. Biomed. Imaging 2012, 1–11 (2012).
22. Huang, P.-W. & Lee, C.-H. Automatic Classification for Pathological Prostate Images Based on Fractal Analysis. IEEE Trans. Med.
Imaging 28, 1037–1050 (2009).
23. Li, A., You, J., Du, C. & Pan, Y. Automated segmentation and quantification of OCT angiography for tracking angiogenesis progres-
sion. Biomed. Opt. Express 8, 5604–5616 (2017).
24. Vakoc, B. J. et al. Three-dimensional microscopy of the tumor microenvironment in vivo using optical frequency domain imaging.
Nat. Med. 15, 1219–1223 (2009).
25. Kim, N. T., Elie, N., Plancoulaine, B., Herlin, P. & Coster, M. An original approach for quantification of blood vessels on the whole
tumour section. Anal. Cell. Pathol. 25, 63–75 (2003).
26. Ekelem, C. et al. The effect of melanin on in vivo optical coherence tomography of the skin in a multiethnic cohort. Lasers Surg.
Med. 51, 407–411 (2019).
27. Demidov, V. et al. Preclinical quantitative in-vivo assessment of skin tissue vascularity in radiation-induced fibrosis with optical
coherence tomography. J. Biomed. Opt. 23, 1 (2018).
Acknowledgements
The Brain Vascular Malformation Consortium (U54NS065705) is a part of the NCATS Rare Diseases Clinical
Research Network (RDCRN) and is supported by the RDCRN Data Management and Coordinating Center
(DMCC) (U2CTR002818). RDCRN is an initiative of the Office of Rare Diseases Research (ORDR), NCATS,
funded through a collaboration between NCATS and NINDS. M.E.F. was also supported by the Nelson Arthur
Hyland Foundation, Li Ka Shing Knowledge Institute. The research is also supported by the Natural Sciences
and Engineering Research Council of Canada (NSERC) and the Canadian Foundation for Innovation (CFI).
Author contributions
J.R., D.C., A.C., M.F. and V.Y. conceived the original idea and aims of the project. M.F. and V.Y. supervised the
project and the BVMC were advisors as the project developed. D.C., A.C., and M.F. managed and obtained
participants, and lesion treatment and biopsies. W.S. and C.C. developed and refined the DSDLI algorithm for
applications in this project. J.C, J.R, and N.N. developed the processing and quantification algorithms. J.C. wrote
the software with image processing theory provided by N.N. J.R. and J.C. refined the parameters of the algorithm
to optimize performance. J.C. developed the quantitative metrics with supervision of J.R. J.C., J.R., N.N. acquired
the images from the patients. J.C., J.R., T.Y., M.C., D.C. processed the patient data and collected the quantita-
tive metrics. J.C and J.R. reviewed data processed by T.Y, M.C. and D.C. J.C. and J.R. wrote the manuscript with
supervision of M.F. and V.Y. J.C. and J.R. prepared the figures. All authors reviewed and approved the manuscript.
Funding
This study and the BVMC were supported by U54NS065705. The BVMC is a part of the National Institutes of
Health (NIH) Rare Disease Clinical Research Network (RDCRN), supported through collaboration between
the NIH Office of Rare Diseases Research (ORDR) at the National Center for Advancing Translational Science
(NCATS), and the National Institute of Neurological Disorders and Stroke (NINDS). M.E.F. was also supported
by the Nelson Arthur Hyland Foundation, Li Ka Shing Knowledge Institute. The research is also supported by
the Natural Sciences and Engineering Research Council of Canada (NSERC) and the Canadian Foundation for
Innovation (CFI). The funders had no role in study design, data collection and analysis, decision to publish, or
the preparation of the manuscript.
Scientific Reports | (2022) 12:1805 | https://doi.org/10.1038/s41598-022-05272-1 9
Vol.:(0123456789)www.nature.com/scientificreports/
Competing interests
VXDY is the creator of components of technology licensed to Michelson Diagnostics Ltd, the manufacturer of
the system used in this study, and receives IP licensing fee from University Health Network. There are no other
conflicts of interest arising from this role. The remaining authors have no relevant conflicts of interest to disclose.
Additional information
Correspondence and requests for materials should be addressed to J.L.C.
Reprints and permissions information is available at www.nature.com/reprints.
Publisher’s note Springer Nature remains neutral with regard to jurisdictional claims in published maps and
institutional affiliations.
Open Access This article is licensed under a Creative Commons Attribution 4.0 International
License, which permits use, sharing, adaptation, distribution and reproduction in any medium or
format, as long as you give appropriate credit to the original author(s) and the source, provide a link to the
Creative Commons licence, and indicate if changes were made. The images or other third party material in this
article are included in the article’s Creative Commons licence, unless indicated otherwise in a credit line to the
material. If material is not included in the article’s Creative Commons licence and your intended use is not
permitted by statutory regulation or exceeds the permitted use, you will need to obtain permission directly from
the copyright holder. To view a copy of this licence, visit http://creativecommons.org/licenses/by/4.0/.
© The Author(s) 2022
the Brain Vascular Malformation Consortium HHT Investigator Group
Murali Chakinala9, Marianne S. Clancy10, Marie Faughnan7, James R. Gossage11, Katharine
Henderson12, Vivek Iyer13, Raj S. Kasthuri14, Helen Kim6, Timo Krings15, Michael T. Lawton16,
Doris Lin17, Johannes Jurgen Mager18, Douglas A. Marchuk19, Justin P. McWilliams20, Jamie
McDonald21, Ludmila Pawlikowska6, Jeffrey Pollak22, Felix Ratjen23, Karen Swanson24, Dilini
Vethanayagam25, Andrew J. White26 & Pearce Wilcox27
9
Washington University School of Medicine, St. Louis, MO, USA. 10HHT Foundation, Monkton, MD, USA. 11Division
of Pulmonary, Critical Care, and Sleep Medicine, Augusta University, Augusta, GA, USA. 12Yale HHT Center,
Yale University School of Medicine, New Haven, CT, USA. 13Division of Pulmonary and Critical Care Medicine,
Mayo Clinic, Rochester, NY, USA. 14Division of Hematology and Oncology, Department of Medicine, University
of North Carolina at Chapel Hill, Chapel Hill, NC, USA. 15Division of Neuroradiology, Department of Medical
Imaging, Toronto Western Hospital, University of Toronto, Toronto, ON, Canada. 16Department of Neurosurgery,
Barrow Neurological Institute, Phoenix, AZ, USA. 17Department of Neurosurgery, Johns Hopkins University
School of Medicine, Baltimore, MD, USA. 18Department of Pulmonology, St. Antonius Hospital, VB, Nieuwegein,
The Netherlands. 19Molecular Genetics and Microbiology, Duke University, Durham, NC, USA. 20Department of
Radiology, David Geffen School of Medicine at UCLA, Los Angeles, CA, USA. 21Department of Radiology, University
of Utah, Salt Lake City, UT, USA. 22Radiology and Biomedical Imaging, Yale University School of Medicine,
New Haven, CT, USA. 23Division of Respiratory Medicine, Department of Pediatrics, Hospital for Sick Children,
Toronto, ON, Canada. 24Pulmonology and Critical Care Medicine, Mayo Clinic, Scottsdale, AZ, USA. 25Department
of Medicine, University of Alberta, Edmonton, AB, Canada. 26Edward Mallinkrodt Department of Pediatrics,
Washington University School of Medicine, St. Louis Children’s Hospital, St. Louis, MO, USA. 27Respirologist,
Pacific Lung Health Centre, St. Paul’s Hospital, Vancouver, BC, Canada.
Scientific Reports | (2022) 12:1805 | https://doi.org/10.1038/s41598-022-05272-1 10
Vol:.(1234567890)You can also read


