Q4 2020 Investor Presentation - 18 February 2021 Oscar Werner - Sinch Investors
←
→
Page content transcription
If your browser does not render page correctly, please read the page content below

Q4 2020
Investor Presentation
18 February 2021

Oscar Werner
CEO
Roshan Saldanha
CFO
Thomas Heath
Chief Strategy Officer & Head of Investor Relations

SEK 8.0bn           SEK 912m                  SEK 106bn               2,083       47 countries with
       revenue in the      Adj. EBITDA in the        Market Cap              people      local presence
       past 12 months      past 12 months

                                                                  145 billion              Publicly listed on
Customer engagement through mobile technology                     engagements per year     NASDAQ
                                                                                           in Stockholm

           Scalable cloud communications                                Serving 8 of the 10 largest
           platform for messaging, voice and video                      U.S. tech companies

             100% Consumer penetration                       Growing, global, multi-billion
                                                             USD market

           Profitable since our                 10x growth in gross profit
      $    foundation in 2008                   since IPO in 2015
                                                                                                                2
Track record of profitable growth

                 6,000
                                                                                                                                                  •   Focus on Gross profit since pass-
                                                                                                                                                      through revenues vary between
                 5,000                                                                                                                                geographies
                 4,000                                                                 Inteliquent                                                •   81% growth in Gross profit and
   SEK million

                 3,000                                                                         ACL                                                    63% growth in EBITDA in Q4 20
                                                                                               SDI
                 2,000                                                                        Wavy
                                                                                                                       Inteliquent
                                                                                                                       Synergies
                                                                                                                                                  •   Acquisitions of Wavy, SDI, ACL
                                                                                                                       ACL                            and Inteliquent adding
                 1,000                                                                                                 SDI
                                                                                                                       Wavy
                                                                                                                                                      significantly to our scale and
                    0                                                                                                                                 profitability
                                 2016               2017              2018              2019              2020

                                         Gross profit               Adj EBITDA                 Acquisitions

The acquisition of Inteliquent is pending regulatory approval. ACL includes the last 8 months of earnings before the unit was consolidated on 1
September. SDI includes the last 10 months of earnings before the unit was consolidated on 1 November. Synergies refer to expected synergies                                              3
for Wavy and SAP Digital Interconnect, estimated mid-point, at full run rate. Exchange rates as of 17 February 2021.
Growth markets

Messaging                                       CPaaS
Application-to-Person (A2P) messaging is used   Communications Platform as a Service (CPaaS)
across the world for ever-more use cases        allows businesses to easily integrate
                                                messaging, voice and video services into their
                                                own applications
•   USD 17 bn market size for A2P SMS
    (MobileSquared), other estimates vary
    between USD 15-50 bn                        •   Juniper Research sees a 30% growth CAGR
•   Business usage of SMS continues to grow     •   Gartner expects a 33% growth CAGR
•   >100% growth rates expected in business     •   IDC forecasts a 33% growth CAGR
    messaging through next-generation
    messaging channels like WhatsApp & RCS
                                                •   “By 2023, 90% of global enterprises will
                                                    leverage API-enabled CPaaS offerings, up
                                                    from 20% in 2020” – Gartner

                                                                                                 4
Creating value for businesses & their customers

                                                                                                             Next-gen
                         Email                                                               SMS             messaging

            Rich content                                                   Limited content                Rich content
            Limited reach                                                    100% reach                   100% reach*

                                                                       35x higher open rate            App-like experience

* Blending multiple channels including RCS, WhatsApp, Messenger and SMS with landing page technology                         5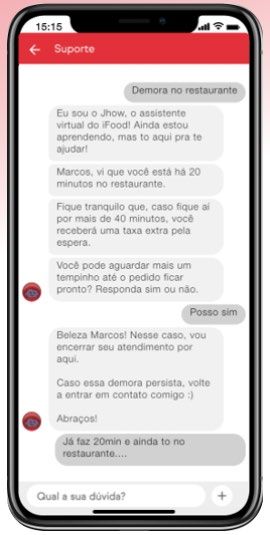
The Sinch Conversation API
                             •   Send and receive messages on
                                 multiple conversational channels
                                 through a single API
                             •   Leverage the expanded feature set
                                 of next-generation messaging
                                 channels
                             •   WhatsApp, RCS, Viber, SMS
                                 and more
                             •   Support for bots with seamless
                                 handover to a human when needed

                                                                    6   6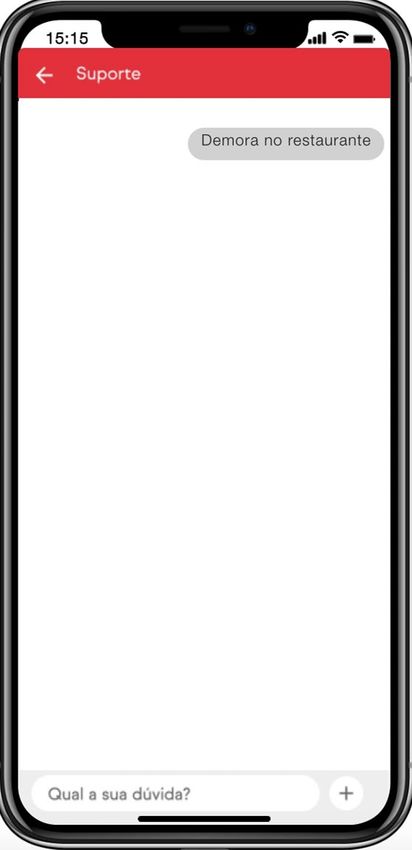
Rich rendering across channels

     SMS       RCS      WhatsApp   Messenger   Viber

                                                       7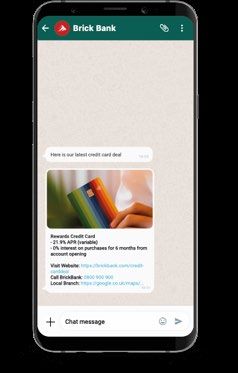
WhatsApp messaging with Salesforce

                              •   Next-generation messaging
                                  for Salesforce customers using
                                  Marketing Cloud
                              •   Joint product development with
                                  Salesforce, starting with WhatsApp
                              •   Native integration into the
                                  Salesforce Marketing Cloud
                                  Journey Builder
                              •   Available from 16 February

Watch more: product demo                                               8
Raising NPS scores with iFood     Challenge
                                  •   Human agents stretched too thin
                                      and struggling to service delivery
                                      drivers on time
                                  Solution
                                  •   iFood chatbot to register new
                                      drivers, onboard restaurants and
                   Whatsapp

                                      measure NPS
                     Slack
                                  Results
                                  •   70% reductions in delivery
                 Apple Business
                      Chat
                                      service costs
                                  •   1.4m conversations per year
                                  •   44.6% requests handled by the bot
                   Web Chat

                                                                           9   9
Playbook for profitable growth

                    • Empower businesses to leverage rich and conversational messaging
      Software-
                    • Increase our software value-add (CPaaS) in addition to our connectivity offering
     as-a-Service   • Increase stickiness with maintained scalability

                    • Ensure leading direct global connectivity without middlemen
     Connectivity   • Differentiate through superior quality, scale and reach
                    • Benefit from market growth and continue to win market share

                                                                                                         10
Strategic acquisitions
Conversational AI
Technology & Innovation
Go To Market Voice, video, Personalized Rich messaging, Next-generation
verification video Low code tools messaging
2016 2017 2018 2020 2021
Scale and
profitability USA, Australia, SMS
Western Europe South East Asia Brazil Latin America North America
SAP Digital
Interconnect
Germany, Americas,
Central Europe Nordics India
Europe, APAC
11Deal rationale: Inteliquent
• Largest independent voice communications provider in the United States
Inteliquent • 300+ billion voice minutes per year and 100+ million active phone numbers
• Around 600 employees including contractors with headquarters in Chicago, Illinois
• Establish Sinch as a leader in voice communications selling to the largest US voice customers
Deal
• Super network for voice reaching 94% of the US population without middlemen
rationale • Accretive deal that fits Scale and Profitability category
• Integration costs estimated to reach USD 25 million over 18 months
• Cross- and upsell combined Sinch+Inteliquent product portfolio
Integration
• Reinvest USD 15-20 million of EBITDA to accelerate joint roadmap in CPaaS voice, strengthen enterprise
go to market and expand voice offering internationally
• Enterprise value of USD 1,140m. Closing is subject to regulatory approval, closing expected in H2 2021
• Reported revenues of USD 533m, gross profit of USD 256m, and EBITDA of USD 135m in 2020
Financials • Revenues of USD 499m, GP of USD 233m and Adj EBITDA of USD 112m excl. temporary Covid uplift
• Underlying year-on-year revenue growth around 11% over the past 2 years driven by growth in CPaaS
12October – December 2020
• Gross profit rising 81% to SEK 795.7 million (439.9)
• Adjusted EBITDA rising 63% to SEK 325.7 million (199.5)
• Adjusted EBIT excl. acquisition-related amortization of SEK 303.7 million (185.7)
• Profit after tax of SEK 212.6 million (94.7)
• Organic Gross profit growth of 37% in local currency
• COVID-19 causing reduced voice traffic and lengthened sales cycles
• Continued opex investments to handle greater business volumes, strengthen our
go to market and develop new products
13Key growth drivers
1. 2. 3.
Volume growth & new Businesses increasing Acquisition of SDI,
use cases with US big their use of SMS in TWW, Wavy and
tech companies addition to email ACL Mobile
Growing both with new and existing customers
14Four investment areas
Operational New Integration
Organic growth
efficiency technology
• Continuous • COGS efficiency • Unified cross- • TWW & Wavy
investment in • Internal automation channel • ACL
platform scalability for improved Conversation API
• SDI
• Supporting growth scalability • New channels like
with existing WhatsApp and RCS • Inteliquent (planning)
• Client self-service
customers tools • Software for
• Greater focus on advanced, interactive
lead gen and new messaging
sales • RCS-as-a-Service
and 5G Messaging
for mobile operators 15Strong growth in Messaging
Messaging (SEKm)
• Total Gross profit growth of 84%
800
with organic growth at 47%
3,000 700
2,500 600 • SDI contributing from 1 November
2020 & Wavy from 1 February 2021
2,000 500
1,500
400 • US tech companies continue
300 to fuel growth
1,000
200
• Strong performance in December
500 100
0 0 • Tougher comparable figures
Q1 Q2 Q3 Q4 Q1 Q2 Q3 Q4 Q1 Q2 Q3 Q4 Q1 Q2 Q3 Q4 heading in to 2021
2017 2018 2019 2020
Gross profit EBITDA Revenue
16 16Rising message volumes
Number of transactions per month (billions) • Very large increase in September
2020 due to the acquisition of
14.0
SDI
ACL Mobile in India
12.0
• 354% year-on-year growth in
10.0 transactions in Q4 with 44% growth
8.0
ACL in comparable units
6.0 • Wavy to add further volume from
1 February
4.0
• Growth from existing customers,
2.0
new customers, new use cases
0.0
2016 2017 2018 2019 2020
17Gross profit per transaction
OPEX/transaction & Gross profit/transaction (SEK)
• Gross profit is the primary
0.050
Acquisition
of ACL bottom line driver
0.040 • Per-transaction measures relevant
to track profitability and economies
0.030 of scale
0.020 • ACL Mobile has significantly lower
GP and OPEX per transaction,
0.010 skews overall measures from
September 2020
0.000
2017 2018 2019 2020
GP/transaction (R3M) OPEX/transaction (R3M)
18Rising margin in Messaging
Messaging EBITDA/Gross profit
70% • Revenue and gross margin depend
60%
on mix of terminating markets
50% • EBITDA/Gross profit shows margin
excluding mobile operator charges
40%
30%
• Adding traffic volume increases
gross profit more than it increases
20% opex
10%
0%
1 2 3 4 5 6 7 8 9 101112 1 2 3 4 5 6 7 8 9 101112 1 2 3 4 5 6 7 8 9 101112 1 2 3 4 5 6 7 8 9 101112
2017 2018 2019 2020
19Modest improvement Voice and Video
Voice and Video (SEKm)
80
70
60
• Sharp decrease in demand for
Number masking from ride hailing
50
customers as Covid-19 reduces
40
travelling
30
20 • Positive underlying trends in
10 Number verification
0
-10
Q1 Q2 Q3 Q4 Q1 Q2 Q3 Q4 Q1 Q2 Q3 Q4 Q1 Q2 Q3 Q4
2017 2018 2019 2020
Revenue Gross profit EBITDA
20 20Recovery in Operators
Operators (SEKm)
80
70
60 • High margins in Operator Software
50
business
40 • SDI person-to-person (P2P)
30 messaging hub operating at lower
20 gross margin
10
0 • Promising demand for new 5G
-10
Messaging products sold together
with Ericsson
Q1 Q2 Q3 Q4 Q1 Q2 Q3 Q4 Q1 Q2 Q3 Q4 Q1 Q2 Q3 Q4
2017 2018 2019 2020
Revenue Gross profit EBITDA
21 21Q4 2020 Financials
Income statement
                                                    Q4        Q4
Sinch Group, SEK million                         2020       2019       2020        2019
Net sales                                      2 999,5    1 540,7    8 023,3    5 035,6    •   Non-recurring items in EBITDA
Cost of goods sold and services
Gross profit
                                               -2 203,8
                                                 795,7
                                                          -1 100,7
                                                           439,9
                                                                     -5 840,0
                                                                      2 183,3
                                                                                -3 641,4
                                                                                 1 394,1
                                                                                               reflect recent M&A activity

Other operating income                             34,1      26,6       197,8      103,1   •   SEK 75 million integration cost
Work performed by the entity and capitalized       19,8      15,3       69,4       38,6        related primarily to SDI
Other external costs                            -293,0      -90,0     -694,3     -328,7
Employee benefits expenses                       -311,5    -160,6     -869,4     -537,6
                                                                                           •   Adjusted EBIT excludes non-
                                                                                               recurring items as well as
Other operating expenses                          -66,0     -36,7      -171,9     -113,9
EBITDA                                            179,1     194,3       714,9     555,5
                                                                                               amortization of acquisition-related
Depreciation, amortization and impairment         -88,1     -51,4     -262,0     -183,9        assets
EBIT                                               91,0     142,9      452,9      371,6

Finance income                                     11,9    -299,7         5,7       18,6
                                                                                           •   Adjusted EBIT of SEK 303.7 million
Finance expenses                                  -45,3     279,4       -79,2     -35,2        (185.7) in Q4 20
Profit before tax                                 57,6      122,6      379,4      355,0

Current tax                                       -27,5     -25,8      -145,3     -83,8
Deferred tax                                      182,5      -2,2      208,4        3,3
Profit for the period                            212,6       94,7      442,5      274,5

                                                                                                                                     23
Gross profit growth
Organic Acquisitions FX
SEKm
+37% +49% -5%
900 215 -23 796
800 • Gross profit growth of 81%
700 compared to Q4 2019
169 -7 0 0
600
• 37% organic Gross profit growth
440
500
helped by record December
400
300 • Strengthened SEK causing
200 currency headwind
100
0
• Big US tech companies and
acquisitions fuelling growth
Q4 20
Messaging
Operator
Q4 19
Voice and
Acquisitions
Other
FX
Video
24Headcount increase
128%
1600
1 490
1400
• Headcount rises with recruitment
1200
and acquisitions
992
1000
744
794 • 1,778 people in Sinch at end of Q4
800
654
600 542 573 • 305 people joining from Wavy on
462 469 496
366 392 412 412 420 441 1 February 2021
400
200 • 159 SDI consultants now
recognised in headcount
0
Q1 Q2 Q3 Q4 Q1 Q2 Q3 Q4 Q1 Q2 Q3 Q4 Q1 Q2 Q3 Q4
2017 2018 2019 2020
Average number of employees Average number of consultants
25 25Reconciling Cash flow with EBITDA
Q4 Q4
SEK million 2020 2019 2020 2019
Adjusted EBITDA 325.7 199.5 912.5 573.5
Paid interest -5.6 -2.4 -29.7 -20.8
Paid taxes -19.2 -54.0 -101.3 -117.4 • Acquisition and integration costs
Other -145.9 -6.6 -179.4 -18.2 are visible in cash flow
Cash flow before changes in
working capital 154.9 149.7 602.1 453.5 • Non-recurring items in EBITDA
matches “Other” items in the Cash
Cash flow before changes in working flow bridge
capital / Adjusted EBITDA 48% 75% 66% 79%
26Cash flow
Q4 Q4
Sinch Group, SEK million 2020 2019 2020 R12M
Cash flow before changes in
working capital 154.9 149.7 602.1 453.5
Changes in working capital -206.7 -13.7 -148.2 -126.2
Cash flow from operating activities -51.8 135.9 453.9 327.3
Net investments in tangible
• Negative change in working capital
and intangible assets -19.5 -22.7 -85.6 -56.0
primarily related to the acquisition
Change in financial receivables -8.3 11.4 -2.2 12.1 of SDI
Acquisition of subsidiaries -2,189.9 -580.6 -2,884.6 -668.5
Cash flow from investing activities -2,217.7 -591.9 -2,972.4 -712.4
• Acquisition of subsidiary relates to
the acquisition of SDI
New borrowing/loan arrangement fees - 1,453.4 - 1,453.4
Amortization of bank loan -28.9 -683.8 -267.2 -756.7
• New share issue in November 2020
Amortization lease liability -8.4 -6.9 -30.4 -25.8
New share issue/warrants 3,317.6 1.4 5,529.0 2.1
Cash flow from financing activities 3,280.3 764.1 5,231.4 673.1
Cash flow for the period 1,010.8 308.1 2,712.9 288.0
27Integration
+ SAP Digital
Interconnect
Integration planning Integration Integration Integration
• Deal signed in February 2021 • TWW closed October 2019 • Deal closed September 2020 • Deal closed November 2020
• Wavy closed February 2020
• Regulatory approval process is • Onboarding and consolidation • Team onboarding • Onboarding 280+ employees
ongoing of joint teams • Traffic pooling outside India across 19 countries
• Expected to close H2 2021 • Sales goals alignment • Technology assessment • Transfer of shared functions
• Integration planning together • Platform assessment • Separation of business and
with Inteliquent management, • Initiatives to scale Wavy’s P2P messaging
as applicable under Conversational Messaging • Product portfolio review
competition rules business
28Financial targets Targets:
• Adjusted EBITDA per share to grow
20% per year
Adjusted EBITDA per share, rolling 12 months
• Net debt < 2.5x adjusted EBITDA
over time
16.0
14.0 Performance:
12.0
• Adjusted EBITDA per share grew
10.0 43% in Q4 20, measured on a rolling
8.0 12 month basis
6.0
4.0
• Net debt/EBITDA of -2.2x,
2.0
measured on a rolling 12 month
basis
0.0
Mar Jun Sep Dec Mar Jun Sep Dec Mar Jun Sep Dec Mar Jun Sep Dec Mar Jun Sep Dec
2016 2017 2018 2019 2020
29Financial leverage
Pro forma net debt/Adjusted EBITDA
3.4
2.5
• Pro forma calculation includes last
12 months of Adj EBITDA for
acquired entities
• Financial target is to maintain Net
debt < 2.5x adjusted EBITDA over
time
-1.3
-1.8
-2.2
Q4 20 Q4 20 + Wavy + Inteliquent
reported pro forma
30
The acquisition of Inteliquent is pending regulatory approval.Key priorities ahead
Continued growth with US-based, global tech companies
Initiatives for broadened growth across the base
New customer wins in next-gen messaging through Sinch Conversation API
Integration of Wavy & TWW, ACL and SDI
Continued strengthening of our connectivity offering
Investment in SaaS products for advanced, next-generation messaging
31Thanks! Copyright© 2019 CLX Communications AB (publ). All rights reserved. NDA Confidential. 32
You can also read