Q3 2022 Mid-Quarter Review: Retail and Institutional Activity Return, and Sharp Changing Market Volume Sources - Mondo Visione
←
→
Page content transcription
If your browser does not render page correctly, please read the page content below
Q3 2022
Mid-Quarter Review:
Retail and Institutional Activity Return,
and Sharp Changing Market Volume Sources

It’s time to check in on the conditions of the markets as the last four weeks have certainly
brought change.
While Q2 earnings did manage to keep volumes off the lows in the mid-summer stretch, it
didn’t play out as much of an activity catalyst compared to Q1. And as we’ve seen this peaking
inflation theme play out over the past few weeks, maybe corporate reports for the Q1 season
carried more weight in terms of a “window into the health of the economy” versus Q2—and
with it heightened trading activity.
But while volumes may not have jumped as much during the Q2 season, the price volatility
certainly stayed elevated. The below chart demonstrates just how sustained and consistent
the price action has been, really going back to December 2021. But in both cases, some of
the only semblance of orderliness or normalization was in the couple of weeks preceding the
earnings kickoff (red box showing the smallest daily moves on the S&P 500, followed by green
box as earnings season unfolded).

Figure 1

Source: Bloomberg

1

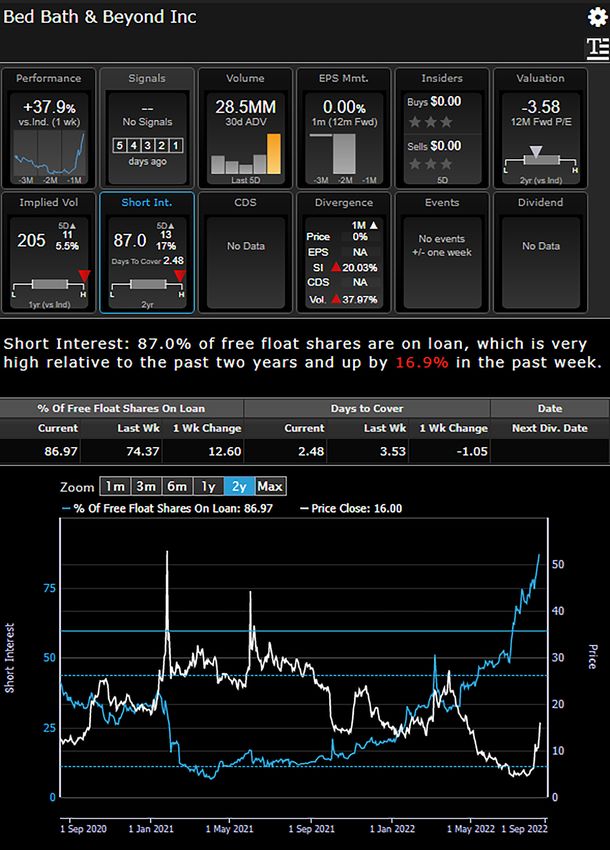
It’s interesting to just see how opposite the catalyst was—particularly as we come out of
Q2 season with price action almost decidedly in one direction—which likely helped to keep
volumes down, if the old mantra “rise on fumes” holds suit. As shown on Figure 2 and below,
Mid-April kickoff for Q1 highlighted red below and Q2 in green, we can see the beginning of a
~17% drop in the S&P 500 from Q1 earnings start versus a 13% gain from Q2 post time to current.

Figure 2

Source: Bloomberg

But maybe the most notable shift is in the source of market volumes over the past four weeks,
plenty of business attention going towards the retail community and of course, along with that,
the meme stock situations.
It is never an easy exercise to pinpoint exactly the retail volume contribution to the
marketplace but some exhaustive 605/606 data can get the stats close enough. And while the
retail flows hit post-pandemic lows in the Q1/Q2 stock swoon, the rebound signals began in
June and have accelerated through to now.
At lows, retail volume as a contributor was accounting in the low-teens percentages and is
now pushing back up to the high teens, as portrayed in the quickly rising FINRA TRF reported
volumes, hitting yearly highs at 46% of total volumes in recent days.
But before getting to the off-exchange/on-exchange volume comparison, the latest measures
supporting more retail inflows show that a stronger market will bring that component back to
life—maybe a secular trend that is here to stay? And when the retail wave turns its attention to
specific stock situations, it is bucking the trend of the year, where ETFs make up the bulk of the
retail action.
Interesting as the meme focus has turned back to those old stalwarts such as BBBY, AMC, and
even GME—all being tracked as heavy mentions in the popular forums and chatrooms, and
seeing eye-popping rallies to go along with. Check out the current sentiment setup in BBBY,
particularly an implied volatility that shows the options market pricing an expected
daily +/- 12% move—not for the faint of heart and accounting for 2%+ of the entire US market
volume at points!

2
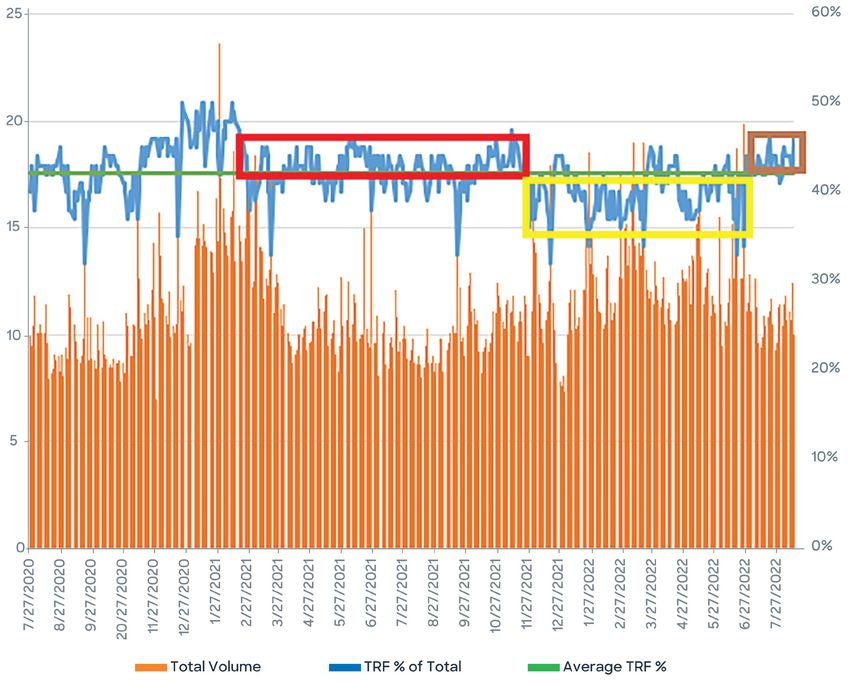
Figure 3

Source: Bloomberg

3

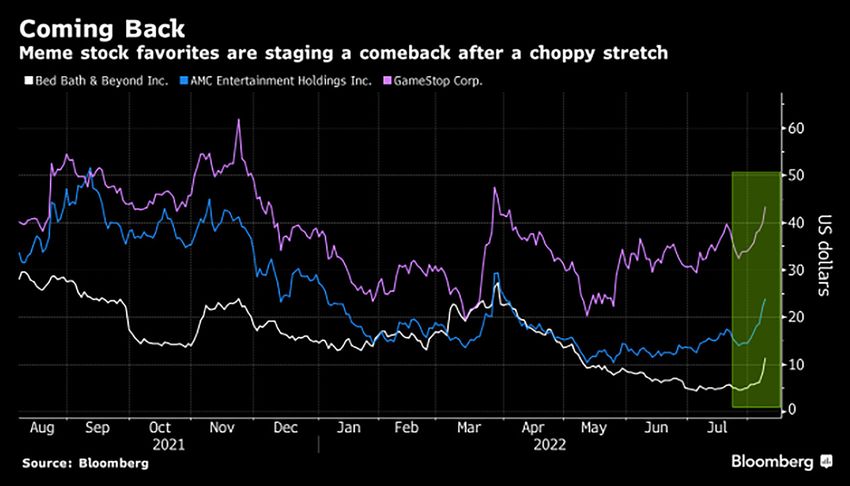
Figure 4 below from a Bloomberg story last week highlights those specific meme names, but
also cites that the retail army is faring well performance-wise versus institutions.

Figure 4

Source: Bloomberg

VIRT’s stock has shown a 20% price jump almost pivoting exactly on that Q2 earnings season
start—the action there can be indicative of the thoughts on retail trading trends.

Figure 5

Source: Bloomberg

And while the more popular, or headline-grabbing, meme stocks have maintained enough
market capitalization to stay listed on the major exchanges, in the wild world of Nasdaq OTC
where the penny stocks/pinks/bully’s rule the roost and where the execution is still more akin
to the traditional negotiation, we can observe that those more esoteric names are seeing a
nice resurgence—not near levels seen in early 2021, nor when the market was enjoying nice
gains later that year, but a strong pop off of consistently depressed levels for the vast majority
of 2022.

4

Figure 6

Source: Bloomberg

Now let’s get back to the aforementioned normalization of the market.
In a sharp contrast to the Q1/Q2 trends, the FINRA TRF reported volumes in the marketplace
are now at yearly highs—driven in no small part by the uptick in retail volumes, and the structure
which drives that volume to Single Dealer Platforms/Wholesalers. Q1/Q2 brought alarmingly
low levels of FINRA TRF reported volumes, the result of a resurgence in the more traditional
electronic market making, or HFT strategies. This backdrop was supported by the sustained
elevated spreads and the high real price volatility—the “profitable and flat by the end of the
day” type of model. This was driven by SORs to get directly to the exchanges—remember,
with volatility, order sizes, fill rates, and dark usage all dwindle. Spreads widen to compensate
market makers for risk and skipping dark to get directly to the exchange, hence the higher
on-exchange reporting. This natural procession appeared with strength heading into Q1, and
persisted really until just about four weeks ago.
But while 42-43% of the market in FINRA TRF reported volumes are more “normal,” the 46%
readings are not—and from the perspective of the institutional trader/portfolio manager,
pick your “contra poison.” The early part of the year saw the more nefarious type of opposite,
akin to racing to the quote on signals while now, we see volumes which will often times not be
institutionally accessible. Frustrating in either direction.

5
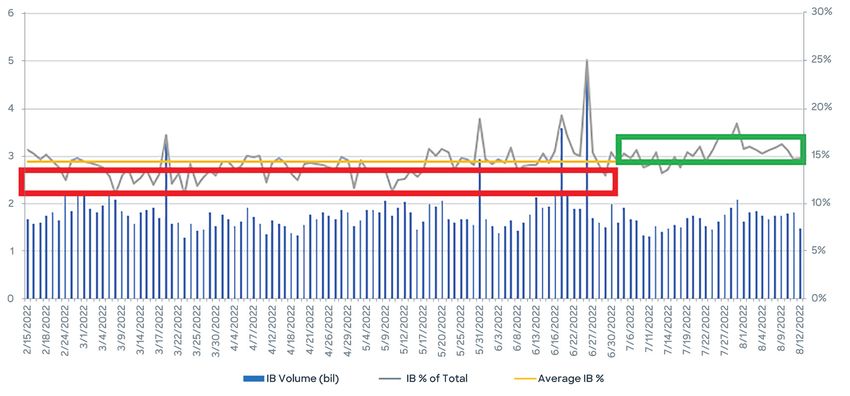
On Figure 7 below, the red time frame shows the post meme-stock frenzy of 2021 and more
balanced equity volume sources. The yellow time frame shows the onset of the Omicron flare
up into Russia/Ukraine and further into economic blowups and the brown time frame sharp
move back above trend.

Figure 7
TRF Volume

Source: Chart created by Liquidnet personnel based upon data from Bloomberg

And, as always, what can go along with the on-exchange/off-exchange readings is the
investment bank volumes as a % of overall executions—a decent proxy of the executable
institutional volume in the marketplace.
The vast majority of 2022 has seen poor readings here, below the longer term trend of 14-15%,
as mentioned, with other actors making up a greater share of volumes. But the equity rally has
done much to dent what are historically high correlations and has brought some attention to the
institutional readings. While overall depth of book isn’t showing marked improvement, better
institutional involvement brings the more preferred contra to the table and should help improve
costs. And not only are the IB readings stronger, it goes along with Liquidnet’s internal readings
of symbol match rates, share match rates, penetration rates, total liquidity, etc. We have seen a
decent couple of weeks in terms of algo aggression, willingness to work the algo in conjunction
with blocks, and negotiation participation.

6
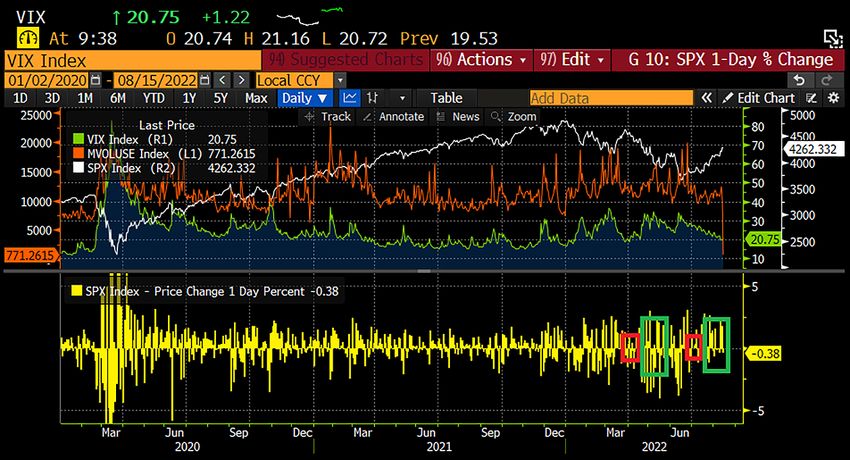
Figure 8
IB 6-month Volume

Source: Chart created by Liquidnet personnel based upon data from Bloomberg

Remember, there are three factors that determine cost to trade—volume, liquidity, spread. It is
not simple to determine which factor is the most powerful, but in terms of institutional liquidity,
it is easy to see that, while IB volumes for the bulk of the year have been below trend, other
factors such as spread and expected impact cost remained elevated—nothing compared
to pre-pandemic levels, but we can see improvement in recent weeks and moving off very
elevated levels.

Figure 9
US Top 500 Stocks
Bid-Offer Spread                                                 Cost Factor

Source: Liquidnet Analytics

7

Stocks have been moving in lockstep to an alarming degree for most of the year. The below
3M Realized Correlation Index on the S&P 500 was reaching to unseen levels (excluding the
onset of Covid) since fall of 2015, and before that, summer 2012. Lofty levels for sure, and an
unfavorable backdrop for stock picking by traders and portfolio managers looking to separate
themselves from the competition. Quants on the other hand were enjoying outsized gains in the
1H of 2022, trade press citing gains of 50%+, and where the most basic of factor trades played
out favorably—i.e. value, yield, low volume, and quality.

Figure 10

Source: Bloomberg

                       Jeffrey O’Connor
                       Head of Market Structure, Americas
                       joconnor@liquidnet.com

Questions? For more information, please contact your Liquidnet Coverage.

US                                                                          Canada
+1 646 674 2274                                                             +1 416 594 2470
eqs-us@liquidnet.com                                                        eqs-canada@liquidnet.com

© 2022 Liquidnet Holdings, Inc. and its subsidiaries. Liquidnet, Inc. is a member of FINRA/SIPC. Liquidnet Europe Limited is authorised and regulated by the Financial Conduct Authority in the UK, is licensed by the Financial
Sector Conduct Authority in South Africa, and is a member of the London Stock Exchange and a remote member of the SIX Swiss Exchange. Liquidnet EU Limited is authorised and regulated by the Central Bank of
Ireland and is a remote member of the Warsaw Stock Exchange. Liquidnet Canada Inc. is a member of the Investment Industry Regulatory Organization of Canada and a member of the Canadian Investor Protection
Fund. Liquidnet Asia Limited is regulated by the Hong Kong Securities and Futures Commission for Type 1 and Type 7 regulated activities and is regulated by the Monetary Authority of Singapore as a Recognized Market
Operator. Liquidnet Japan Inc. is regulated by the Financial Services Agency of Japan and is a member of JSDA/JIPF. Liquidnet Australia Pty Ltd. is registered with the Australian Securities and Investment Commission as
an Australian Financial Services Licensee, AFSL number 312525, and is registered on the New Zealand Financial Service Providers Register (FSPR number FSP3781). Liquidnet Singapore Private Limited is regulated by the
Monetary Authority of Singapore as a Capital Markets Services Licensee, CMSL number CMS 100757-1. Liquidnet Holdings, Inc. and its subsidiaries are part of TP ICAP Group plc.                                            8/22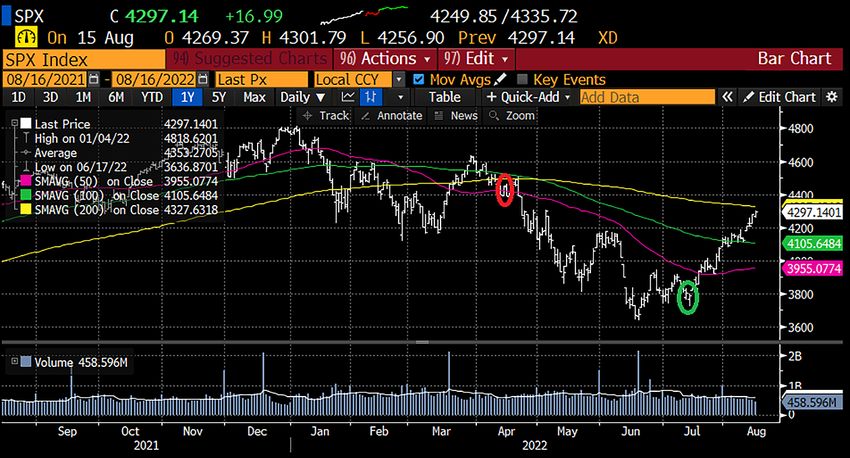
You can also read