Q3 2021 Earnings November 3, 2021 - Moving America's Energy Since 1996 - Energy Transfer
←
→
Page content transcription
If your browser does not render page correctly, please read the page content below

Moving America’s Energy Since 1996

Q3 2021 Earnings
November 3, 2021
Forward-looking Statements / Legal Disclaimer

Management of Energy Transfer LP (ET) will provide this presentation in conjunction with ET’s 3rd quarter 2021 earnings conference call. On the call, members of management may make statements about future events, outlook and expectations related to Panhandle Eastern
Pipe Line Company, LP (PEPL), Sunoco LP (SUN), USA Compression Partners, LP (USAC) and ET (collectively, the Partnerships), and their subsidiaries and this presentation may contain statements about future events, outlook and expectations related to the Partnerships
and their subsidiaries all of which statements are forward-looking statements. Any statement made by a member of management of the Partnerships at these meetings and any statement in this presentation that is not a historical fact will be deemed to be a forward-looking
statement. These forward-looking statements rely on a number of assumptions concerning future events that members of management of the Partnerships believe to be reasonable, but these statements are subject to a number of risks, uncertainties and other factors, many of
which are outside the control of the Partnerships. While the Partnerships believe that the assumptions concerning these future events are reasonable, we caution that there are inherent risks and uncertainties in predicting these future events that could cause the actual results,
performance or achievements of the Partnerships and their subsidiaries to be materially different. These risks and uncertainties are discussed in more detail in the filings made by the Partnerships with the Securities and Exchange Commission, copies of which are available to
the public. In addition to the risks and uncertainties disclosed in our SEC filings, the Partnership may have also been, or may in the future be, impacted by new or heightened risks related to the COVID-19 pandemic, and we cannot predict the length and ultimate impact of
those risks. The Partnership has also been, and may in the future be, impacted by the winter storm in February 2021 and the resolution of related contingencies, including credit losses, disputed purchases and sales, litigation and/or potential legislative action. The Partnerships
expressly disclaim any intention or obligation to revise or publicly update any forward-looking statements, whether as a result of new information, future events, or otherwise.
This presentation includes certain forward looking non-GAAP financial measures as defined under SEC Regulation G, including estimated adjusted EBITDA. Due to the forward-looking nature of the aforementioned non-GAAP financial measures, management cannot reliably
or reasonably predict certain of the necessary components of the most directly comparable forward-looking GAAP measures without unreasonable effort. Accordingly, we are unable to present a quantitative reconciliation of such forward-looking non-GAAP financial measures
to their most directly comparable forward-looking GAAP financial measures.
All references in this presentation to capacity of a pipeline, processing plant or storage facility relate to maximum capacity under normal operating conditions and with respect to pipeline transportation capacity, is subject to multiple factors (including natural gas injections and
withdrawals at various delivery points along the pipeline and the utilization of compression) which may reduce the throughput capacity from specified capacity levels.

Forward-Looking Statements
This presentation includes “forward-looking” statements. Forward-looking statements are identified as any statement that does not relate strictly to historical or current facts. Statements using words such as “anticipate,” “believe,” “intend,” “project,” “plan,” “expect,” “continue,”
“estimate,” “goal,” “forecast,” “may,” or similar expressions help identify forward-looking statements. Energy Transfer LP (“Energy Transfer” or “ET”) and Enable Midstream Partners, LP (“Enable” or “ENBL”) cannot give any assurance that expectations and projections about
future events will prove to be correct. Forward-looking statements are subject to a variety of risks, uncertainties and assumptions. These risks and uncertainties include the risks that the proposed transaction may not be consummated or the benefits contemplated therefrom
may not be realized. Additional risks include: the ability to obtain requisite regulatory and stockholder approval and the satisfaction of the other conditions to the consummation of the proposed transaction, the ability of Energy Transfer to successfully integrate Enable’s
operations and employees and realize anticipated synergies and cost savings, the potential impact of the announcement or consummation of the proposed transaction on relationships, including with employees, suppliers, customers, competitors and credit rating agencies, the
ability to achieve revenue, DCF and EBITDA growth, and volatility in the price of oil, natural gas, and natural gas liquids. Actual results and outcomes may differ materially from those expressed in such forward-looking statements. These and other risks and uncertainties are
discussed in more detail in filings made by Energy Transfer and Enable with the Securities and Exchange Commission (the “SEC”), which are available to the public. Energy Transfer and Enable undertake no obligation to update publicly or to revise any forward-looking
statements, whether as a result of new information, future events or otherwise.

Additional Information and Where to Find It
In connection with the proposed merger of ET and Enable, ET filed a registration statement on Form S-4, including a consent statement/prospectus of ET and Enable, with the SEC. INVESTORS AND SECURITY HOLDERS OF ET AND ENABLE ARE ADVISED TO
CAREFULLY READ THE REGISTRATION STATEMENT AND CONSENT STATEMENT/PROSPECTUS (INCLUDING ALL AMENDMENTS AND SUPPLEMENTS THERETO) BECAUSE THEY CONTAIN IMPORTANT INFORMATION ABOUT THE TRANSACTION, THE
PARTIES TO THE TRANSACTION AND THE RISKS ASSOCIATED WITH THE TRANSACTION. Investors and security holders may obtain a free copy of the consent statement/prospectus and other relevant documents filed by ET and Enable with the SEC from the SEC’s
website at www.sec.gov. Security holders and other interested parties will also be able to obtain, without charge, a copy of the consent statement/prospectus and other relevant documents from www.cnx.com under the tab “Investors” and then under the heading “SEC Filings.”

Participants in the Solicitation
Energy Transfer, Enable and their respective directors and executive officers may be deemed to be participants in the solicitation of consents in connection with the proposed merger of Energy Transfer and Enable. Information regarding the directors and executive officers of
Energy Transfer is contained in Energy Transfer’s Form 10-K for the year ended December 31, 2020, which was filed with the SEC on February 19, 2021. Information regarding the directors and executive officers of Enable is contained in Enable’s Form 10-K for the year ended
December 31, 2020, which was filed with the SEC on February 24, 2021. Additional information regarding the interests of participants in the solicitation of consents in connection with the proposed merger will be included in the consent statement / prospectus.

No Offer or Solicitation
This presentation is for informational purposes only and does not constitute an offer to sell or the solicitation of an offer to buy any securities or a solicitation of any vote or approval, in any jurisdiction, pursuant to the proposed merger or otherwise, nor shall there be any sale,
issuance, exchange or transfer of the securities referred to in this document in any jurisdiction in contravention of applicable law. No offer of securities shall be made except by means of a prospectus meeting the requirements of Section 10 of the Securities Act of 1933, as
amended.
                                                                                                                                                                                                                                                                                                 2
What’s New
Operational Q3 2021 Financials Strategic
NGL transportation and fractionation Adjusted EBITDA Q3’21: $2.6B Enable Midstream Acquisition
volumes, as well as NGL and Refined
Products terminal volumes all reached DCF Q3’21: $1.3B Continue to believe the
new records during Q3’21 transaction will close before the
Excess cash flow after distributions: end of 2021
In September 2021, entered into second ~$900mm
renewable energy power purchase Announced MOU with the Republic of
agreement for 120 megawatts of Growth Capital Spend: Panama to study the feasibility of jointly
electricity developing NGL assets in Panama
YTD’21: ~$1.1B
Exported more than 16 million barrels of ET’s General Counsel and head of its
FY’21E: ~$1.6B
ethane at Nederland terminal YTD Alternative Energy Group, Tom Mason,
through September 30, 2021 In Q3’21, repaid ~$800mm in debt was named 2021 Top General Counsel
by the National Diversity Council
Commissioned Mariner East 2X Pipeline, YTD’21, repaid ~$6 billion in debt
which increases current capacity to
~260,000 bbls/d
Placed Permian Bridge project into
service in October 2021
Best-in-class assets with extensive footprint position the partnership for long-term success
3
Rapidly Becoming A World Leader in NGL Exports
In total, ET’s percentage of worldwide NGL exports has nearly doubled
over the last 18 months to nearly 20%
ET NGL Exports Nederland Terminal
800
700
600
Thousand barrels per day
500
400
300
200
100
0
Q1 2014
Q2 2014
Q3 2014
Q4 2014
Q1 2015
Q2 2015
Q3 2015
Q4 2015
Q1 2016
Q2 2016
Q3 2016
Q4 2016
Q1 2017
Q2 2017
Q3 2017
Q4 2017
Q1 2018
Q2 2018
Q3 2018
Q4 2018
Q1 2019
Q2 2019
Q3 2019
Q4 2019
Q1 2020
Q2 2020
Q3 2020
Q4 2020
Q1 2021
Q2 2021
Q3 2021
Expanding industry leading business while capturing future growth opportunities in new markets
4
Source: Internal and Kpler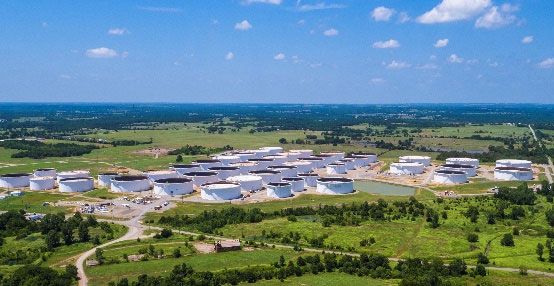
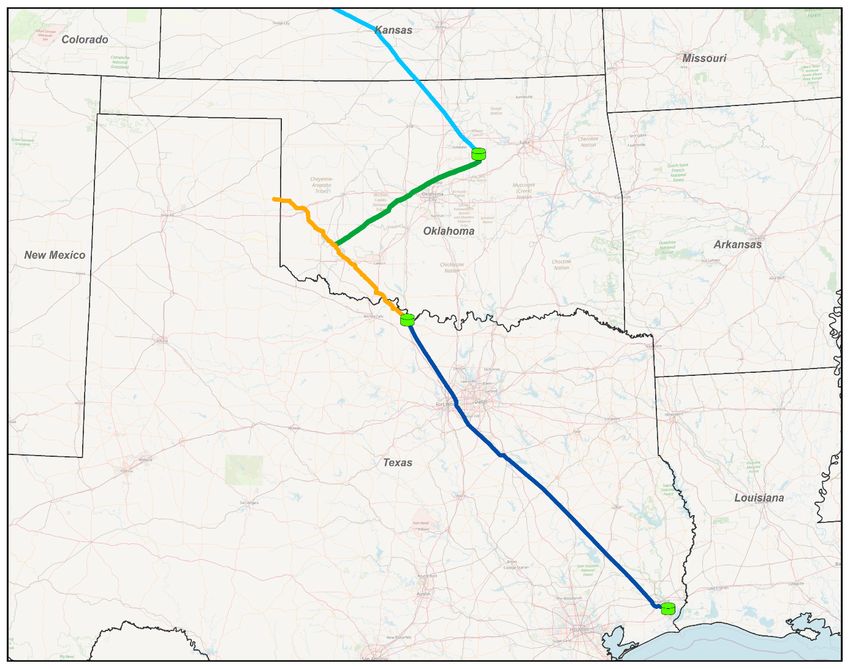
Expanding Reach While Adjusting to Market Flows
Cushing South Pipeline
From DJ Basin
ET Cushing Terminal
ET and Centurion Pipeline L.P. offers joint tariff crude oil
service from ET’s terminal in Cushing, OK to ET’s
Nederland terminal
Cushing
Provides ability to move Powder River and DJ Basin
barrels through Cushing to ET’s Nederland Terminal
Primarily utilizes existing assets, including ET’s White Cliffs
and Permian Express 1 Pipelines
Assets linked together via new connections in Oklahoma
~65,000 bpd of crude oil capacity, expansion will increase
Ringgold
capacity to 120,000 bpd
Already included in ET’s 2021 growth capital forecast
ET Nederland Terminal
Commenced service in June 2021
ET White Cliffs
Centurion Pipeline – expansion expected to be in service 2Q’22
ET Granite Wash Nederland
ET Permian Express 1
5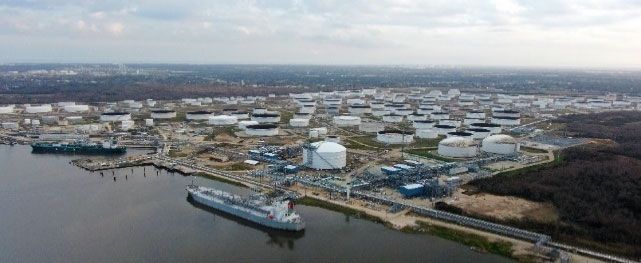
Focused on Cash Flow With Disciplined Investing

                                                                               2021E Growth Capital: ~$1.6 billion

                                                                                                                                                       % of 2021E1

                                                                 • Mariner East system (ME2, ME2X)
                                    NGL & Refined Products       • Nederland LPG facilities                                                               ~40%
                                                                 • Multiple projects < $50mm

                                                                 • Gathering and processing and compression projects primarily in West Texas and the
                                               Midstream           Northeast (slowed pace of development in accordance with demand)                       ~28%
                                                                 • Permian Bridge Project (New)

                                                                 •   Bakken pipeline optimization
                                                                 •   Ted Collins Link
                                                Crude Oil
                                                                 •   Cushing to Nederland Project Phase I and Phase II
                                                                                                                                                          ~20%
                                                                 •   Multiple projects < $50mm

                                                             2022E and 2023E Growth Capital: ~$500-700 million per year

                                                                                                                                                                     6
1.   Intra/Interstate and other segments estimated at ~12%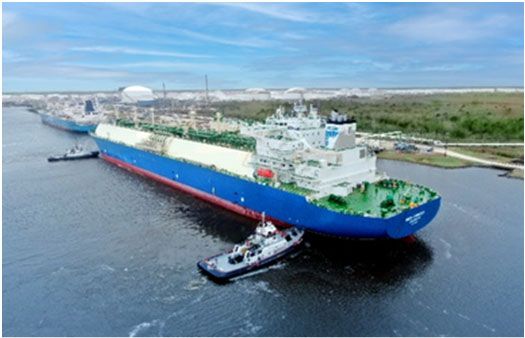
Alternative Energy Group
Focused on leveraging significant asset base and energy industry expertise to develop projects
to reduce environmental footprint throughout operations
Dual Drive Compressors - Established in 2012
Patented technology that allows for switching between electric motors and natural gas engines to drive compressors, and
offers the industry a more efficient compression system, helping reduce greenhouse gas emissions
In 2020, this technology allowed ET to reduce direct CO2 emissions by more than 630,000 tons
In June, our patented Dual Drive Technologies natural gas compression system was awarded a 2021 GPA Midstream
Environmental Excellence award for its impact on reducing CO2 emissions
Carbon Capture Utilization and Sequestration
Currently pursuing projects related to gathering and processing facilities, and evaluating opportunities to capture carbon
from ET and third-party facilities in the Northeast and transport CO2 through existing underutilized ET pipelines in close
proximity to CO2 sources
Provide cash flows to Energy Transfer with minimal capital requirements due to structures that allow monetization of
federal tax credits
Renewable Energy Use
Approximately 20% of the electrical energy ET purchases originates from a renewable energy source
Renewable Fuels
Evaluating opportunities to transport renewable diesel and renewable natural gas In August, ET announced it has joined the
Benefit from significant current asset footprint Environmental Partnership to expand its
focus on reducing environmental
footprint across its operations
Solar
Entered into first-ever dedicated solar contract, which anchors a 28 megawatt solar facility (Maplewood 2) in West Texas
Operate approximately 18,000 solar panel-powered metering stations across the country
Entered into second renewable energy power purchase agreement for 120 megawatts of electricity from facility in NE Texas
Repurpose Existing Assets
Evaluating repurposing extensive acreage in WV, VA, KY and ND to develop solar and wind projects
7
Pursuing opportunities to utilize ET’s significant asset footprint for the transportation of renewable fuels, CO2 and other products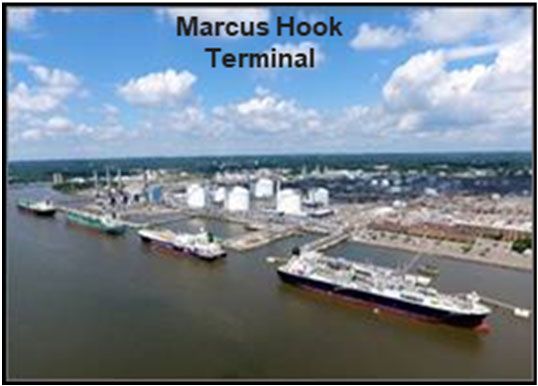
Non-GAAP
Reconciliations

Non-GAAP Measures
Energy Transfer LP
Reconciliation of Non-GAAP Measures *
2018 (a) 2019 2020 2021
Full Year Full Year Q1 Q2 Q3 Q4 Full Year Q1 Q2 Q3 YTD
Net income $ 3,420 $ 4,825 $ (964) $ 672 $ (401) $ 833 $ 140 $ 3,641 $ 908 $ 907 $ 5,456
Interest expense, net 2,055 2,331 602 579 569 577 2,327 589 566 558 1,713
Impairment losses 431 74 1,325 4 1,474 77 2,880 3 8 - 11
Income tax expense (benefit) from continuing operations 4 195 28 99 41 69 237 75 82 77 234
Depreciation, depletion and amortization 2,859 3,147 867 936 912 963 3,678 954 940 943 2,837
Non-cash compensation expense 105 113 22 41 30 28 121 28 27 26 81
(Gains) losses on interest rate derivatives (47) 241 329 3 (55) (74) 203 (194) 123 (1) (72)
Unrealized (gains) losses on commodity risk management activities 11 5 (51) 48 30 44 71 (46) (47) 19 (74)
Losses on extinguishments of debt 112 18 62 - - 13 75 7 1 - 8
Inventory valuation adjustments (Sunoco LP) 85 (79) 227 (90) (11) (44) 82 (100) (59) (9) (168)
Impairment of investment in unconsolidated affiliates - - - - 129 - 129 - - - -
Equity in (earnings) losses of unconsolidated affiliates (344) (302) 7 (85) 32 (73) (119) (55) (65) (71) (191)
Adjusted EBITDA related to unconsolidated affiliates 655 626 154 157 169 148 628 123 136 141 400
Other, net ( including amounts related to discontinued operations in 2018) 219 (54) 27 74 (53) 31 79 15 (4) (11) -
Adjusted EBITDA (consolidated) 9,565 11,140 2,635 2,438 2,866 2,592 10,531 5,040 2,616 2,579 10,235
Adjusted EBITDA related to unconsolidated affiliates (655) (626) (154) (157) (169) (148) (628) (123) (136) (141) (400)
Distributable Cash Flow from unconsolidated affiliates 407 415 113 112 128 99 452 76 89 103 268
Interest expense, net (2,057) (2,331) (602) (579) (569) (577) (2,327) (589) (566) (558) (1,713)
Preferred unitholders' distributions (170) (253) (89) (96) (97) (96) (378) (96) (99) (110) (305)
Current income tax (expense) benefit (472) 22 14 (15) (7) (19) (27) (9) (15) (10) (34)
Maintenance capital expenditures (510) (655) (103) (136) (129) (152) (520) (76) (140) (155) (371)
Other, net 49 85 22 18 17 17 74 19 17 14 50
Distributable Cash Flow (consolidated) 6,627 7,766 1,836 1,585 2,040 1,716 7,177 4,242 1,766 1,722 7,730
Distributable Cash Flow attributable to Sunoco LP (100%) (445) (450) (159) (121) (139) (97) (516) (108) (145) (146) (399)
Distributions from Sunoco LP 166 165 41 41 41 42 165 41 42 41 124
Distributable Cash Flow attributable to USAC (100%) (148) (222) (55) (58) (57) (51) (221) (53) (52) (52) (157)
Distributions from USAC 73 90 24 24 24 25 97 24 24 25 73
Distributable Cash Flow attributable to noncontrolling interests in other non-wholly-owned subsidiaries (875) (1,113) (290) (209) (234) (282) (1,015) (251) (251) (284) (786)
Distributable Cash Flow attributable to the partners of ET 5,398 6,236 1,397 1,262 1,675 1,353 5,687 3,895 1,384 1,306 6,585
Transaction-related adjustments 52 14 20 10 16 9 55 19 9 6 34
Distributable Cash Flow attributable to the partners of ET, as adjusted $ 5,450 $ 6,250 $ 1,417 $ 1,272 $ 1,691 $ 1,362 $ 5,742 $ 3,914 $ 1,393 $ 1,312 $ 6,619
9
* See definitions of non-GAAP measures on next slide
Non-GAAP Measures

(a) The closing of the ETO Merger in October 2018 impacted the Partnership’s calculation of Distributable Cash Flow attributable to partners, as well as the number of ET Common Units outstanding and the amount of distributions to be paid to partners. In order to provide information on
a comparable basis for pre-ETO Merger and post-ETO Merger periods, the Partnership has included certain pro forma information. For 2018, Distributable Cash Flow attributable to partners presented above reflects the following ETO Merger related impacts:
     • ETO is reflected as a wholly-owned subsidiary and Distributable Cash Flow attributable to partners reflects ETO’s consolidated Distributable Cash Flow (less certain other adjustments, as follows).
     • Distributions from Sunoco LP and USAC include distributions to both ET and ETO.
     • Distributable Cash Flow attributable to noncontrolling interest in our other non-wholly-owned subsidiaries is subtracted from consolidated Distributable Cash Flow to calculate Distributable Cash Flow attributable to partners.

Definitions

Adjusted EBITDA and Distributable Cash Flow are non-GAAP financial measures used by industry analysts, investors, lenders and rating agencies to assess the financial performance and the operating results of ET's fundamental business activities and should not be considered in
isolation or as a substitute for net income, income from operations, cash flows from operating activities, or other GAAP measures. There are material limitations to using measures such as Adjusted EBITDA and Distributable Cash Flow, including the difficulty associated with using
either as the sole measure to compare the results of one company to another, and the inability to analyze certain significant items that directly affect a company’s net income or loss or cash flows. In addition, our calculations of Adjusted EBITDA and Distributable Cash Flow may not be
consistent with similarly titled measures of other companies and should be viewed in conjunction with measurements that are computed in accordance with GAAP, such as segment margin, operating income, net income and cash flow from operating activities.

We define Adjusted EBITDA as total partnership earnings before interest, taxes, depreciation, depletion, amortization and other non-cash items, such as non-cash compensation expense, gains and losses on disposals of assets, the allowance for equity funds used during construction,
unrealized gains and losses on commodity risk management activities, inventory valuation adjustments, non-cash impairment charges, losses on extinguishments of debt and other non-operating income or expense items. Inventory adjustments that are excluded from the calculation of
Adjusted EBITDA represent only the changes in lower of cost or market reserves on inventory that is carried at last-in, first-out (“LIFO”). These amounts are unrealized valuation adjustments applied to Sunoco LP’s fuel volumes remaining in inventory at the end of the period.

Adjusted EBITDA reflects amounts for less than wholly-owned subsidiaries based on 100% of the subsidiaries’ results of operations. Adjusted EBITDA reflects amounts for unconsolidated affiliates based on the same recognition and measurement methods used to record equity in
earnings of unconsolidated affiliates. Adjusted EBITDA related to unconsolidated affiliates excludes the same items with respect to the unconsolidated affiliate as those excluded from the calculation of Adjusted EBITDA, such as interest, taxes, depreciation, depletion, amortization and
other non-cash items. Although these amounts are excluded from Adjusted EBITDA related to unconsolidated affiliates, such exclusion should not be understood to imply that we have control over the operations and resulting revenues and expenses of such affiliates. We do not control
our unconsolidated affiliates; therefore, we do not control the earnings or cash flows of such affiliates.

Distributable Cash Flow is used by management to evaluate our overall performance. Our partnership agreement requires us to distribute all available cash, and Distributable Cash Flow is calculated to evaluate our ability to fund distributions through cash generated by our operations.
We define Distributable Cash Flow as net income, adjusted for certain non-cash items, less distributions to preferred unitholders and maintenance capital expenditures. Non-cash items include depreciation, depletion and amortization, non-cash compensation expense, amortization
included in interest expense, gains and losses on disposals of assets, the allowance for equity funds used during construction, unrealized gains and losses on commodity risk management activities, inventory valuation adjustments, non-cash impairment charges, losses on
extinguishments of debt and deferred income taxes. For unconsolidated affiliates, Distributable Cash Flow reflects the Partnership’s proportionate share of the investee’s distributable cash flow.
                         ,                                                                                                                      ,                              g                     g                p              ,                            g            y
may not be available to be distributed to our partners. In order to reflect the cash flows available for distributions to the partners of ET, the Partnership has reported Distributable Cash Flow attributable to the partners of ET, which is calculated by adjusting Distributable Cash Flow
(consolidated), as follows:
    • For subsidiaries with publicly traded equity interests, Distributable Cash Flow (consolidated) includes 100% of Distributable Cash Flow attributable to such subsidiary, and Distributable Cash Flow attributable to the our partners includes distributions to be received by the parent
    company with respect to the periods presented.
    • For consolidated joint ventures or similar entities, where the noncontrolling interest is not publicly traded, Distributable Cash Flow (consolidated) includes 100% of Distributable Cash Flow attributable to such subsidiaries, but Distributable Cash Flow attributable to the partners
    reflects only the amount of Distributable Cash Flow of such subsidiaries that is attributable to our ownership interest.
For Distributable Cash Flow attributable to partners, as adjusted, certain transaction-related and non-recurring expenses that are included in net income are excluded.

                                                                                                                                                                                                                                                                                                   10
You can also read