Q1 2021 Shareholders' Report - Altus Group
←
→
Page content transcription
If your browser does not render page correctly, please read the page content below

Q1 2021
Shareholders’
Report

For the three months ended March 31, 2021

Altus Group Limited
Shareholders’ Report
March 31, 2021

Contents

Management’s Discussion & Analysis
  Forward‐Looking Information                                                         1
  Non‐IFRS Measures                                                                   2
  Overview of the Business                                                            4
  Strategy                                                                            6
  Financial and Operating Highlights                                                  9
  Discussion of Operations                                                            12
     Quarter Ended March 31, 2021                                                     12
     Revenues and Adjusted EBITDA by Business Unit                                    15
        Altus Analytics                                                               16
        Commercial Real Estate Consulting                                             18
        Corporate Costs                                                               19
  Liquidity and Capital Resources                                                     20
  Reconciliation of Adjusted EBITDA to Profit (Loss)                                  24
  Reconciliation of Adjusted Earnings (Loss) Per Share to Profit (Loss)               25
  Summary of Quarterly Results                                                        26
  Share Data                                                                          27
  Financial Instruments and Other Instruments                                         27
  Contingencies                                                                       28
  Changes in Significant Accounting Policies and Estimates                            29
  Disclosure Controls and Procedures and Internal Controls over Financial Reporting   29
  Additional Information                                                              30

Unaudited Interim Condensed Consolidated Financial Statements
  Interim Condensed Consolidated Statements of Comprehensive Income (Loss)            32
  Interim Condensed Consolidated Balance Sheets                                       33
  Interim Condensed Consolidated Statements of Changes in Equity                      34
  Interim Condensed Consolidated Statements of Cash Flows                             35
  Notes to Interim Condensed Consolidated Financial Statements                        36
Management’s Discussion & Analysis
March 31, 2021
The following management’s discussion and analysis (“MD&A”) is intended to assist readers in understanding Altus
Group Limited’s consolidated business, its business environment, strategies, performance, outlook and applicable
risks. References to the “Company” or “Altus Group” are to the consolidated group of entities, and this should be read
in conjunction with our unaudited interim condensed consolidated financial statements and accompanying notes (the
“interim financial statements”) as at and for the quarter ended March 31, 2021, which have been prepared on the
basis of International Financial Reporting Standards (“IFRS”) and reported in Canadian dollars. Unless otherwise
indicated herein, references to “$” are to Canadian dollars and percentages are in comparison to the same period in
2020. Starting in the first quarter of 2021, segmented results presented (including restated comparative figures)
include variable compensation costs that are accrued and allocated directly to the Company’s business units on a
quarterly basis. A table detailing the comparative 2020 quarterly results under the new treatment is posted on our
website under the Investor Relations section with our 2020 year‐end disclosure materials.
Unless the context indicates otherwise, all references to “we”, “us”, “our” or similar terms refer to Altus Group, and,
as appropriate, our consolidated operations.
This MD&A is dated as of May 6, 2021.
Forward‐Looking Information
Certain information in this MD&A may constitute “forward‐looking information” within the meaning of
applicable securities legislation. All information contained in this MD&A, other than statements of current
and historical fact, is forward‐looking information. Forward‐looking information includes, but is not
limited to, the discussion of our business and operating initiatives, focuses and strategies, our expectations
of future performance for our various business units and our consolidated financial results, including the
guidance on financial expectations, and our expectations with respect to cash flows and liquidity.
Generally, forward‐looking information can be identified by use of words such as “may”, “will”, “expect”,
“believe”, “plan”, “would”, “could”, “remain” and other similar terminology. All of the forward‐looking
information in this MD&A is qualified by this cautionary statement.
Forward‐looking information is not, and cannot be, a guarantee of future results or events. Forward‐
looking information is based on, among other things, opinions, assumptions, estimates and analyses that,
while considered reasonable by us at the date the forward‐looking information is provided, inherently are
subject to significant risks, uncertainties, contingencies and other factors that may cause actual results,
performance or achievements, industry results or events to be materially different from those expressed or
implied by the forward‐looking information. The material factors or assumptions that we identified and
applied in drawing conclusions or making forecasts or projections set out in the forward‐looking
information include, but are not limited to: engagement and product pipeline opportunities in Altus
Analytics will result in associated definitive agreements; settlement volumes in the Property Tax business
will occur on a timely basis and that assessment authorities will process appeals in a manner consistent
with expectations; the successful execution of our business strategies; consistent and stable economic
conditions or conditions in the financial markets; consistent and stable legislation in the various countries
in which we operate; no disruptive changes in the technology environment; the opportunity to acquire
accretive businesses; the successful integration of acquired businesses; and the continued availability of
qualified professionals.
The COVID‐19 pandemic has cast additional uncertainty on each of these factors and assumptions. There
can be no assurance that they will continue to be valid. Given the rapid pace of change with respect to the
1Management’s Discussion & Analysis
March 31, 2021
COVID‐19 pandemic, it is difficult to make further assumptions about these matters. The duration, extent
and severity of the impact the COVID‐19 pandemic, including measures to prevent its spread, will have on
our business is uncertain and difficult to predict at this time. As of the date of this MD&A, many of our
offices and clients remain subject to limitations and restrictions set to reduce the spread of COVID‐19, and
a significant portion of our employees continue to work remotely.
Inherent in the forward‐looking information are known and unknown risks, uncertainties and other factors
that could cause our actual results, performance or achievements, or industry results, to differ materially
from any results, performance or achievements expressed or implied by such forward‐looking information.
Those risks, uncertainties and other factors that could cause actual results to differ materially from the
forward‐looking information include, but are not limited to: the general state of the economy; the COVID‐
19 pandemic; currency; our financial performance; our financial targets; the commercial real estate market;
industry competition; our acquisitions; our cloud subscriptions transition; software renewals; professional
talent; third party information; enterprise transactions; new product introductions; technological change;
intellectual property; technology strategy; information technology governance and security; our product
pipeline; property tax appeals; legislative and regulatory changes; fixed‐price and contingency
engagements; appraisal and appraisal management mandates; the Canadian multi‐residential market;
customer concentration and the loss of material clients; interest rates; credit; income tax matters; health and
safety hazards; our contractual obligations; legal proceedings; our insurance limits; our ability to meet the
solvency requirements necessary to make dividend payments; leverage and financial covenants; our share
price; our capital investments; and the issuance of additional common shares, as well as those described in
our annual publicly filed documents, including the Annual Information Form for the year ended December
31, 2020 (which are available on SEDAR at www.sedar.com).
Given these risks, uncertainties and other factors, investors should not place undue reliance on forward‐
looking information as a prediction of actual results. The forward‐looking information reflects
management’s current expectations and beliefs regarding future events and operating performance and is
based on information currently available to management. Although we have attempted to identify
important factors that could cause actual results to differ materially from the forward‐looking information
contained herein, there are other factors that could cause results not to be as anticipated, estimated or
intended. The forward‐looking information contained herein is current as of the date of this MD&A and,
except as required under applicable law, we do not undertake to update or revise it to reflect new events
or circumstances. Additionally, we undertake no obligation to comment on analyses, expectations or
statements made by third parties in respect of Altus Group, our financial or operating results, or our
securities.
Certain information in this MD&A may be considered as “financial outlook” within the meaning of
applicable securities legislation. The purpose of this financial outlook is to provide readers with disclosure
regarding Altus Group’s reasonable expectations as to the anticipated results of its proposed business
activities for the periods indicated. Readers are cautioned that the financial outlook may not be appropriate
for other purposes.
Non‐IFRS Measures
We use certain non‐IFRS measures as indicators of financial performance. Readers are cautioned that they
are not defined performance measures, and do not have any standardized meaning under IFRS and may
differ from similar computations as reported by other similar entities and, accordingly, may not be
2Management’s Discussion & Analysis
March 31, 2021
comparable to financial measures as reported by those entities. We believe that these measures are useful
supplemental measures that may assist investors in assessing an investment in our shares and that they
provide more insight into our performance.
Adjusted Earnings before Interest, Taxes, Depreciation and Amortization (“Adjusted EBITDA”) represents
profit (loss) from continuing operations before income taxes, adjusted for the effects of: occupancy costs
calculated on a similar basis prior to the adoption of IFRS 16, finance costs (income), net ‐ other,
depreciation of property, plant and equipment and amortization of intangibles, depreciation of right‐of‐
use assets, finance costs (income), net ‐ leases, acquisition and related transition costs (income), unrealized
foreign exchange (gains) losses, (gains) losses on disposal of right‐of‐use assets, property, plant and
equipment and intangibles, share of (profit) loss of joint venture, impairment charges, non‐cash share‐
based compensation costs, (gains) losses on equity derivatives net of mark‐to‐market adjustments on
related restricted share units (“RSUs”) and deferred share units (“DSUs”) being hedged, (gains) losses on
derivatives, restructuring costs (recovery), (gains) losses on investments, (gains) losses on hedging
transactions, and other costs or income of a non‐operating and/or non‐recurring nature.
Adjusted EBITDA margin represents the percentage factor of Adjusted EBITDA to revenues. Refer to page
24 for a reconciliation of Adjusted EBITDA to our interim financial statements.
Adjusted Earnings (Loss) per Share (“Adjusted EPS”) represents basic earnings (loss) per share from
continuing operations adjusted for the effects of: occupancy costs calculated on a similar basis prior to the
adoption of IFRS 16, depreciation of right‐of‐use assets, finance costs (income), net ‐ leases, amortization of
intangibles of acquired businesses, unrealized foreign exchange losses (gains), (gains) losses on disposal of
right‐of‐use assets, property, plant and equipment and intangibles, non‐cash share‐based compensation
costs, losses (gains) on equity derivatives net of mark‐to‐market adjustments on related RSUs and DSUs
being hedged, interest accretion on contingent consideration payables, restructuring costs (recovery), losses
(gains) on hedging transactions and interest expense (income) on swaps, acquisition and related transition
costs (income), losses (gains) on investments, share of (profit) loss of joint venture, impairment charges,
(gains) losses on derivatives, and other costs or income of a non‐operating and/or non‐recurring nature.
The adjusted earnings (loss) reflect the above adjustments, net of tax. The basic weighted average number
of shares is adjusted for the effects of weighted average number of restricted shares. Refer to page 25 for a
reconciliation of Adjusted EPS to our interim financial statements.
ARGUS Enterprise (“AE”) software maintenance retention rate is calculated as a percentage of AE software
maintenance revenue retained upon renewal; it represents the percentage of the available renewal
opportunity in a fiscal period that renews, calculated on a dollar basis, excluding any growth in user count
or product expansion.
Over Time revenues is a metric consistent with IFRS 15, Revenue from Contracts with Customers. Our Over
Time revenues are comprised of software subscription revenues recognized on an over time basis in
accordance with IFRS 15, software maintenance revenues associated with our legacy licenses sold on
perpetual terms, Appraisal Management revenues, and data subscription revenues. Refer to page 16 for
discussion of Over Time revenues.
3Management’s Discussion & Analysis
March 31, 2021
Cloud adoption rate is a metric that represents the percentage of the total AE user base contracted on the
ARGUS Cloud platform. It includes both new AE cloud users as well as those who have migrated from our
AE on‐premise software.
Bookings is a new metric we are introducing in the first quarter of 2021 for the Altus Analytics business
segment. We define Bookings as the annual contract value (“ACV”) for new sales of our recurring offerings
(software, Appraisal Management solutions and data subscriptions) and the total contract value (“TCV”)
for one‐time engagements (consulting, training and due diligence).
Overview of the Business
Altus Group Limited is a leading provider of software, data solutions and independent advisory services
to the global commercial real estate (“CRE”) industry. Our businesses, Altus Analytics and Commercial
Real Estate Consulting (“CRE Consulting”), reflect decades of experience, a range of expertise, and
technology‐enabled capabilities. Our solutions empower clients to analyze, gain insight and recognize
value on their real estate investments. Headquartered in Canada, we have approximately 2,400 employees
around the world, with operations in North America, Europe and Asia Pacific. Our clients include many
of the world’s largest CRE industry participants. Altus Group pays a quarterly dividend of $0.15 per share
and our shares are traded on the Toronto Stock Exchange (“TSX”) under the symbol AIF.
We have two reporting business segments ‐ Altus Analytics and CRE Consulting.
Altus Analytics
Our Altus Analytics segment primarily consists of Over Time revenues, comprising software subscriptions
and maintenance, and data solutions that are made available to clients through our Appraisal Management
solutions and through data subscription products. A smaller portion of the segment includes non‐recurring
revenues primarily from software services. Altus Analytics clients predominately consist of CRE asset and
investment management firms, including large owners, managers and investors of CRE assets and funds,
as well as other industry participants including service providers, brokers, appraisers, developers, financial
institutions and the public sector.
Our globally sold ARGUS software solutions are among the most recognizable in the CRE industry. Our
cloud‐enabled product stack for global CRE asset and investment management comprises end‐to‐end
integrated software solutions that provide visibility at the asset, portfolio and fund level to help clients
enhance performance of their CRE investments. Our flagship AE software is the leading global solution for
CRE valuation and portfolio management and is widely recognized as the industry property valuation
standard in key CRE markets and is primarily offered on a cloud platform. AE’s suite of functionality
enables organizations to manage and predict the performance of their CRE assets throughout the
investment cycle supporting property valuations, investments, portfolios and budgeting. In addition to AE,
we also sell other cloud‐based software solutions to address key workflows in the areas of fund modeling
and forecasting, data management, development feasibility, and acquisitions. Following the April 1, 2021
acquisition of Finance Active SAS (“Finance Active”), we now also offer debt management SaaS solutions
for treasury and investment management. In addition to standard technology services related to education,
training and implementation, we offer strategic advisory and managed services for real estate
organizations’ front‐to‐back‐office strategies, processes and technology.
4Management’s Discussion & Analysis
March 31, 2021
Fueled by our ARGUS software solutions, we also provide information services on a global basis through
our Appraisal Management solutions and data subscription products. Our global Appraisal Management
solutions combine data and analytics functionality with a managed service delivery to enable institutional
real estate investors to perform quarterly performance reviews, benchmarking and attribution analysis of
their portfolios. Through these offerings we provide an end‐to‐end valuation management solution for our
institutional clients, providing independent oversight and expertise while leveraging our data analytics
platform. We primarily offer Appraisal Management solutions in the U.S., and we are expanding into
Europe and Asia Pacific. Our Appraisal Management clients primarily consist of open and closed real estate
funds, including large pension funds. Altus Analytics also includes data analytics products that are sold
on a subscription basis. Our Altus Data Studio provides comprehensive real estate information on the
Canadian residential, office, industrial and investment markets with unique data visualization capabilities.
Our Canadian data covers new homes, investment transactions and commercial market inventory in key
markets, and provides intelligence on the national housing market and consumer home buying and
borrowing patterns.
Prior to 2020, the majority of our customers had licensed our AE software products on an on‐premise basis,
and had either paid on perpetual terms with ongoing maintenance, or on subscription terms. As of the start
of 2020, our Altus Analytics software products have been sold only on a subscription‐based model and
increasingly as cloud solutions. Our software subscription agreements vary in length between one to five
years, and the subscription fee depends primarily on the number of users and the applications deployed.
We enjoy industry leading retention rates for our AE software. In addition to software subscriptions, our
software services are charged primarily on a time and materials basis, billed and recognized monthly as
delivered. The contractual terms of our Appraisal Management agreements are generally for three years
and pricing is primarily based on the number of real estate assets on our platform, adjusted for frequency
of valuations and complexity of asset class. We enjoy very high contract renewal rates. Our Appraisal
Management teams are also engaged from time to time to perform due diligence assignments in connection
with CRE transactions. Our data products are sold on a subscription basis.
Commercial Real Estate Consulting
Our CRE Consulting segment consists of the Property Tax, and the Valuation and Cost Advisory business
units. Through our various practice areas, we are well‐equipped to serve clients with an end‐to‐end
solution that spans the life cycle of CRE assets ‐ from feasibility, development, acquisition, management
and disposition. Our professionals possess extensive industry, market and asset‐specific knowledge that
contribute to our proprietary internal databases that help drive successful client outcomes. We have long‐
standing relationships with leading CRE market participants ‐ including owner operators, developers,
financial institutions, and various CRE asset holders and investors.
Our largest revenue contributor to CRE Consulting is our Property Tax business which operates in Canada,
the U.S. and the U.K. Our team of Property Tax professionals help clients minimize the tax burden and
reduce the cost of compliance. Our core real estate property tax services include assessment reviews,
management and appeals, as well as in the U.S., personal property and state and local tax advisory services.
The majority of our Property Tax revenues are derived on a contingency basis, representing a percentage
of the savings we achieve for our clients. As such, we recognize contingency revenues when settlements
are made, which in some cases could span multiple years. A smaller portion of our fees are based on a time
and materials basis. Valuation services, which are predominantly provided in Canada, consist of appraisals
of real estate portfolios, valuation of properties for transactional purposes, due diligence and litigation and
5Management’s Discussion & Analysis
March 31, 2021
economic consulting. Our Cost Advisory practice, offered in both the private and public sectors in Canada
and Asia Pacific, provides expert services in the areas of construction feasibility studies, budgeting, cost
and loan monitoring and project management. Pricing for our Valuation and Cost Advisory services is
primarily based on a fixed fee or time and materials basis. Given the strength of our brand, our
independence and quality of our work, we enjoy a high rate of client renewals across all of our CRE
Consulting businesses.
Strategy
Commercial real estate continues to see a steady rise in investment allocation by global institutions,
solidifying it as an important and well‐defined asset class. Higher volumes of cross‐border transactions
and institutional capital flows are adding new complexity and pressure on top of increasing risk and
regulatory demands. To better cope, the CRE industry is rapidly re‐examining their digital strategies and
demanding more sophisticated processes and data to drive returns. Customers are increasingly looking for
interoperability across software applications, data and workflows in a manner that drives real‐time
business insights. In addition, investors, regulators and the broader CRE community are demanding
greater transparency on worldwide asset and portfolio performance, valuations, risk and Environmental,
Social, and Governance (“ESG”) compliance, and are increasingly relying on independent expert service
providers in this pursuit.
With a global footprint, a prominent customer base, and through our Altus Analytics solutions, Property
Tax and other CRE technology‐enabled offerings, Altus Group is uniquely positioned to capitalize on the
opportunities presented by these trends and to drive significant value for the industry. We are at the
forefront of innovation in our industry and are well equipped to help our clients navigate the complexities
of the CRE market to make better informed decisions and maximize the value of their real estate assets and
investments.
Our vision is to be the leader for the valuation and management of risk for real estate assets by enhancing
the decision making across the value chain through the use of technology, data, analytics and services.
Over the past several years, we have positioned ourselves as a leading CRE technology and technology‐
enabled services provider through our investments in cloud technology, the integration of our software
technology stack, the expansion of our products and services into Europe and the Asia Pacific region, and
the digitization of our Property Tax and other service lines. We have also initiated the transition of our
Altus Analytics business to a predominately recurring revenue model by moving from on‐premise
software sales, sold on perpetual and subscription terms, to cloud SaaS products.
Our next phase of growth involves driving deeper penetration across the CRE value chain by accelerating
cloud adoption, creating greater interoperability of customers’ embedded software and data applications,
providing new and adjacent data and software solutions, and further integrating our existing product and
service offerings to provide end‐to‐end data‐driven insights.
6Management’s Discussion & Analysis
March 31, 2021
Strategic Priorities
Our 2021 strategic priorities consist of:
Accelerating the global adoption of ARGUS Cloud and increasing the proliferation of our
applications across clients’ workflows and the CRE value chain;
Expanding into the CRE debt markets through a combination of organic and acquisitive initiatives;
Expanding our data capabilities and developing new areas of opportunities;
Continuing to build market leadership in Property Tax; and
Enhancing our go‐to‐market strategies across the Company.
Our top priority is accelerating global adoption of ARGUS Cloud. We remain focused on establishing
ARGUS Cloud as the foundational enterprise platform for global CRE asset and investment management,
which in the long run we envision will leverage data and predictive data analytics to deliver real‐time
business insights. In support of this vision, we continue our transition from high‐value point solutions to a
more ubiquitous model that unifies our valuation and asset management capabilities on to a single, cloud‐
based platform that integrates numerous key workflows and enhances data‐driven insights for the CRE
industry. In order to drive faster adoption, we are focused on creating a much deeper differentiation in the
value proposition between our cloud and on‐premise products. Future version releases will see greater
functionality developed exclusively on ARGUS Cloud, including additional application programming
interfaces (“APIs”) and interoperability that facilitates enhanced workflows and collaboration.
Our early foray into the CRE debt markets validates that there is a significant opportunity for us in this
market adjacency. Although we currently provide valuation and risk management solutions to some clients
in the debt space, deeper capabilities are required to fully address this growing market segment. Our
customers and the industry would derive significant value and be better equipped to manage risk
performance from a fulsome 360‐degree view of their assets that combines equity and debt considerations.
The April 1, 2021 acquisition of Finance Active, a European provider of debt management SaaS solutions
for treasury and investment management, is an important step to accelerate our growth in the CRE debt
market. It provides us with the immediate benefit of approaching a much larger client segment while
expanding our reach across use cases and workflows. In addition, Finance Active provides us with greater
cross‐sell opportunities and a strengthened footprint in Europe that we plan to leverage to further our
international expansion. As part of our product roadmap, we plan to integrate Finance Active’s debt
management SaaS solutions with our ARGUS Cloud platform.
A key company‐wide initiative in 2021 is to expand our data capabilities and develop new opportunities.
The market for real‐time insights from data presents a substantial opportunity. Typical industry data is
complex, voluminous, and unstructured. The data that is collected and generated by our various cloud
solution products and by our Appraisal Management, Property Tax, and Valuations and Cost Advisory
businesses is specific, timely and precise. Our opportunity lies in the ability to provide our clients with data
architecture and data model solutions, enabled by ARGUS Cloud, allowing clients to aggregate data
sourced from internal systems, Altus data and potentially other third‐party data providers. Such a data
platform with predictive analytics and alert capabilities would enable both equity and debt stakeholders
to drive investment performance and manage risk. In support of this opportunity, we have formed a
dedicated team and initiated internal workstreams to establish market use cases, feasibility studies and a
technology roadmap. The May 4, 2021 acquisition of certain assets of StratoDem Analytics (“StratoDem
7Management’s Discussion & Analysis
March 31, 2021
Analytics”) (as discussed on page 11) is a core component to our long‐term data strategy, bringing valuable
data science technology and talent, and accelerating our speed to market for future data analytics products.
With market leading practices in Canada, the U.K. and the U.S., our Property Tax practice is one of the
largest and fastest growing property tax advisors globally. Our global Property Tax practice continues to
represent an attractive growth opportunity in a consolidating industry, driven by solid market
fundamentals and our strong competitive position. We will continue to invest organically and in tuck‐in
acquisitions of both core tax practices and adjacencies in order to grow our market share. Additionally, we
will further digitize our data and workflows to drive efficiencies, gain incremental insights, and deliver
greater client value. Lastly, we are re‐organizing the tax business under a centralized leadership model
with a global president and chief operating officer, in order to better align our regional tax practices under
a common global model, drive best practices, and accelerate digital transformation. Our strategy is centered
on strengthening this business with technology and data, and in doing so, improving the repeatability and
growth of our revenues and our operating leverage.
Finally, we will align and enhance our go‐to‐market strategies across our businesses. By leveraging
investments we have made in core platforms such as Salesforce, we will re‐tool and scale our sales
organization to better address the market opportunities in North America and Europe. We will evolve our
customer success and drive deeper marketing programs to strengthen business development and sales
initiatives. Our focus on account planning will better position us to identify our clients’ enterprise needs,
enabling us to provide them with an enterprise solution of our various offerings, rather than taking a single
point selling approach. We believe this will drive higher client value and customer satisfaction, which in
turn will result in higher, recurring revenue streams.
8Management’s Discussion & Analysis
March 31, 2021
Financial and Operating Highlights
Selected Financial Information Quarter ended March 31,
In thousands of dollars, except for per share amounts 2021 2020
Revenues $ 137,158 $ 131,256
Canada 37% 37%
U.S. 36% 39%
Europe 22% 18%
Asia Pacific 5% 6%
Adjusted EBITDA $ 17,240 $ 13,248
Adjusted EBITDA margin 12.6% 10.1%
Profit (loss) for the period from continuing operations $ 2,637 $ 1,757
Profit (loss) for the period from discontinued operations $ ‐ $ (5,436)
Profit (loss) for the period $ 2,637 $ (3,679)
Earnings (loss) per share:
Basic
Continuing operations $0.07 $0.04
Discontinued operations $0.00 $(0.14)
Diluted
Continuing operations $0.06 $0.04
Discontinued operations $0.00 $(0.13)
Adjusted $0.34 $0.20
Dividends declared per share $0.15 $0.15
Financial Highlights
Revenues were $137.2 million for the quarter ended March 31, 2021, up 4.5% (6.1% on a constant
currency basis) or $5.9 million from $131.3 million in the same period in 2020. Acquisitions represented
1.8% of the 4.5% revenue growth. We experienced broad based revenue growth across all our
businesses, with the exception of U.S. Property Tax. Altus Analytics grew 4.9% (8.4% on a constant
currency basis), helped by Over Time revenues growing 6.7% (10.2% on a constant currency basis). Our
CRE Consulting segment showed growth of 4.2% (4.6% on a constant currency basis), despite a weaker
performance from U.S. Property Tax due to COVID‐19 related delays.
Adjusted EBITDA was $17.2 million for the quarter ended March 31, 2021, up 30.1% (34.8% on a
constant currency basis) or $4.0 million from $13.2 million in the same period in 2020. Acquisitions
represented 7.7% of the 30.1% Adjusted EBITDA growth. Earnings increased on account of higher
revenues and lower office and other operating costs, partly offset by higher compensation from
headcount additions. Adjusted EBITDA growth and margin improvement was largely owing to
strength in our Altus Analytics, Property Tax, and Valuation businesses.
Profit (loss) from continuing operations for the quarter ended March 31, 2021 was $2.6 million, up
50.1% or $0.8 million from $1.8 million in the same period in 2020. In addition to the items affecting
Adjusted EBITDA as discussed above, profit (loss) from continuing operations for the quarter ended
9Management’s Discussion & Analysis
March 31, 2021
March 31, 2021 increased as a result of lower amortization of some historical acquisition‐related
intangibles, lower interest related to our bank credit facilities, and lower income tax expense, offset by
acquisition and related costs for the April 1, 2021 acquisition of Finance Active and the May 4, 2021
acquisition of StratoDem Analytics.
For the quarter ended March 31, 2021, earnings (loss) per share from continuing operations was $0.07,
basic and $0.06, diluted, as compared to $0.04, basic and diluted, in the same period in 2020.
For the quarter ended March 31, 2021, Adjusted EPS was $0.34, up 70.0% from $0.20 in the same period
in 2020.
We returned $6.2 million to shareholders in the quarter through quarterly dividends of $0.15 per
common share.
As at March 31, 2021, our bank debt was $128.0 million, representing a funded debt to EBITDA leverage
ratio of 1.11 times (compared to 1.09 times as at December 31, 2020), well below our maximum ratio of
4.00 times. As at March 31, 2021, cash and cash equivalents were $69.1 million (compared to $69.6
million as at December 31, 2020).
Operating Highlights
Events After the Reporting Period
Acquisition of Finance Active
On April 1, 2021, we acquired all of the issued and outstanding shares of Finance Active and its subsidiaries
for approximately €106.5 million (approximately $157.7 million), subject to adjustments. On closing, we
paid a total of €89.2 million (approximately $132.1 million) in cash, funded by drawing £76.8 million on our
credit facilities. In addition, we issued 303,177 common shares to the selling shareholders and certain
members of Finance Active’s management team valued at €12.5 million (approximately $18.5 million) from
treasury on the acquisition date. These common shares will be held in escrow and will vest and be released
over three years on each anniversary of the closing date, subject to continued employment by the
management team and compliance with certain terms and conditions. As part of the purchase price, €4.8
million of cash (approximately $7.1 million) is payable in cash over two years after closing, subject to certain
conditions being met. Founded in 2000, Finance Active is a European provider of SaaS debt management
and financial risk management SaaS solutions for treasury and investment management serving public,
corporate and financial institutions. Finance Active is headquartered in Paris, France, with a wide
geographic footprint in Europe including over 3,000 customers ranging from small‐to‐medium businesses
to large, global institutions. Finance Active’s team of approximately 160 professionals will be integrated
with our Altus Analytics business.
The transaction is expected to strengthen our Over Time revenues while providing opportunities for both
acquisitive and organic growth to our 2021 revenues and Adjusted EBITDA. As a market leader, Finance
Active has been steadily growing its topline, generating gross revenue of approximately €25.0 million
(approximately $38.3 million) in 2020. Supported by multi‐year subscription contracts and a mid‐90% gross
retention rate, approximately 90% of Finance Active’s revenues are recurring, consistent with our Over
Time revenue definition. Over the past three years, Adjusted EBITDA margins have been in the 20% range.
10Management’s Discussion & Analysis
March 31, 2021
As required by IFRS, there will be an initial purchase price accounting adjustment on Finance Active’s
deferred revenues which will impact the revenues, Adjusted EBITDA, and Adjusted EBITDA margins in
2021.
Acquisition of StratoDem Analytics
On May 4, 2021, we acquired certain assets of StratoDem Analytics for US$24.4 million (approximately
$29.9 million) in cash and common shares, subject to adjustments. As part of the transaction, we entered
into a non‐compete agreement with members of management of StratoDem Analytics. As consideration for
these assets, we paid cash of US$16.0 million (approximately $19.6 million). In addition, we issued 165,320
common shares to the vendors valued at US$8.4 million (approximately $10.3 million) from treasury. The
common shares will be held in escrow and will vest and be released 50% on the first anniversary and the
remaining 50% equally on the second and third anniversary of the closing date, subject partly to continued
employment and compliance with certain terms and conditions. StratoDem Analytics is an early‐stage
company offering data‐science‐as‐a‐service for the real estate sector. The cloud‐based StratoDem Analytics
platform integrates vast amounts of granular local demographic and economic datasets to generate
predictive models and analytical tools that enable clients to better understand the factors influencing the
market and build more accurate models and forecasts. Through this acquisition, the StratoDem Analytics
platform is a core component to our long‐term data strategy, bringing valuable data science talent and
technology, and accelerating our speed to market for future data analytics products. Based in the U.S.,
StratoDem Analytics’ team will join the Altus Analytics business unit.
11Management’s Discussion & Analysis
March 31, 2021
Discussion of Operations
Quarter Ended March 31, 2021
Quarter ended March 31,
In thousands of dollars 2021 2020
Revenues $ 137,158 $ 131,256
Expenses
Employee compensation 93,220 88,355
Occupancy 1,870 2,071
Office and other operating 23,697 26,882
Depreciation of right‐of‐use assets 2,768 2,872
Depreciation and amortization 6,772 7,717
Acquisition and related transition costs (income) 5,182 (1,176)
Share of (profit) loss of joint venture 389 ‐
Restructuring costs (recovery) (49) (25)
(Gain) loss on investments (188) (125)
Finance costs (income), net ‐ leases 570 660
Finance costs (income), net ‐ other 578 1,507
Profit (loss) from continuing operations before income taxes 2,349 2,518
Income tax expense (recovery) (288) 761
Profit (loss) for the period from continuing operations $ 2,637 $ 1,757
Profit (loss) for the period from discontinued operations ‐ (5,436)
Profit (loss) for the period attributable to shareholders $ 2,637 $ (3,679)
Revenues
Revenues were $137.2 million for the quarter ended March 31, 2021, up 4.5% or $5.9 million from $131.3
million in the same period in 2020. Acquisitions represented 1.7% of the 4.5% revenue growth for the
quarter ended March 31, 2021. Adjusting for the impact of currency, revenues grew by 6.1%. The revenue
growth was driven by Over Time revenue growth in Altus Analytics and broad‐based growth across our
CRE Consulting businesses.
Employee Compensation
Employee compensation was $93.2 million for the quarter ended March 31, 2021, up 5.5% or $4.8 million
from $88.4 million in the same period in 2020. For the quarter ended March 31, 2021, the increase in
compensation was mainly due to headcount additions within Altus Analytics and Property Tax and the
acquisition of Property Tax Assistance Company Inc. (“PTA”) on December 1, 2020. For the quarter ended
March 31, 2021, employee compensation as a percentage of revenues was 68.0%, as compared to 67.3% in
the same period in 2020.
Occupancy
Occupancy represents amounts pertaining to short‐term leases, low‐value assets, and variable lease
payments and was $1.9 million for the quarter ended March 31, 2021, down 9.7% or $0.2 million from $2.1
million in the same period in 2020. For the quarter ended March 31, 2021, the impacts of IFRS 16 decreased
12Management’s Discussion & Analysis
March 31, 2021
occupancy costs by $3.1 million as compared to $3.0 million in the same period in 2020. Without the impact
of IFRS 16, occupancy costs for the quarter ended March 31, 2021 decreased moderately. For the quarter
ended March 31, 2021, occupancy as a percentage of revenues was 1.4%, as compared to 1.6% in the same
period in 2020. Without the impact of IFRS 16, occupancy as a percentage of revenues would have been
3.6% for the quarter ended March 31, 2021, as compared to 3.9% in the same period in 2020.
Office and Other Operating Costs
Office and other operating costs were $23.7 million for the quarter ended March 31, 2021, down 11.8% or
$3.2 million from $26.9 million in the same period in 2020. For the quarter ended March 31, 2021, the
decrease was due to savings on travel, conference related costs and lower subcontractor disbursements,
partly offset by higher professional fees for strategic advisory work. For the quarter ended March 31, 2021,
office and other operating costs as a percentage of revenues were 17.3%, as compared to 20.5% in the same
period in 2020.
Depreciation of Right‐of‐Use Assets
Depreciation of right‐of‐use assets was $2.8 million for the quarter ended March 31, 2021, as compared to
$2.9 million in the same period in 2020. The decrease is primarily due to the expiry of existing leases and a
reduction in space needs.
Depreciation and Amortization
Depreciation and amortization were $6.8 million for the quarter ended March 31, 2021, as compared to $7.7
million in the same period in 2020. The decrease is mainly due to the completion of the amortization period
for some historical acquisition‐related intangibles.
Acquisition and Related Transition Costs (Income)
Acquisition and related transition costs (income) were $5.2 million for the quarter ended March 31, 2021,
as compared to $(1.2) million in the same period in 2020. Costs incurred for the quarter ended March 31,
2021 were related to the April 1, 2021 acquisition of Finance Active and the May 4, 2021 acquisition of
StratoDem Analytics. The income recorded for the quarter ended March 31, 2020 was due to a revaluation
of our acquisition‐related contingent consideration payables on historical acquisitions.
Share of (Profit) Loss of Joint Venture
Share of (profit) loss of joint venture represents our share of the profit/loss in GeoVerra Inc. (“GeoVerra”)
and was $0.4 million for the quarter ended March 31, 2021, as compared to $nil in the same period in 2020
as it was launched on June 27, 2020.
Restructuring Costs (Recovery)
Restructuring costs (recovery) were $nil for the quarter ended March 31, 2021, as compared to $nil in the
same period in 2020.
(Gain) Loss on Investments
(Gain) loss on investments was $(0.2) million for the quarter ended March 31, 2021, as compared to $(0.1)
million in the same period in 2020. The amount represents changes in the fair value of our investments in
partnerships.
13Management’s Discussion & Analysis
March 31, 2021
Finance Costs (Income), Net
Quarter ended March 31,
In thousands of dollars 2021 2020 % Change
Interest on borrowings $ 600 $ 1,325 (54.7%)
Interest on lease liabilities 570 660 (13.6%)
Unwinding of discounts 3 63 (95.2%)
Change in fair value of interest rate swaps ‐ 154 (100.0%)
Finance income (25) (35) (28.6%)
Finance costs (income), net $ 1,148 $ 2,167 (47.0%)
Finance costs (income), net for the quarter ended March 31, 2021 was $1.1 million, down 47.0% or $1.1
million from $2.2 million in the same period in 2020. Our finance costs decreased mainly due to the lower
interest on our bank credit facilities and leases, and the lower change in fair value recognized in relation to
our $65.0 million interest rate swap which was settled in the second quarter of 2020.
Income Tax Expense (Recovery)
Income tax expense (recovery) for the quarter ended March 31, 2021 was $(0.3) million, as compared to $0.8
million in the same period in 2020. A significant amount of our earnings is derived outside of Canada and
as a result a change in the mix of earnings and losses in countries with differing statutory tax rates have
impacted our effective tax rates for the period ended March 31, 2021.
Profit (Loss) from Continuing Operations
Profit (loss) from continuing operations for the quarter ended March 31, 2021 was $2.6 million and $0.07
per share, basic and $0.06 per share, diluted, as compared to $1.8 million and $0.04 per share, basic and
diluted, in the same period in 2020.
Profit (Loss) from Discontinued Operations
Profit (loss) from discontinued operations for the quarter ended March 31, 2021 was $nil and $0.00 per
share, basic and diluted, as compared to $(5.4) million and $(0.14) per share, basic and $(0.13) per share,
diluted, in the same period in 2020. This was due mainly to the contribution of our Geomatics discontinued
operations into the GeoVerra joint venture in the second quarter of 2020.
Profit (Loss)
Profit (loss) for the quarter ended March 31, 2021 was $2.6 million and $0.07 per share, basic and $0.06 per
share, diluted, as compared to $(3.7) million and $(0.09) per share, basic and diluted, in the same period in
2020.
14Management’s Discussion & Analysis
March 31, 2021
Revenues and Adjusted EBITDA by Business Unit
Revenues Quarter ended March 31,
In thousands of dollars 2021 2020 % Change
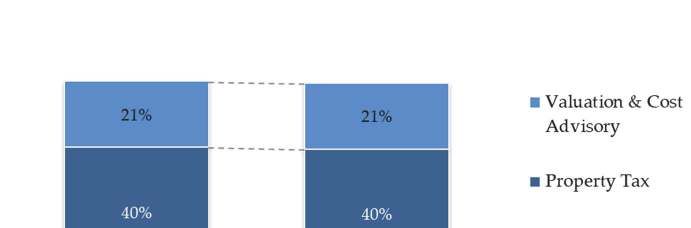
Altus Analytics $ 54,240 $ 51,719 4.9%
Commercial Real Estate Consulting 82,993 79,611 4.2%
Intercompany eliminations (75) (74) (1.4%)
Total $ 137,158 $ 131,256 4.5%
Adjusted EBITDA Quarter ended March 31,
In thousands of dollars 2021 2020 (1) % Change
Altus Analytics $ 10,212 $ 8,289 23.2%
Commercial Real Estate Consulting 15,006 11,742 27.8%
Corporate (7,978) (6,783) (17.6%)
Total $ 17,240 $ 13,248 30.1%
(1) Comparative figures have been restated to reflect accrued variable compensation costs within the respective business units. Refer
to Note 4 of the interim financial statements.
Revenue Contribution:
15Management’s Discussion & Analysis
March 31, 2021
Altus Analytics
Quarter ended March 31,
In thousands of dollars 2021 2020 % Change
Revenues $ 54,240 $ 51,719 4.9%
Adjusted EBITDA (1) $ 10,212 $ 8,289 23.2%
Adjusted EBITDA Margin (1) 18.8% 16.0%
Selected Metrics (2)
Bookings $ 21,299 $ 14,981 42.2%
Over Time revenues $ 42,788 $ 40,083 6.7%
AE software maintenance retention rate 94% 96%
Geographical revenue split
North America 80% 82%
International 20% 18%
Cloud adoption rate (as at end of period) 22% 6%
(1) Comparative figures have been restated to reflect accrued variable compensation costs within the respective business units. Refer
to Note 4 of the interim financial statements.
(2) Refer to pages 3 and 4 of this MD&A for definitions of the Selected Metrics presented above.
Quarterly Discussion
Revenues were $54.2 million for the quarter ended March 31, 2021, up 4.9% or $2.5 million from $51.7
million in the same period in 2020. Adjusting for the impact of currency, revenues for the first quarter grew
8.4%.
Over Time revenues, as described above in the “Overview of the Business” section, were $42.8 million for
the quarter ended March 31, 2021, up 6.7% or $2.7 million from $40.1 million in the same period in 2020.
Adjusting for the impact of currency, first quarter Over Time revenues grew 10.2%. Over Time revenues
increased on higher subscription revenue and robust growth generated by our Appraisal Management
solutions from new clients and additional assets from existing clients.
Bookings in the quarter increased by 42.2% year‐over‐year from $15.0 million to $21.3 million and we
finished the quarter with a growing pipeline of future opportunities. Adjusting for the impact of currency,
Bookings in the quarter increased by 46.1%.
Our transition to AE cloud subscriptions continues to progress at a healthy pace. In the first quarter, we
continued the momentum in migrating existing customers from the on‐premise product and selling cloud‐
enabled AE to new customers. At the end of the first quarter of 2021, 22% of our total AE user base had
been contracted on ARGUS Cloud, compared to 14% at the end of 2020.
Adjusted EBITDA was $10.2 million for the quarter ended March 31, 2021, up 23.2% or $1.9 million from
$8.3 million in the same period in 2020. Adjusted EBITDA improved on higher revenues and improved
operating margins. Adjusting for the impact of currency, Adjusted EBITDA grew by 29.6%.
16Management’s Discussion & Analysis
March 31, 2021
Outlook
Our Altus Analytics business continues to have an attractive growth outlook, supported by favourable
market trends of growing global demand for CRE‐related technology and data solutions. We remain well
positioned to deliver sustained growth over the long term through the execution of our multi‐year strategy.
The successful execution of our annual strategic initiatives is expected to drive sustained year‐over‐year
revenue growth in 2021, particularly double‐digit growth in our Over Time revenues on a constant
currency basis, and a double‐digit year‐over‐year improvement in our Adjusted EBITDA. Taking into
consideration the purchase price accounting adjustment to Finance Active’s deferred revenues, combined
with our investment to accelerate our data strategy (including building out the recently acquired
StratoDem Analytics platform), we expect our full year Adjusted EBITDA margins will be similar to full
year 2020 before they start to increase in 2022.
In 2021, we expect organic growth in our Over Time revenues from higher software subscription license
sales and continued strength from our Appraisal Management and data subscription solutions. Software
subscription license sales should benefit from sustained customer expansion through our dedicated focus
on customer success, and the steady addition of new software clients globally. Having fully shifted to a
subscription model since the start of 2020, in 2021 we will benefit from the full year impact of past
subscription deals given the stacking effect of a subscription model, and the comparative year no longer
including upfront perpetual deals. Consistent with the growth momentum from 2020, our Appraisal
Management practice is expected to benefit from new client additions, customer expansion as more assets
are added on our platform or as new funds are launched, and our ongoing expansion into the European
and Asia Pacific markets. Additionally, our data subscription products continue to be favourably
positioned as new product functionality and new partnership opportunities provide us with additional
prospects for growth. We also expect acquisitive growth in Over Time revenues from our acquisition of
Finance Active and of StratoDem Analytics, as well as enhanced cross‐sell opportunities. As many of our
solutions are considered to be mission critical by our customers, we expect our gross retention rates for AE
(maintenance and subscriptions) will remain in the industry leading mid‐90’s range and that our renewal
rates for our Appraisal Management engagements and data subscription products will remain
exceptionally strong. This will be supported by our revamped customer success programs.
The ongoing COVID‐19 pandemic has both spurred demand for some of our analytics solutions and
challenged certain parts of our software business. The COVID‐19 pandemic continues to mainly impact
our software consulting and training services, however, our transition to a virtual delivery model is
expected to offset some of this impact. To a lesser degree, our software license sales have also been
impacted, primarily related to the volume of software license transactions in the SMB segment, and longer
sales cycles for our larger transactions. However, based on recent trends and some planned changes to our
go‐to‐market strategies, we remain optimistic about improvements for 2021. Our Bookings pipeline is
building and remains robust. Overall, we anticipate a lesser impact as a result of the COVID‐19 pandemic
in 2021 than we experienced in 2020. By and large, demand for our Altus Analytics solutions remains
robust. As the global economy starts to recover from the impacts of the pandemic, activity levels are
expected to rebound as companies worldwide push for more data‐driven visibility on their CRE assets,
endeavor to streamline operations with technology and prioritize cloud‐based solutions.
The migration of on‐premise AE users to cloud‐based subscription contracts is ongoing, and we expect to
make significant progress in 2021. As planned, early adoption continues to be led by SMB firms as they are
much easier to transition and typically have less complex IT infrastructure requirements. Our latest
17Management’s Discussion & Analysis
March 31, 2021
enhancements to cloud‐enabled AE and the integration with APIs are an important catalyst for many larger
firms and we expect a greater volume of our larger customers to begin their migration journey. Our
progress should be reflected in our growing cloud adoption rate and the growth in Over Time revenues.
We continue to expect that the significant majority of our AE users will be migrated to the cloud by the end
of 2023.
Based on current rates, we expect foreign exchange will continue to be a headwind in the second quarter
of 2021. For a comparative view, in the second quarter of 2020, foreign exchange was a tailwind as our
average USD:CAD exchange rate was 1.39.
We remain committed to our aspirational long‐term goal of achieving revenues of $400 million by the end
of 2023. We have multiple paths to accelerate our revenue growth over the next three years, including
driving double digit organic revenue growth and accelerating our expansion into strategic adjacencies in
debt and data analytics through both internal and acquisitive investments.
Commercial Real Estate Consulting
Quarter ended March 31,
In thousands of dollars 2021 2020 % Change
Revenues
Property Tax $ 54,670 $ 52,596 3.9%
Valuation and Cost Advisory 28,323 27,015 4.8%
Revenues $ 82,993 $ 79,611 4.2%
Adjusted EBITDA (1)
Property Tax $ 11,114 $ 9,314 19.3%
Valuation and Cost Advisory 3,892 2,428 60.3%
Adjusted EBITDA $ 15,006 $ 11,742 27.8%
Adjusted EBITDA Margin 18.1% 14.7%
(1) Comparative figures have been restated to reflect accrued variable compensation costs within the respective business units. Refer
to Note 4 of the interim financial statements.
Quarterly Discussion
Revenues were $83.0 million for the quarter ended March 31, 2021, up 4.2% or $3.4 million from $79.6
million in the same period in 2020. The growth in revenues was driven by our Property Tax business and
our Valuation practice. Adjusting for the impact of currency, revenues for the first quarter grew 4.6%.
Our first quarter Property Tax performance demonstrated the resiliency of a geographically diversified
model. We had double‐digit growth in the U.K. and robust performance in Canada, however our U.S.
performance was impacted by COVID‐19 related delays on settlement activity across several jurisdictions.
Revenues from our Valuation and Cost Advisory businesses were up, reflecting higher transaction levels
with our Valuation practice.
18Management’s Discussion & Analysis
March 31, 2021
Adjusted EBITDA was $15.0 million for the quarter ended March 31, 2021, up 27.8% or $3.3 million from
$11.7 million in the same period in 2020. The increase in earnings resulted from higher revenues. Adjusting
for the impact of currency, Adjusted EBITDA for the first quarter grew 28.7%.
Outlook
Our global Property Tax practice is one of the largest and fastest growing property tax advisors and
continues to represent an attractive growth opportunity in a consolidating industry, driven by solid market
fundamentals, our strong competitive position, and resilient demand for our specialized services.
Following our best‐ever performance in 2020, we remain well positioned to deliver another record revenue
year in 2021. Our outlook is supported by a healthy pipeline of cases to be settled, catch up from COVID‐
19 related delays in 2020, and higher annuity billings in the U.K. Given the seasonal and cyclical variations
of the Property Tax business (as discussed in more detail on page 26 of this MD&A), we expect to experience
typical quarterly variability in our financial performance, including the second quarter being our
seasonally strongest quarter. The ongoing COVID‐19 pandemic could potentially impact some of these
typical variations, and cause some short‐term disruption related to the anticipated timing of settlements
(as currently being experienced in the U.S.).
Our Valuation and Cost Advisory practices enjoy significant market share and, as a result, have been
growing modestly. We have enhanced these businesses with the use of technology and expect that to drive
operational efficiencies. Although the COVID‐19 pandemic has had a mild impact on activity levels,
business resumption in key jurisdictions mitigates against further declines. A significant portion of the
Valuation business consists of periodic valuations of CRE portfolios, which are expected to remain stable
or in some cases increase in frequency; however, there are some continued pressures on some of the
transactional services. Our Cost Advisory business depends to a large extent on an active CRE developer
market, which appears to have stabilized. Despite any short‐term disruptions, the long‐term opportunity
associated with this business remains intact as many engagements are multi‐year.
Corporate Costs
Quarterly Discussion
Corporate costs were $8.0 million for the quarter ended March 31, 2021, as compared to $6.8 million
(restated to reflect accrued variable compensation costs within the respective business units) in the same
period in 2020. Corporate costs increased primarily due to higher consulting fees for professional advisory.
Starting in the first quarter of 2021, we accrued and allocated variable compensation costs for the business
units directly on a quarterly basis, versus the former treatment of accruing under the Corporate segment
and reallocating in the fourth quarter. A table detailing the 2020 quarterly results under the new treatment
is posted on our website under the Investor Relations section.
19You can also read