Publications on the use of isotopes for CH4 source attribution in urban / industrial regions
←
→
Page content transcription
If your browser does not render page correctly, please read the page content below
Publications on the use of isotopes for CH4
   source attribution in urban / industrial regions

                                                               Lead author
                                                               David Lowry
                                                               Department of Earth Sciences, Royal Hol-
                                                               loway, University of London

                                                               Egham Hill
                                                               Egham TW20 0EX, United Kingdom

                                                               Telephone: (+44) 1784 443105
                                                               Email: d.lowry@rhul.ac.uk

Deliverable D2.3
Delivery month Annex I       36
Actual delivery month        48
Lead participant: RHUL       Work package: 2              Nature: Report          Dissemination level: PU
Version: 01

               This project has received funding from the European Union’s Horizon 2020 research and innovation
               programme under the Marie Sklodowska-Curie grant agreement No 722479.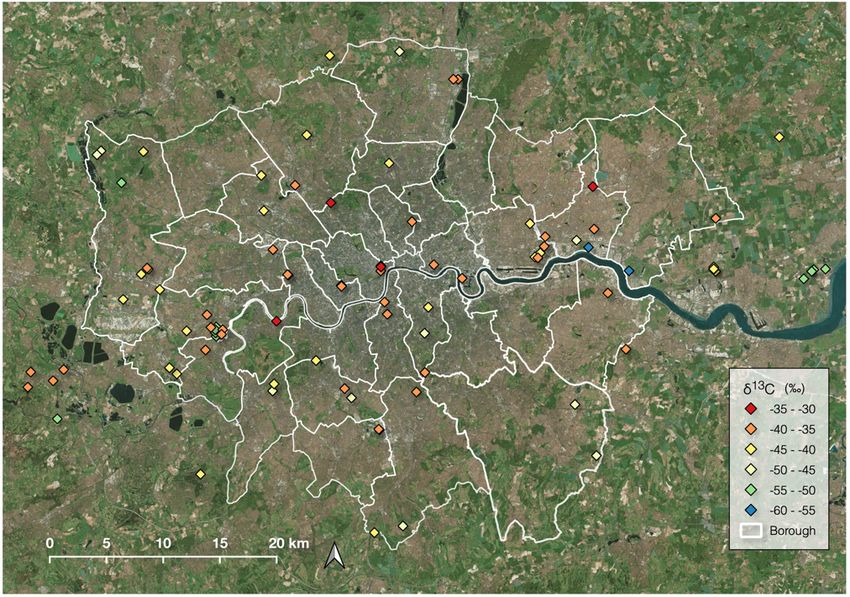
Deliverable 2.3: Deciphering mixed urban and industrial emissions

Table of contents
1. Executive Summary ...................................................................................................................... 3
2. Introduction ................................................................................................................................... 3
        2.1 Background ...................................................................................................................... 3
        2.2 Scope of the deliverable.................................................................................................... 3
3. Content .......................................................................................................................................... 4
4. Conclusion and possible impact.................................................................................................. 7
5. Dissemination & Exploitation ....................................................................................................... 8
6. References .................................................................................................................................... 8

2
Deliverable 2.3: Deciphering mixed urban and industrial emissions

1. Executive Summary
Methane has many anthropogenic sources and in rural areas it is often easy to identify the source of an
emission plume as a farm or a landfill site. In urban areas and industrial complexes there may be multiple
sources within the same 1 x 1 km grid square. Many of these may not be obviously visible, such as
leaks from gas or wastewater pipes. Additionally, emission plumes from these may merge to form single
larger plumes, particularly under atmospheric inversion conditions.
Deliverable 2.3 focused on urban emissions and in conjunction with UN CCAC (United nations Climate
and Clean Air Coalition) projects has facilitated detailed city surveys in many of the partner countries.
These included London, Birmingham and Swansea in the UK, Utrecht in Holland, Hamburg and Heidel-
berg in Germany, Paris in France, and through the UN CCAC ROMEO project, Bucharest in Romania.
These surveys were performed as part of WP1, but when major source emission plumes were encoun-
tered the air was sampled for subsequent isotopic analysis at the laboratories of IMAU, Utrecht and
RHUL, Egham. Newly available isotopic CRDS (laser-based) instruments were used in the mobile cam-
paigns in Paris and Heidelberg, and in addition samples were collected for laboratory analysis to cali-
brate the CRDS measurements.
These isotopic measurements are an integral part of publications about the city surveys. A paper on
Utrecht and Hamburg is already published, one on Paris has been reviewed, one on Krakow is submit-
ted, one on Bucharest will be submitted soon, and others on London and Heidelberg are in preparation.
Surveys in Hamburg, London, Paris and Utrecht suggest that 60-90% of the fugitive methane emissions
are from leaking natural gas infrastructure, with the remainder from waste sources. The Bucharest sur-
vey suggests that up to 60% of the emissions could come from wastewater pipelines, with the remainder
from gas infrastructure.

2. Introduction
2.1 Background
Methane has many anthropogenic sources and in rural areas it is often easy to identify the source of an
emission plume as a farm or a landfill site. In urban and industrial complexes there may be multiple
sources in small areas. Many of these may not be obviously visible, such as leaks from gas or
wastewater pipes. Additionally, emission plumes from these may merge to form single larger plumes,
particularly under atmospheric inversion conditions. Isotopes provide a good way to distinguish between
different sources of methane. In some environments the ratio of 13C/12C (δ13C) provides the best dis-
crimination, in others it is the 2H/1H (δD) ratio. Where possible measurement of both of these ratios on
each sample is carried out.

2.2 Scope of the deliverable
As part of the MEMO2 project the two participating laboratories at UU and RHUL can measure the car-
bon isotopes of methane (δ13C) to high precision (better than ±0.1 ‰) by isotope-ratio mass spectrom-
etry. UU measures (δD) also, to precision of better than ±2 ‰). RHUL is currently setting up a procedure
to measure δD and has preliminary data for a small number of UK sources. Student secondments at
UU resulted in selected δD measurements for most of the city campaigns. All methane plumes that were
sampled and analyzed by both groups and those supplied by other groups in the project were provided
to the project database (D2.2) and subsequently used to characterize individual sources and source
categories. The data has been evaluated for many European cities and forms part of many papers,
some already published or in press and others in the process of being written.

                                                                                                        3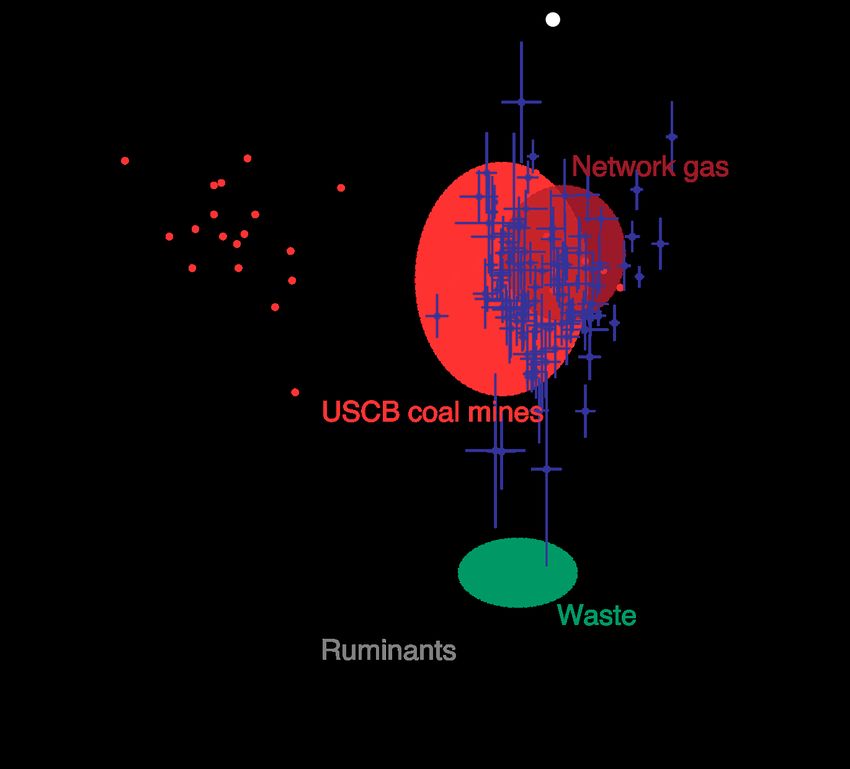
Deliverable 2.3: Deciphering mixed urban and industrial emissions

3. Content
This task has been significantly aided by additional funding from UN CCAC to study fossil fuel
infrastructure emissions in cities, and using ethane and isotopic proxies can distinguish fossil fuel and
combustion sources from biogenic sources during mobile surveys. Isotopic measurements to back-up
mobile methane mapping have been completed for the following cities: Hamburg (ESR10, aided by
ESR8 and ESR9; Fig. 1), Bucharest (ESR9 and ESR10 aided by ESR8; Figs. 2, 3), London (Figs. 4, 5),
Birmingham and Swansea (ESR9 aided by ESR7), Paris (ESR5 and aided by ESR9; Fig. 7), Heidelberg
(ESR1) and Katowice (ESR3), with additional work in the Groningen and Alkmaar regions of NL.
Continuous isotopic measurements for Krakow were made for 6 months (ESR8) and these contribute
additionally to D2.4. The Deliverable 2.3, originally scheduled for Month 36, was delayed partly by the
additional requirement of the ROMEO project to conduct surveys in Romania, and latterly by Covid-19
lockdown restrictions impacting on final surveys and subsequent data processing.
The first of these studies has now been published. Maazallahi et al. (2020) used δ13C and δD source
signatures in combination with C2:C1 ratios (ethane:methane), for plumes encountered and measured
during mobile surveys of Hamburg, to distinguish dominant gas leaks from combustion sources and
biogenic sources such as wastewater treatment, landfill and farms. Biogenic sources are generally
depleted in carbon 13 and deuterium, and have very low C2:C1 ratios compared to thermogenic (fossil)
and pyrogenic (combustion) sources.

 Fig. 1: Results from the attribution measurements in Hamburg: C2 : C1 ratios and isotopic signatures (δ13C and δD) of collected
 air samples; measurement uncertainty in δ13C is 0.05 ‰ – 0.1 ‰ and in δD 2 ‰ – 5 ‰ (Maazallahi et al., 2020).

4

Deliverable 2.3: Deciphering mixed urban and industrial emissions
Fig: 2: Isotopic source signatures of CH4 enhancements in
Romanian cities. Comparison between 11 known and 55
unknown (purple diamond) source signatures. Known δ13C
source signature ranges: gas -59.7 to -43.7 ‰ (yellow &
orange, n=5), landfill -58.5 to 57.8 ‰ (green triangle, n=2),
and wastewater is -49.9 ‰ (circle). Known δ2H source signa- Fig. 3: Romanian city source signature population distribution
ture ranges: gas -270.1 to -165.9 ‰, landfill -288.1 to -280.3 (δ13C and δ2H-CH4). There is a normal distribution of δ13C
‰, and wastewater is -335.0 ‰. Points overlay bacterial and signatures (top) ranging from -64.8 to -36.5 ‰. δ2H source
thermogenic classifications from Whiticar (1990). signatures (bottom) show a bimodal distribution ranging from -
388.1 to -157.3 ‰.
The same proxies to separate source categories are being used in Bucharest and London. In Bucharest
the δ13C signatures were not able to separate plumes from the gas distribution network from those
coming from the wastewater pipe ventilation, but δD and C2:C1 ratios are able to distinguish between
them, and give very close
agreement when considering the
proportion of these two dominant
source categories for the city.
These suggest between 56 and
59% biogenic (wastewater
sources) and 37 to 44%
thermogenic (fossil fuel) sources.
The sources of the United
Kingdom can be distinguished
using δ13C because the natural
gas supply is significantly
enriched in 13C compared to
biogenic sources. This will be
confirmed with ongoing C2:C1
ratio analysis. During 30 days of
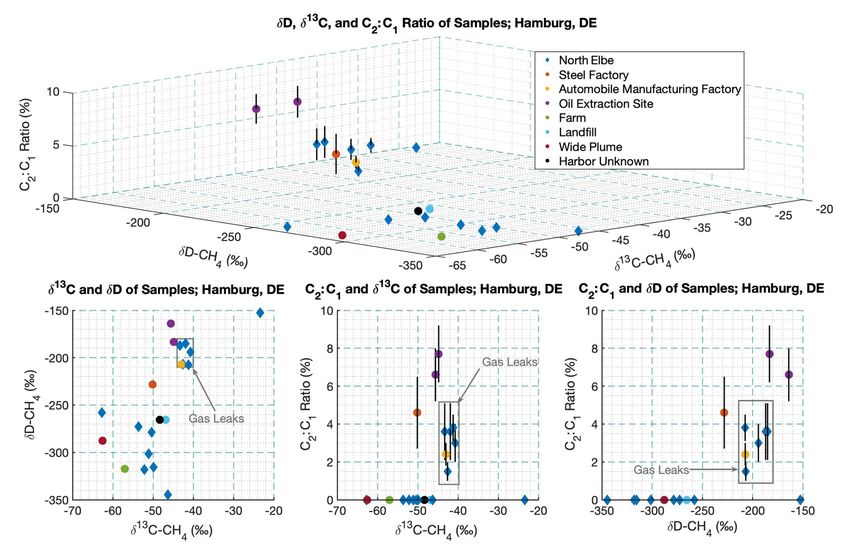
London surveys a total of 72 Fig. 4: Map of the calculated d13C isotopic signatures for Greater London. The red,
plumes were sampled for isotopic orange and yellow points represent fugitive emissions from the gas distribution
analysis (Fig. 4). system. The generally more peripheral green symbols are waste sources.
5
Deliverable 2.3: Deciphering mixed urban and industrial emissions

Of these 75% were considered to be leaks from natural gas pipelines and other gas infrastructure based
on δ13C signatures of -39.5 ± 2.5 ‰ and recorded ethane peaks. The other 25% were biogenic plumes
from landfill sites (-60 to -54‰) and wastewater / manure sites (-56 to -49‰) in the peripheral regions
of the city (Fig. 5).

 Fig. 5: Histograms of the calculated isotopic signatures for Greater London. The red, orange and yellow points represent
 fugitive emissions from the gas distribution system. The generally more peripheral green symbols are waste sources. The right-
 hand histogram selects just the gas leaks with a mean d13C signature of -40 ‰. For improved precision of the source calculation
 only plume samples with >200 ppb excess CH4 over background are used.

Continuous mmeasurements of CH4 mole fraction, d13C and dD in CH4 in ambient air were performed
over 6 months in 2018 and 2019 in the Polish city of Krakow. Isotopic source signatures of local sources
were obtained from mobile campaigns around the urban area and in the coal mining region of Silesia,
west of the city. They were compared with the signatures from each peak in the time series (Fig. 6).
                                                                      The use of dD was crucial to distinguish the
                                                                      fossil fuel emissions because, like Bucharest,
                                                                      their relatively depleted d13C values overlap with
                                                                      the ones of microbial sources. The peak source
                                                                      signatures suggest fossil fuel related emissions
                                                                      as a major source, with d13C between -55.3 and
                                                                      -39.4 ‰ V-PDB, and dD between -285 and -124
                                                                      ‰ V-SMOW (Fig. 6). They confirm the influence
                                                                      of Silesian coal mines when the wind is from the
                                                                      west, and of natural gas leaks from the network
                                                                      as a local source advected by low wind speed.
                                                                      The comparison with modelled time series
                                                                      allowed identification of the use of fuel in
                                                                      residential heating and energy production as a
                                                                      greater contributor of local urban emissions than
                                                                      waste sources.
 Fig. 6: Dual isotope plots of the resulting source signatures from   The MEMO2 project has also facilitated the
 the CH4 peaks identified in the time series. Dark blue: source
                                                                      calibration and quality control assessment of
 signatures with their associated 1s uncertainties. Coloured
 areas: ranges of source signatures obtained from the collected
                                                                      new Picarro CRDS isotopic analysers that use
 samples. Red dots: source signatures of USCB coal gas derived        lasers rather than IRMS. While IRMS data is
 from the literature. The combustion source signature is from         more precise and so allows source
 coal waste burning samples reported in Menoud et al., 2020.          characterisation with far greater accuracy, there

6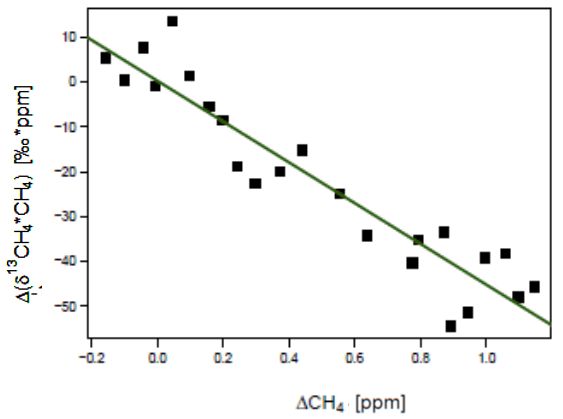
Deliverable 2.3: Deciphering mixed urban and industrial emissions

are methods being developed to reduce these differences, so that in field, corrected δ13C measurements
of a quality that will distinguish combustion, fossil fuel and biogenic sources, can be obtained in less
than 30 minutes. These instruments have been used in the Paris city surveys and calibrated with co-
located bag sampling for IRMS analysis (Defratyka et al., under review).
This has been used to characterise gas compressor stations (Fig. 7), using AirCore to trap air when
crossing a plume and then replay air through the instrument to get a more precise isotopic measurement.
Similar techniques have been developed in Germany (Hoheisel et al., 2019) and used for Heidelberg
surveys.

 Fig. 7: Left: Example of a Miller-Tans plot for an AirCore sample taken from compressor A, identifying the source d13C signature
 as -45.5 ±3.6 ‰. Right: d13C comparison between CRDS and IRMS measurement techniques for 3 gas compressors in the Ile-
 de-France around Paris, surveyed between January 2019 and March 2020.

The paper for Hamburg (Maazallahi et al., 2020) has been published (see Section 6). The paper for
Paris has been reviewed (Defratyka et al., 2021). The paper for Krakow is submitted (Menoud et al.,
submitted). The second draft of the Bucharest paper is out for author comment (Fernandez et al., in
prep) and the London paper is partly written ahead of the final C2:C1 ratio analysis component
(Fernandez et al., in prep). Other papers published by the MEMO2 participating groups, during the
MEMO2 project period, that contain isotopic signatures of methane in urban areas of Europe, are Zazzeri
et al. (2017; London), Hoheisel et al. (2019; Heidelberg) and Xueref-Remy et al. (2020; Paris). A review
of urban isotopic signatures in Europe will follow the current crop of papers.

4. Conclusion and possible impact
Mobile surveys of cities alone cannot provide the source attribution that is necessary for comparison
with published emissions inventories for these cities. Many of the earlier mobile surveys, mostly for cities
in the USA, made the presumption that these were from gas leaks if the plumes were
Deliverable 2.3: Deciphering mixed urban and industrial emissions

gas infrastructure. Use of such proxies can assist in reporting of significant fugitive emission peaks to
the appropriate operator. Furthermore, an understanding of urban and industrial source isotopic signa-
tures compared to rural signatures will aid in the understanding of spatial distribution of emissions in
comparison to National Inventory distribution, assisting in targeted source experiments ahead of inven-
tory refinement.

5. Dissemination & Exploitation
This report will be available via the MEMO2 website to all project partners. The component isotopic
dataset contains all of the measurements made on samples collected in urban and industrial areas, and
can be used to geographically sort and select data. This has been submitted to the ICOS database and
is published online (Menoud et al., 2020).

6. References
Defratyka, S.M., Paris, J.D., Yver-Kwok, C., Fernandez, J.M., Korben, P., Bousquet, P., Mapping ur-
   ban methane sources in Paris, France. Environ. Sci. Technol. (under review).
Hoheisel, A., Yeman, C., Dinger, F., Eckhardt, H., Schmidt, M., 2019. An improved method for mobile
   characterisation of delta (CH4)-C-13 source signatures and its application in Germany. Atmos. Meas.
   Tech. 12, 1123–1139. https://doi.org/10.5194/amt-12-1123-2019
Maazallahi, H., Fernandez, J.M., Menoud, M., Zavala-Araiza, D., Weller, Z.D., Schwietzke, S., von
   Fischer, J.C., van der Gon, H.D., Röckmann, T., 2020. Methane mapping, emission quantification
   and attribution in two European cities : Utrecht (NL) and Hamburg (DE). Atmos. Chem. Phys., 20,
   14717–14740, https://doi.org/10.5194/acp-20-14717-2020
Menoud, M., Röckmann, T., Fernandez, J., Bakkaloglu, S., Lowry, D., Korben, P., Schmidt, M.,
   Stanisavljevic, M., Necki, J., Defratyka, S., Kwok, C. Y. 2020. Mamenoud/MEMO2_isotopes: v8.1
   complete. https://doi.org/10.5281/zenodo.4062356 (Accessed on November 2020).
Whiticar, M.J., 1990. A geochemial perspective of natural gas and atmospheric methane. Org.
   Geochem. 16, 531–547. https://doi.org/10.1016/0146-6380(90)90068-B.
Xueref-Remy, I., Zazzeri, G., Bréon, F.M., Vogel, F., Ciais, P., Lowry, D., Nisbet, E.G., 2020.
   Anthropogenic methane plume detection from point sources in the Paris megacity area and
   characterization     of     their    δ13C     signature.      Atmos.    Environ.     222,     117055.
   https://doi.org/10.1016/j.atmosenv.2019.117055
Zazzeri, G., Lowry, D., Fisher, R.E., France, J.L., Lanoisellé, M., Grimmond, C.S.B., Nisbet, E.G., 2017.
   Evaluating methane inventories by isotopic analysis in the London region. Sci. Rep. 7, 1–13.
   https://doi.org/10.1038/s41598-017-04802-6

8
You can also read