Projection of Healthcare Demand in Germany and Switzerland Urged by Omicron Wave (January-March 2022)
←
→
Page content transcription
If your browser does not render page correctly, please read the page content below
Projection of Healthcare Demand in Germany and
           Switzerland Urged by Omicron Wave
                   (January-March 2022)
                  Hossein Gorji,1∗ Noé Stauffer,1 Ivan Lunati,1
                Alexa Caduff,2 Martin Bühler,2 Doortje Engel,2
          Ho Ryun Chung,3 Orestis Loukas,3 Sabine Feig,4 Harald Renz,4

1
    Laboratory of Multiscale Studies in Building Physics, Empa, Dübendorf, Switzerland
          2
              Department of Justice, Security and Health, Canton Grisons, Switzerland
                         3
                           Institute of Bioinformatics and Biostatistics,
                        Philipps University Marburg, Marburg, Germany
     4
         Institute of Laboratory Medicine and Pathobiochemistry Molecular Diagnostics,
                    Philipps University Marburg, Marburg, Germany
    ∗
      To whom correspondence should be addressed; mohammadhossein.gorji@empa.ch.

                                             Abstract
             After the implementation of broad vaccination programs, there is an urgent need
         to understand how the population immunity affects the dynamics of the COVID-19
         pandemic in presence of the protection waning and of the emergence of new vari-
         ants of concern. In the current Omicron wave that is propagating across Europe,
         assessing the risk of saturation of the healthcare systems is crucial for pandemic
         management, as it allows us to support the transition towards the endemic course
         of SARS-CoV-2 and implement more refined mitigation strategies that shield the
         most vulnerable groups and protect the healthcare systems. We investigated the
         current pandemic dynamics by means of compartmental models that describe the
         age-stratified social-mixing, and consider vaccination status, vaccine types, and
         their waning efficacy. Our goal is to provide insight into the plausible scenarios
         that are likely to be seen in Switzerland and Germany in the coming weeks and
         help take informed decisions. Despite the huge numbers of new positive cases, our
         results suggest that the current wave is unlikely to create an overwhelming health-
         care demand: owing to the lower hospitalization rate of the novel variant and the
         effectiveness of the vaccines. Our findings are robust with respect to the plausible
         variability of the main parameters that govern the severity and the progression of
         the Omicron infection. In a broader context, our framework can be applied also
         to future endemic scenarios, offering quantitative support for refined public health
         interventions in response to recurring COVID-19 waves.

                                                  1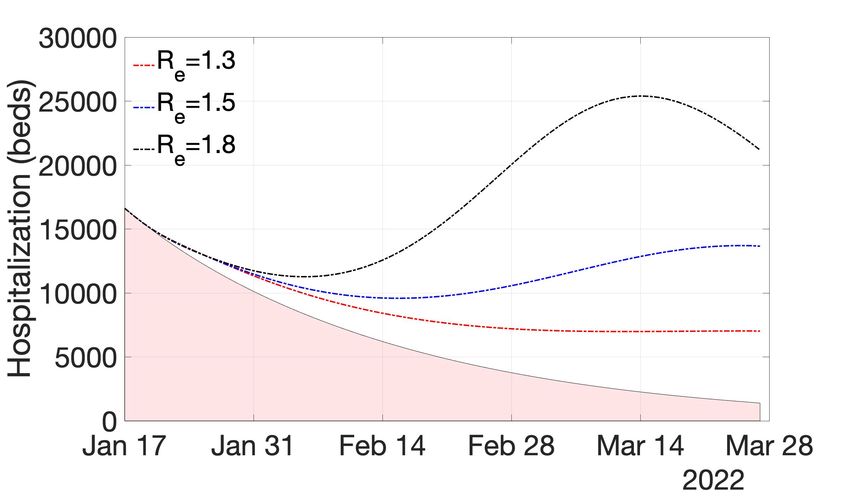
Introduction

As the Omicron variant-of-concern (B.1.1.529) surge is unfolding in Europe, it is crucial
to analyze possible scenarios likely to be seen in the next couple of weeks. In the current
pandemic phase, it is of great importance to investigate whether the surge in the case

number would translate into a significant wave of hospitalizations, possibly threatening
the healthcare system. While the current decoupling between case number and hospi-
talizations observed in the UK gives reasons for optimism, the evolution of the current

Omicron wave might be different in countries with a smaller fraction of vaccinated or re-
covered people, or with a different vaccine mix. In particular, central European countries
with lower vaccination rates and relatively less dramatic previous waves might turn out

more vulnerable.

In this report, we use dynamic compartmental models to analyze plausible epidemiolog-

ical scenarios for Switzerland and Germany. Mathematical models are crucial to explain
the non-obvious concurrent large case number and relatively low hospitalization rate that
are observed in the Omicron wave. In order to elucidate the mechanisms leading to the

observed situation and reasonably project the evolution likely to be observed in the up-
coming weeks, our analysis is refined based on the age groups and their social-mixing,
as well as on vaccination status and vaccine type. This allows us to better describe, and

possibly anticipate, the pressure on the healthcare system.

Our results suggest that the current wave, despite generating huge case numbers, is

unlikely to create an overwhelming healthcare demand. Even with the least favorable
estimate of plausible parameters, our scenarios display hospital occupancy lower than
the previously experienced peaks (especially in the intensive-care-unit, ICU). However,

it should be kept in mind that the sheer number of cases might lead to staff shortage, as
well as to insufficient capacity of SARS-CoV-2 diagnostic resources.

Our results can be used to better refine the current measures in the pandemic man-

                                            2
agement of both countries, with a focus on the healthcare demand. Furthermore, our
modeling framework can also help project the endemic course of the unfolding Omicron
wave.
Results
To project the current situation into the coming weeks and investigate the consequences
of the Omicron wave in terms of case number, hospitalization, and ICU bed occupancy in
Switzerland and Germany, we considered three scenarios characterized by different effec-
tive reproductive numbers, i.e., 1.3, 1.5 and 1.8. These scenarios should be contrasted to
the current epidemiological course with an observed reproductive numbers between 1 and
1.2 in both countries at the time of publication. For the base scenario projection, we fed
the compartmental model by central estimates of all involved parameters (listed in Tables
1-8 in the Supplementary Information); then, we conducted a sensitivity analysis with
respect to the severity and the vaccine protection (see Figures 4-11 in the Supplementary
Information) and found that our results are robust as long as the considered parameters
remain in a plausible range.
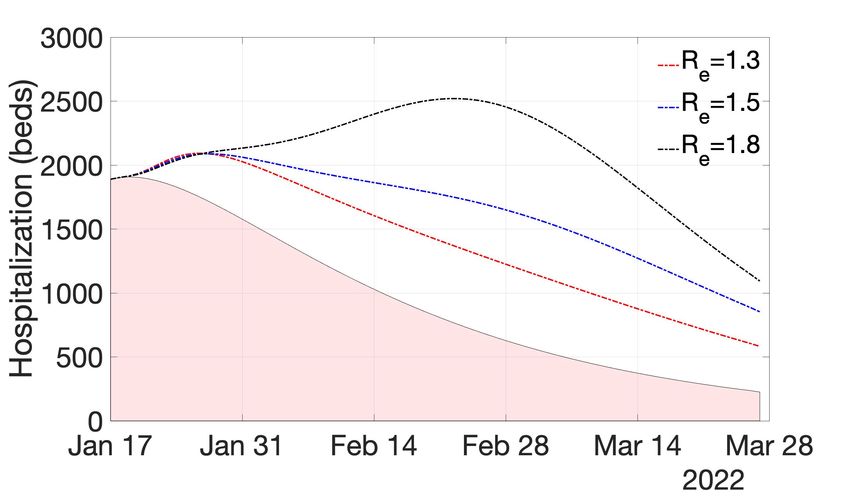
The projection of daily case numbers, hospitalization and intensive care requirement are
shown in Figures 1 and 2 for Switzerland and Germany, respectively. We observe a signifi-
cant increase of the case number in the worst case scenario of Re = 1.8. Our projection of
Germany shows 20% higher case number at the peak in comparison to Switzerland. This
is mainly due to the different heterogeneity of considered contact networks among differ-
ent age-groups of the two countries: in general, more heterogeneous contact patterns, as
observed in Switzerland, yield markedly lower attack rates in epidemics [8]. Besides, we
estimated the average protection offered by the vaccine mix against Omicron infection
to be approximately 0.4 and 0.5 in Germany and Switzerland, respectively. The 20%
difference in the vaccine efficacy is related to the different mix of vaccine types used in
the two countries.
3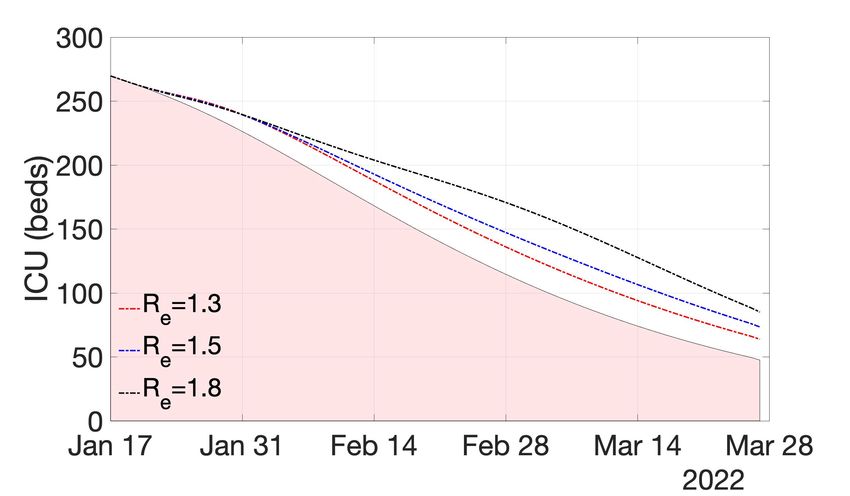
The number of severe cases, and especially those requiring hospitalization in ICUs, remain

at levels lower than the peaks observed during previous waves. This favorable outcome,
despite the huge case number, is due to lower intrinsic severity of Omicron as well as to
the protection from severe course offered by the vaccines (and refreshed by booster shots

in recent months). We estimated the overall efficacy of the vaccine mix administered
in Germany and Switzerland against hospitalization to be approximately 0.6 and 0.65,
respectively.

                (a)                                  (b)                                 (c)
Figure 1: Projection of scenarios in Switzerland for (a) daily incidence (Omicron cases), (b) hospitaliza-
tion (general ward) and (c) ICU occupancy. Three scenarios of Re ∈ {1.3, 1.5, 1.8} are considered for
Omicron, whereas Re of 0.9 is assumed for Delta. The red shaded areas in (b) and (c) account for the
occupancy due to Delta. All scenarios are initialized with an identical incidence rate. This results in an
initially higher number of active cases in a scenario governed by a lower reproductive number.

                (a)                                  (b)                                 (c)
Figure 2: Projection of scenarios in Germany for (a) daily incidence (Omicron cases), (b) hospitalization
(general ward) and (c) ICU occupancy. Three scenarios of Re ∈ {1.3, 1.5, 1.8} are considered for Omicron,
whereas Re of 0.9 is assumed for Delta. The red shaded areas in (b) and (c) account for the occupancy
due to Delta. All scenarios are initialized with an identical incidence rate. This results in an initially
higher number of active cases in a scenario governed by a lower reproductive number.

Discussion

The recent resurgence of COVID-19 in Europe is concurrent to the already heavy health-
care demand imposed by the most recent Delta (B.1.617.2) wave. A careful analysis

of the situation is critical to help secure healthcare resources for anticipated COVID-19
patients. It is likely that the case numbers will still rise sharply as a result of the high

                                                    4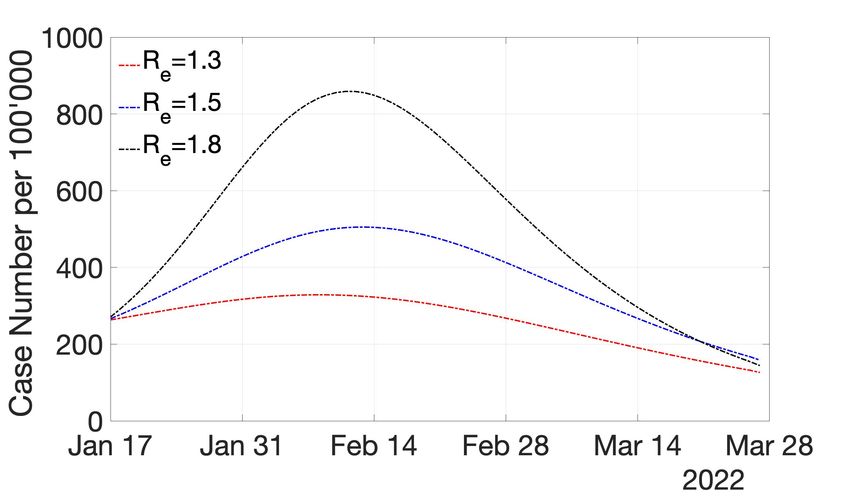
transmissivity of the Omicron variant. At the peak of the least restrictive scenario (i.e.

Re = 1.8), it is expected that 5-10% of the population would be infected in a week. While
by itself this may not translate into a public health crisis, the abrupt increase in infected
individuals can interrupt the presence of work forces, with significant consequences also

on the healthcare system (depending on the applicable quarantine and isolation rules).
Furthermore, it is likely that the testing resources would become inadequate to accom-
modate such a large number of infected individuals, leading to heavy underestimations

of the real case numbers, even among symptomatic patients.

With regard to the healthcare systems, the simulated scenarios allow us to provide several

important messages. (i) The sharp increase in the overall number of infections might also
lead to a high infection rate among medical and nursing staff in hospitals and nursing
homes. (ii) The demand for normal care beds for COVID-19 patients might rise within

a short time period depending on the effective reproductive number. On top of patients
hospitalized due to COVID-19, there will be also an increased number of hospitalized pa-
tients who are treated in the hospital for other reasons but co-infected with SARS-CoV-2.

This will put an additional burden on the hospital systems in both countries. (iii) We
do not expect a significant further increase in ICU patients above the current level. (iv)
The sharp and rapid increase in infected cases will be followed by a likewise sharp and

rapid decline in case numbers, with the exception of prolonged hospitalizations of ICU
patients, which has been observed also during previous waves.

The modeled scenarios suggest that the anticipated number of infections may not lead to
a significant pressure on the healthcare system, neither in Switzerland nor in Germany.

This can be attributed to the intrinsically lower hospitalization rate caused by the novel
variant and by the effectiveness of the vaccines in protecting from a severe course. While
in Germany the vaccination rate is slightly higher, we estimate that the protection is

stronger in Switzerland where a vaccine type with a longer term efficacy has been admin-
istered to the majority of the population. Our model further suggests that, as long as

                                             5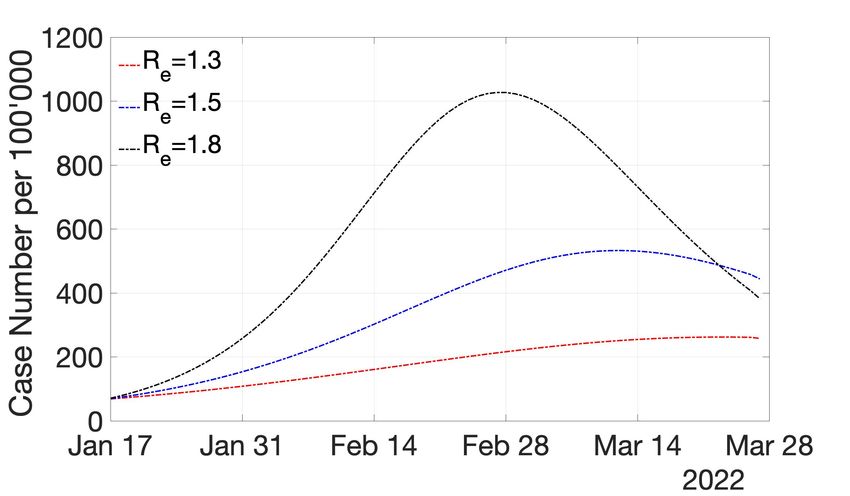
the reproductive number remains below 2, the ICU bed occupancy hardly reaches critical

thresholds (around 400-500 beds for Switzerland and 7’000-8’000 beds for Germany).

When drawing conclusions from the simulated scenarios presented here, it is important to

keep in mind that several factors may limit the validity of the modeling results. Besides
intrinsic limitation of compartmental models, many of the adopted parameters are still
subject to significant uncertainties. Most notably, the severity of Omicron, the protection

offered by the vaccines against this variant and their waning efficacy are far from being
sufficiently studied and well characterized. Here, we did not consider the possibility of
long term effects of the severe/mild Omicron cases, as data is still lacking on Omicron

long-Covid cases. Nevertheless, our findings are in accordance with decoupling between
case number and hospitalization observed in South Africa and UK.

In interpreting this somewhat optimistic results, it should be noticed that even in the
scenario assuming the least stringent measures (Re = 1.8), a certain level of mitigation
measures still needs to be maintained to achieve the corresponding reduction of the in-

fection rate (roughly 20%) with respect to the unmitigated situation. Furthermore to
support the decoupling between the case number and hospitalization, it is necessary to
improve the immunity of the population by expanding the vaccine uptake as well as ac-

celerating the third dose campaigns.

Our modeling framework accounts for different age-groups and their social-mixing, vacci-

nation status, vaccine type and protection waning. This is important as throughout the
COVID-19 pandemic, a strong stratification of hospitalization has been observed with re-

spect to the age-group. Furthermore since the vaccination rate is biased towards elderlies,
it is essential that the model accounts for these heterogeneities . In a broader context,
the provided framework can be applied to investigate endemic scenarios and estimate the

long-term vaccination rates necessary to maintain the overall immunity of the population
at risk during future outbreaks.

                                            6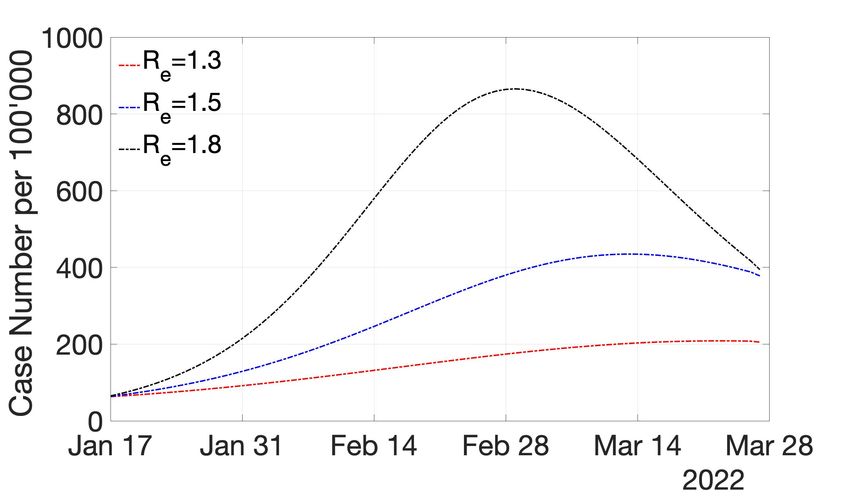
How well the aftermath of the current Omicron wave is representative of an endemic
scenario depends on many factors, including the cross-immunity with respect to the past
variants, as well as the characteristics of possibly emerging future ones. As a result, it

is crucial to reassess the ongoing mitigation measures to support an exit-strategy which
maintains a balance between the disease severity and consequent socio-economical tolls
of the measures, in a more targeted (e.g. age-specific) manner. To address these cru-

cial points, we need more detailed analysis on the impact of measures as well as close
monitoring of the unfolding situation for some time to come.

                                            7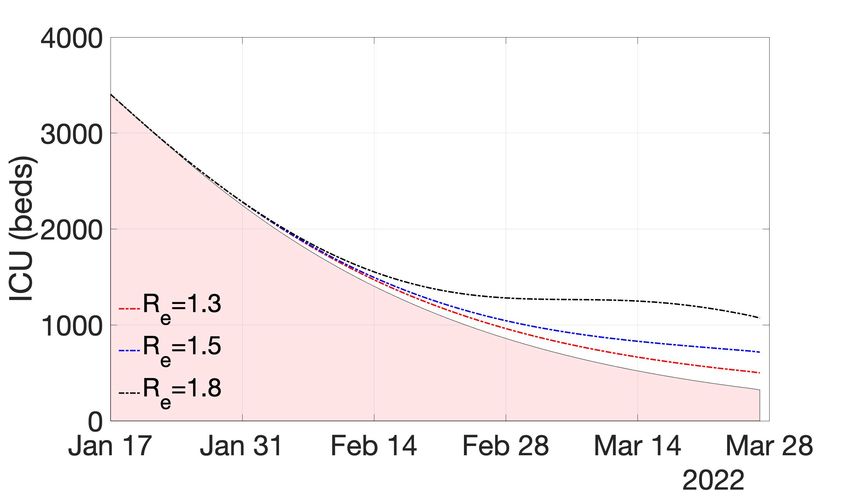
Supplementary Information
Model
Dynamics

We consider a Susceptible-Infected-Removed (SIR) type compartmental model comprised

of susceptible (S), infected (I), hospitalized in general ward (H), hospitalized in ICU (IU )
and removed (R) populations. The progress of infection and further disease development
among these compartments are illustrated in Figure 3. Each compartment is stratified

                    Figure 3: Graphical depiction of the compartmental model

per age-group denoted by superscript i. Furthermore they are refined for vaccinated, un-
vaccinated and recently recovered from a separate variant, as denoted by subscripts v, u
and r, respectively. Note that as the focus here is to project the symptomatic cases and

their healthcare demand, the distinguish between asymptomatic/presymptomatic and
symptomatic cases is ignored. Moreover, we did not consider the mortality as it hardly
has an influence on the epidemic course, which leads to a conservative estimate on the

number of hospitalized and critical cases. Also despite the simplification of omitting the
exposed compartment, we do not expect that the results are affected much due to the
relatively short incubation period of Omicron variant (around 3 days [12]). As a result

of all simplifications and uncertainty of input parameters, the projections made by the
model should be considered as plausible scenarios, instead of accurate predictions of the
future course of pandemic.

The dynamic evolution of each compartment is governed by the transition rates (see

                                               8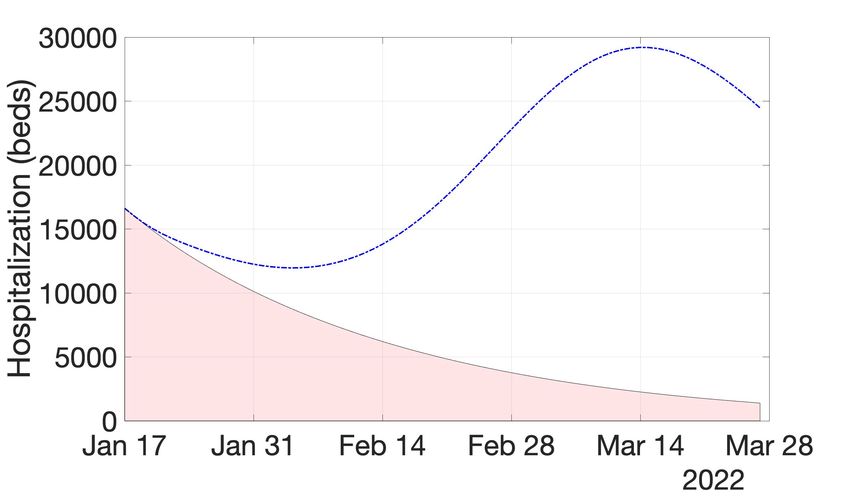
e.g. [6, 4, 10] as examples of compartmental models). Let KA→B be the transition rate

from compartment A to B, therefore we get

             ṠJi = −KSJi →IJi SJi ,                                                    (1)

              I˙Ji = KSJi →IJi SJi − KIJi →HJi IJi − KIJi →RJi IJi ,                    (2)

             ḢJi = KIJi →HJi IJi + KIU iJ →HJi IU iJ − KHJi →RJi + KHJi →IU iJ HJi ,   (3)
            ˙ i = KH i →IU i H i − KIU i →H i IU i
           IU                                            and                            (4)
              J     J      J  J        J   J     J

             ṘJi = KIJi →RJi IJi + KHJi →RJi HJi                                       (5)

for J ∈ {u, v, r}.

The transition rates depend on intrinsic virus properties, population statistics and vaccine

efficacy. Below we review the main parameters that govern the transition rates.

  1. Virus transmission and pathogenesis: In our model, the virus transmission is gov-
      erned by the infection rate β, immunity escape ϵ and recovery rate γ = PR /τR
      where PR is the recovery probability and τR the average recovery time. For severe

      cases, the disease progression follows the hospitalization rate ξ = PH /τH , where
      PH = 1 − PR is the probability of hospitalization and τH the average time that it
      takes from infectiousness to hospitalization. In critical cases the admission to ICU

      leads to the ICU rate µ = PIU /τIU , where PIU is the probability of ICU admis-
      sion (conditional on hospitalization) and τIU the average time that it takes from
      hospitalization to the ICU admission. Patients recovered from hospitals reduce the

      hospitalization by the hospital recovery rate γH = (1 − PIU )/τR|H with τR|H the
      average recovery time for hospitalized cases. Finally critical cases would be back
      to the general ward by the ICU recovery rate γIU = 1/τH|IU , where τH|IU is the

      average time spent in ICU.

  2. Population statistics: The number of people N i in each age-group i, besides the
      contact matrix Cij (average number of people in age-group j in contact with a
      person in age-group i) gives the social-mixing stratified by age-groups. Note that

                                               9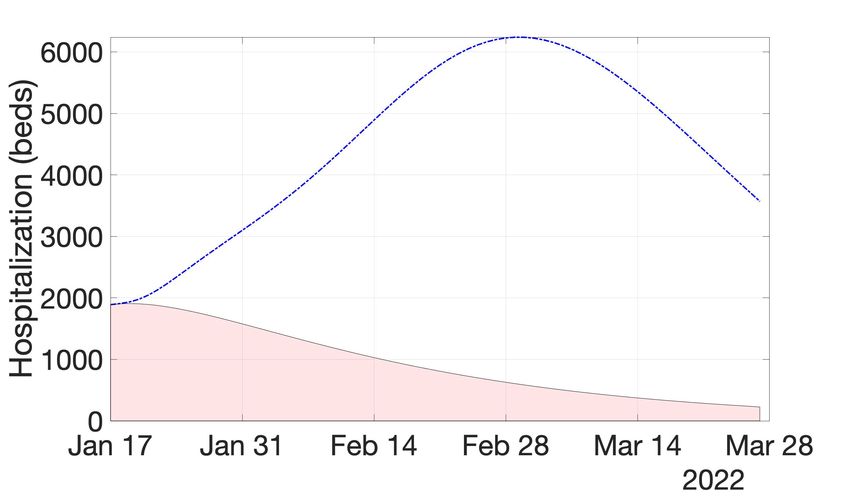
the contact matrix follows the reciprocity constraint

                                             Cij N i = Cji N j .                                 (6)

     To deduce C from contact survey D, we apply
                                                  1         i         j

                                    Cij =             Dij N   + Dji N     .                      (7)
                                                 2N i
                  i
     Furthermore Pv,u,r accounting for fraction of people vaccinated, unvaccinated and

     recently recovered from another variant, respectively, give us the effective immunity
     of the population per each age-group.

  3. Vaccine efficacy: The effectiveness of the vaccines against infection EIi , against hos-
     pitalization (conditional on infection) EHi and against ICU admission (conditional
                          i
     on hospitalization) EIU characterize the impact of vaccination in each age-groups
     on the pandemic course.

Closure

The transition rates are closed based on the above described parameters. The rate of
new infections in age-group i is proportional to their contacts with all age-groups j and
the corresponding prevalence in j (see e.g. [9]). Therefore for new infections we get
                                    X 1                            j j
                                                     j                        j

                   KSui →Iui = β             Cij   Iu   + (1 −   E I )Iv + ϵI r    ,             (8)
                                     j
                                         Nj
                                              X 1                            j j
                                = (1 − EIi )β                   j                         j

                   KSvi →Ivi                             Cij  Iu  +   (1 − E  )I
                                                                             I v     + ϵIr       (9)
                                               j
                                                    Nj
                                     X 1                             j j
                                                       j                        j

             and KSri →Iri      = ϵβ          C ij  I  u + (1 −   E   )I
                                                                     I v  + ϵI  r ,             (10)
                                       j
                                          Nj
where the protection of vaccine is modeled in a symmetric fashion: it reduces both infec-

tiousness and the probability of getting infected by the same efficacy.

Later developments in the case of mild infections follow
                                                     1 − PHi
                                     KIui →Rui =             ,                                  (11)
                                                       τR
                                                     1 − (1 − EHi )PHi
                                     KIvi →Rvi     =                                            (12)
                                                            τR
                                                     1 − ϵPHi
                               and KIri →Rri       =           .                                (13)
                                                        τR

                                                    10
For more severe cases the rates follow
KIui →Hui = ξ i , (14)
KIvi →Hvi = (1 − EHi )ξ i (15)
KIri →Hri = ϵξ i , (16)
i
1 − PIU
KHui →Rui = , (17)
τR|H
i i
1 − (1 − EIU )PIU
KHvi →Rvi = (18)
τR|H
i
1 − ϵPIU
and KHri →Rri = , (19)
τR|H
whereas the critical cases are governed by
KHui →IU iu = µi , (20)
i
KHvi →IU iv = (1 − EIU )µi , (21)
KHri →IU ir = ϵµi (22)
1
and KIU iJ →HJi = . (23)
τH|U
Note that for recovery rates among hospitalized cases (including critical ones), we made a
conservative assumption that there is no difference between unvaccinated, vaccinated and
recently recovered (from separate variant) patients concerning the average time spent in
the hospital (including critical ones). Moreover, we made another conservative assump-
tion that the disease severity of the reinfection cases is proportional to the immunity
escape, similar to the reinfection rate.
Reproductive Numbers
The reproductive number can be found based on the method of next-generation matrix.
To simplify the calculations and since overwhelming majority of cases would recover
without hospitalization, we ignore the severe cases in our estimate of the reproducive
number. Suppose
Ni
Aij = Cij (24)
Nj
11the reproductive number for our system then reads
R0 = ρ(A )β τR , (25)
where ρ() returns the largest eigenvalue (assuming complete susceptible population, in
the absence of vaccinated and recovered ones).
The reproductive number can be reduced by vaccination, recovery and mitigation mea-
sures. Let κ ∈ [0, 1] be the intensity of measures applied uniformly to all n age-groups
(e.g. reducing number of contacts, face masks, home-office and school closures). Let us
define the modified version of A as a normalized next generation matrix subject to the
introduced measures
Tuu Tuv Tur
T = Tvu Tvv Tvr , (26)
Tru Trv Trr
where the subscript IJ accounts for infections exerted by the subgroup J in the subgroup
I. The block matrices TIJ can be found from the rate of new infections
T(uu),ij = Pui Aij , (27)
T(uv),ij = (1 − EIj )Pui Aij , (28)
T(ur),ij = ϵPui Aij , (29)
T(vu),ij = (1 − EIi )Pvi Aij , (30)
T(vv),ij = (1 − EIi )(1 − EIj )Pvi Aij , (31)
T(vr),ij = ϵ(1 − EIi )Pvi Aij , (32)
T(ru),ij = ϵPri Aij , (33)
T(rv),ij = ϵ(1 − EIj )Pri Aij , (34)
and T(rr),ij = ϵ2 Pri Aij . (35)
The matrix T encodes the reduction of R due to vaccination and recovery, which together
with mitigation measures results in
Re = ρ(T )(1 − κ)β τR . (36)
12Parameters
Central Rates
The adopted rates of each variant governing its transmission, disease progression and
healthcare demand are discussed below:
1. Transmission of Delta: The basic reproduction number is estimated around 5 [16].
We take the average infectiousness period (recovery time) to be approximately 8
days, as high infectivity is detected 8 days after symptom onset [11]. The immunity
escape of Delta with respect to Omicron is still unknown and it is absent in our
analysis.
2. Disease progression and healthcare demand of Delta: We consider the disease pro-
gression of Delta to be approximately similar to the ancestral strain, but with
slightly worse severity. The time window from symptom onset to hospitalization
is estimated to be 5 days in average [23]. In the case of ICU requirement, we as-
sume the transfer happens 7 days after hospitalization, consistent with the average
symptom onset to ICU admission estimate of 12 days [27].
The average recovery time of hospitalized cases is taken to be 14 days (11 days
estimated in [27] for the wild type). Further in more severe cases, we assume that
the ICU treatment takes in average 16 days. The adopted hospitalization and ICU
admission probabilities are based on [23, 7, 14].
3. Transmission of Omicron: The Omicron variant is associated with high increase in
the case numbers. However it is still unclear how much of its growth rate is due
to the immunity escape and how much due to intrinsic transmissibility. Suppose
the infection rate of Omicron is by a factor 1 + η larger than Delta. Barnard et al.
[5] suggest η ∈ [−0.1, 0.35]. To estimate the immunity escape ϵ for the suggested
13range of η, let us consider two-variant SIR dynamics [3]
S
I˙w = βw Iw − γw Iw (37)
N
(S + ϵ(1 − S))
I˙v = (1 + η)βw Iv − γv Iv , (38)
N
where subscript w and v represent the quantities corresponding to Delta and Omi-
cron, respectively. For this system, the net growth rate advantage of Omicron
becomes
ρ = (1 + η)βw (S + ϵ(1 − S)) − βw S − γv + γw . (39)
Considering that the growth rate of Omicron has been around 0.24 per day in
Gauteng [24] with 73% immunity [17], we get
ϵ ∈ [0.29, 0.62] (40)
for a recovery time similar to Delta (it is anticipated that the infectiousness period
is not shorter than Delta [18]). Adopting the central estimates, we have η = 0.125
and ϵ = 0.43 for our base scenario (the immunity escape is comparable to the range
provided in [23] for 80% immune population). Note that this increase of infection
rate results in R0 = 5.62 for Omicron.
4. Disease progression and healthcare demand of Omicron: It is generally accepted
that the Omicron variant less often causes severe disease progression. This ac-
counts for both lower hospitalization rate as well as shorter treatments.
We consider recovery time of hospitalized cases to be 1.5 days (central estimate
in [15]). Various reduction of hospitalization rates and ICU requirement have been
estimated [26]. Furthermore [2] suggests average ICU treatment of 4 days. Follow-
ing [25], we consider 56% reduction in hospitalization probability and 67% of ICU
admission across all age-groups. Less optimistic reduction rates are explored in the
sensitivity study.
The adopted estimations are summarized in Tables 1-2 for Delta and Tables 3-4 for
Omicron. Note that while each parameter bears significant uncertainty, we only worked
14with central value estimates for base scenario projections. Sensitivities due to variation
of a few critical rates are explored in the following section.
Transmission
Symbol Description Central Value Reference
R0 reproductive number 5 [16]
τR recovery time (days) 8 infectiousness high up
to 8 days after symptom
onset [11]
ϵ immunity escape negligible -
Table 1: Transmission rates of Delta
Pathogenesis
Symbol Description Age-group Central Value Reference
PH hospitalization proba- ≥ 60 0.13 estimated
bility based on
[23, 7]
40 − 59 0.05
18 − 39 0.02
≤ 17 0.003
PIU ICU probability of hos- ≥ 60 0.2 estimated
pitalized cases based on
[14]
40 − 59 0.11
18 − 39 0.01
≤ 17 0.01
τH infection to hospitaliza- - 5 [23]
tion (days)
τIU hospitalization to ICU - 7 symptom
(days) onset to
ICU ad-
mission 12
days [27]
τR|H recovery time of hospi- - 14 -
talized cases (days)
τH|IU ICU length (days) - 16 -
Table 2: Disease progression and severity of Delta
Vaccine Efficacy
High effectiveness of vaccines against infection and disease progression of COVID-19 has
been clearly demonstrated. However the waning of antibodies, increase of breakthrough
infections and overall decay of the protection offered by a mix of vaccines in a given
15Transmission
Symbol Description Central Value Reference
R0 reproductive number 5.62 Barnard et al. [5] sug-
gests 10% lower to 35%
higher with respect to
Delta
τR recovery time (days) 8 infectiousness period is
unlikely to be shorter
than Delta [18]
ϵ immunity escape 0.43 adjusted to growth rate
0.24 [24] in Gauteng
with 73% immunity [17]
Table 3: Transmission rates of Omicron
Pathogenesis
Symbol Description Age-group Central Value Reference
PH hospitalization proba- ≥ 60 0.06 56% lower risk
bility of hospitaliza-
tion compared
to Delta [25]
40 − 59 0.02
18 − 39 0.01
≤ 17 0.001
PIU ICU probability of hos- ≥ 60 0.07 67% lower risk
pitalized cases of ICU admis-
sion compared
to Delta [25]
40 − 59 0.04
18 − 39 0.003
≤ 17 0.003
τH infection to hospitaliza- - 5 similar to
tion (days) Delta (as-
sumption)
τIU hospitalization to ICU - 5 similar to
(days) Delta (as-
sumption)
τR|H recovery time of hospi- - 1.5 [15]
talized cases (days)
τH|IU ICU length (days) - 4 [2]
Table 4: Disease progression and severity of Omicron
population should be taken into account in scenario modelling. We adjust the vaccine
effectiveness for a given age-group, according to the temporal decay of the protection
as well as the mix of the administered vaccine types. Several modeling assumptions are
taken:
161. We neglected the protections gained by the first vaccine dose.
2. Since the vaccination datasets are aggregated, it is not possible to link different
administered doses to a person. Therefore to model the efficacy of n booster shots,
we removed n earliest administered second shots.
3. By taking a (likely) conservative assumption, we consider the efficacy of the booster
to be equivalent to a refreshed second shot.
Efficacy of each administered second/third dose is estimated as the function of time
passed since vaccination (using an exponential fit) and the vaccine type. The average
of all efficacies in a given age-group then gives us the vaccine efficacy for that age-
group. Tables 5-8 provide the efficacies and decays used in our estimates. Note that we
neglected the reduction of the ICU admission rate (conditional on hospitalization) due
to the vaccination, as still reliable estimates are not available for such efficacy over time,
especially for Omicron cases.
Vaccine Type Time Passed Central Value Reference
(days)
BNT162b2 15-30 0.92 [19]
61-120 0.85
181-210 0.29
mRNA-1273 15-30 0.96 [19]
61-120 0.85
181-210 0.71
ChAdOx1 15-30 0.68 [19]
nCov-19
61-120 0.41
181-210 negligible
Table 5: Vaccine efficacy against infection (Delta)
Vaccine efficacy against hospitalization (all types combined)
Time Passed Central Value Reference
(days)
15-30 days 0.89 [19]
61-120 days 0.9
>180 days 0.42
Table 6: Vaccine efficacy against hospitalization caused by Delta (all types combined)
17Vaccine Type Time Passed Central Value Reference
BNT162b2 0 months 0.63 [1]
6 months 0.28 [13]
mRNA-1273 0 months 0.68 [1]
6 months 0.4 [13]
ChAdOx1 2 months 0.25 [1]
nCov-19
6 months negligible -
Table 7: Vaccine efficacy against infection (Omicron)
Time Passed Central Value Reference
2-24 weeks 0.72 [1]
24+ weeks 0.52 [1]
Table 8: Vaccine efficacy against hospitalization caused by Omicron (all types combined)
Simulation Details
Prior to run the simulations, the inputs on the virus transmission, the disease progression
and severity, the population statistics and vaccine efficacies are set. Based on the refine-
ment level of the mixing-patterns, 16 age-groups of 1-5, 6-10,...,75+ are considered for
Switzerland and Germany, using datasets provided in [21]. The reciprocity condition is
enforced via Eq. (7). Next, the infection rate is estimated for each variant from Eq. (25),
and the mitigation intensity is computed using Eq. (36). We find κ ∈ {43%, 34%, 21%}
for base scenarios Re ∈ {1.3, 1.5, 1.8} (identical for both Switzerland and Germany).
Once the transition rates are fixed, the initial condition on the number of infections
in each age-group is inferred to reproduce the given daily incidence rate at the initial
date. The initial shares of Omicron and Delta variants are assumed to be 90% and 10%,
respectively. We supposed initially 30% of unvaccinated population has been recovered
from Delta and 10% from Omicron. Afterwards, the differential equations (1)-(5) are
advanced for the considered time interval, and per each variant. Finally to include the
incubation period in the hospitalization and ICU admission data, similar to [22], the ob-
tained hospitalization and ICU admission time series are convoluted with the incubation
period distribution (log-normal with log mean value 1.8 and standard deviation 0.53 [20]).
18Sensitivity
We constructed four scenarios to assess robustness of our main results. Since the trans-
mission is principally governed by the imposed effective reproductive number, here we
focus on the assumptions behind the disease severity and the vaccine efficacy, and consider
four scenarios:
• Scenario 1: The average hospital treatment of Omicron cases would take 3 times
longer (i.e. 4.5 days) than our base scenario (i.e. 1.5 days).
• Scenario 2: The hospitalization and ICU admission rates of Omicron infections are
50% lower than the Delta ones.
• Scenario 3: The hospitalization and ICU admission rates of Omicron infections are
40% lower than the Delta ones. Moreover the vaccine efficacy against hospitalization
of Omicron cases is 5% lower than the base scenario (i.e. 5% lower than values given
in Table 8).
• Scenario 4: The hospitalization and ICU admission rates of Omicron infections are
30% lower than the Delta ones. Moreover the vaccine efficacy against hospitalization
of Omicron cases is 5% lower than the base scenario, besides 10% lower efficacy
against infection.
Figures 4-11 show the results of these four sensitivity scenarios for Switzerland and Ger-
many. Despite the unlikely assumption of Re = 1.8, the considered scenarios are well in
the range of the ICU occupancy limit in the two countries. The pressure on the general
ward of hospitals can become significant though, especially in scenarios 1 and 4.
Next, we investigated the effect of age-mixing patterns on the evolution of the pan-
demic. Figure 12 shows the adopted contact matrices for Switzerland and Germany (in
the absence of social-distancing) [21]. It is clear that the contacts are estimated to be
significantly more heterogeneous in the case of Switzerland. To evaluate the impact of
19(a) (b) (c)
Figure 4: Projection of Scenario 1 in Switzerland at Re = 1.8 for (a) daily incidence (Omicron cases),
(b) hospitalization (general ward) and (c) ICU occupancy. The average recovery time of hospitalized
cases (general ward) is considered to be 4.5 days (in contrast to 1.5 days in the base scenario).
(a) (b) (c)
Figure 5: Projection of Scenario 2 in Switzerland at Re = 1.8 for (a) daily incidence (Omicron cases), (b)
hospitalization (general ward) and (c) ICU occupancy. The severity of Omicron is assumed 50% lower
than Delta here.
(a) (b) (c)
Figure 6: Projection of Scenario 3 in Switzerland at Re = 1.8 for (a) daily incidence (Omicron cases), (b)
hospitalization (general ward) and (c) ICU occupancy. The severity of Omicron is assumed 40% lower
than Delta here and the vaccine efficacy against hospitalization is 5% lower than the base assumption.
(a) (b) (c)
Figure 7: Projection of Scenario 4 in Switzerland at Re = 1.8 for (a) daily incidence (Omicron cases), (b)
hospitalization (general ward) and (c) ICU occupancy. The severity of Omicron is assumed 30% lower
than Delta here and the vaccine efficacies against hospitalization and infection are 5% and 10% lower
than the base assumptions, respectively.
20(a) (b) (c)
Figure 8: Projection of Scenario 1 in Germany at Re = 1.8 for (a) daily incidence (Omicron cases), (b)
hospitalization (general ward) and (c) ICU occupancy. The average recovery time of hospitalized cases
(general ward) is considered to be 4.5 days (in contrast to 1.5 days in the base scenario).
(a) (b) (c)
Figure 9: Projection of Scenario 2 in Germany at Re = 1.8 for (a) daily incidence (Omicron cases), (b)
hospitalization (general ward) and (c) ICU occupancy. The severity of Omicron is assumed 50% lower
than Delta here.
(a) (b) (c)
Figure 10: Projection of Scenario 3 in Germany at Re = 1.8 for (a) daily incidence (Omicron cases), (b)
hospitalization (general ward) and (c) ICU occupancy. The severity of Omicron is assumed 40% lower
than Delta here and the vaccine efficacy against hospitalization is 5% lower than the base assumption.
(a) (b) (c)
Figure 11: Projection of Scenario 4 in Germany at Re = 1.8 for (a) daily incidence (Omicron cases), (b)
hospitalization (general ward) and (c) ICU occupancy. The severity of Omicron is assumed 30% lower
than Delta here and the vaccine efficacies against hospitalization and infection are 5% and 10% lower
than the base assumptions, respectively.
21(a) (b)
Figure 12: Contact matrices by age for (a) Switzerland and (b) Germany [21].
different age-mixing patterns of the two countries on our results, we study the base sce-
narios but with swapped contact matrices.
Figure 13 shows the modeled contact scenarios. As expected, by reducing the heterogene-
ity between the age-mixing contacts, we observe a higher increase in the case numbers
in Switzerland, for the same reproductive number. Conversely, the effect is reversed in
Germany where a less uniform contact matrix leads to a lower epidemic burden, for the
same reproductive number.
Overall our sensitivity investigation further supports the main result that the current
Omicron wave may not impose a significant threat on the healthcare system of the con-
sidered populations. Nevertheless the constant stress on the healthcare demand and
possible shortage of staff due to the high infection rate across the population should be
considered in evaluating the risk of the current Omicron wave.
Computation and Datasets
The dynamic model was implemented with MATLAB and the Statistics Toolbox Release
2020b. The vaccine efficacies were implemented with R. The codes are available upon
request from the corresponding author. All datasets used in this study are publicly avail-
22(a) (b)
(c) (d)
Figure 13: Effect of age-mixing contact matrix on the epidemic wave (a) scenario projection of Switzer-
land with contact matrix of Germany, (b) scenario projection of Germany (original contact matrix),
(c) scenario projection of Germany with contact matrix of Switzerland and (d) scenario projection of
Switzerland (original contact matrix).
able. The current epidemiological state of Switzerland and Germany are set according to
the official data of Federal Office of Public Health (FOPH) and the Robert-Koch-Institute
(RKI), respectively. We used contact matrices estimated by [21].
Acknowledgement
This work has been realized as a sub-project of B-FAST (Bundesweites Forschungsnet-
zwerk Angewandte Surveillance und Testung) for the joint project National Research
Network of University Medicine on COVID-19, funded by the Federal Ministry of Edu-
cation and Research (BMBF - FKZ 01KX2021).
References
[1] Uk health security agency. sars-cov-2 variants of concern and variants under investigation in eng-
land, Technical briefing 312021, (2022).
[2] F. Abdullah, J. Myers, D. Basu, G. Tintinger, V. Ueckermann, M. Mathebula,
R. Ramlall, S. Spoor, T. de Villiers, Z. Van der Walt, et al., Decreased severity of
disease during the first global omicron variant covid-19 outbreak in a large hospital in tshwane,
south africa, International Journal of Infectious Diseases, (2021).
23[3] C. L. Althaus, S. Baggio, M. L. Reichmuth, E. B. Hodcroft, J. Riou, R. A. Neher,
F. Jacquerioz, H. Spechbach, J. Salamun, P. Vetter, et al., A tale of two variants: Spread
of sars-cov-2 variants alpha in geneva, switzerland, and beta in south africa, medRxiv, (2021).
[4] F. Balabdaoui and D. Mohr, Age-stratified discrete compartment model of the covid-19 epidemic
with application to switzerland, Scientific reports, 10 (2020), pp. 1–12.
[5] R. C. Barnard, N. G. Davies, C. A. Pearson, M. Jit, and W. John, Modelling the potential
consequences of the omicron sars-cov-2 variant in england, 2021.
[6] O. Diekmann, J. Heesterbeek, and M. G. Roberts, The construction of next-generation
matrices for compartmental epidemic models, Journal of the Royal Society Interface, 7 (2010),
pp. 873–885.
[7] N. Ferguson, D. Laydon, G. Nedjati Gilani, N. Imai, K. Ainslie, M. Baguelin, S. Bha-
tia, A. Boonyasiri, Z. Cucunuba Perez, G. Cuomo-Dannenburg, et al., Report 9: Im-
pact of non-pharmaceutical interventions (npis) to reduce covid19 mortality and healthcare demand,
(2020).
[8] L. Fumanelli, M. Ajelli, P. Manfredi, A. Vespignani, and S. Merler, Inferring the
structure of social contacts from demographic data in the analysis of infectious diseases spread,
(2012).
[9] S. Funk, J. K. Knapp, E. Lebo, S. E. Reef, A. J. Dabbagh, K. Kretsinger, M. Jit, W. J.
Edmunds, and P. M. Strebel, Combining serological and contact data to derive target immunity
levels for achieving and maintaining measles elimination, BMC medicine, 17 (2019), pp. 1–12.
[10] H. Gorji, M. Arnoldini, D. F. Jenny, W.-D. Hardt, and P. Jenny, Smart investment of
virus rna testing resources to enhance covid-19 mitigation, Plos one, 16 (2021), p. e0259018.
[11] X. He, E. H. Lau, P. Wu, X. Deng, J. Wang, X. Hao, Y. C. Lau, J. Y. Wong, Y. Guan,
X. Tan, et al., Temporal dynamics in viral shedding and transmissibility of covid-19, Nature
medicine, 26 (2020), pp. 672–675.
[12] L. Jansen, Investigation of a sars-cov-2 b. 1.1. 529 (omicron) variant cluster—nebraska, november–
december 2021, MMWR. Morbidity and mortality weekly report, 70 (2021).
[13] D. S. Khoury, M. Steain, J. Triccas, A. Sigal, M. P. Davenport, and D. Cromer,
Analysis: A meta-analysis of early results to predict vaccine efficacy against omicron, medRxiv,
(2021).
[14] D.-K. Kipourou, C. Leyrat, N. Alsheridah, S. Almazeedi, S. Al-Youha, M. H. Jamal,
M. Al-Haddad, S. Al-Sabah, B. Rachet, and A. Belot, Probabilities of icu admission and
hospital discharge according to patient characteristics in the designated covid-19 hospital of kuwait,
BMC public health, 21 (2021), pp. 1–11.
[15] J. A. Lewnard, V. X. Hong, M. M. Patel, R. Kahn, M. Lipsitch, and S. Y. Tartof,
Clinical outcomes among patients infected with omicron (b. 1.1. 529) sars-cov-2 variant in southern
california, medRxiv, (2022).
[16] Y. Liu and J. Rocklöv, The reproductive number of the delta variant of sars-cov-2 is far higher
compared to the ancestral sars-cov-2 virus, Journal of travel medicine, (2021).
[17] S. Madhi, G. Kwatra, J. E. Myers, W. Jassat, N. Dhar, C. K. Mukendi, A. Nana,
L. Blumberg, R. Welch, N. Ngorima-Mabhena, et al., South african population immunity
and severe covid-19 with omicron variant, medRxiv, (2021).
[18] S. Mayor, Covid-19: Warning over transmission risk as self-isolation is cut to five days in england,
2022.
[19] P. Nordström, M. Ballin, and A. Nordström, Effectiveness of covid-19 vaccination against
risk of symptomatic infection, hospitalization, and death up to 9 months: A swedish total-population
cohort study, Hospitalization, and Death Up to, 9 (2021).
[20] S. Paul and E. Lorin, Distribution of incubation periods of covid-19 in the canadian context,
Scientific Reports, 11 (2021), pp. 1–9.
24[21] K. Prem, A. R. Cook, and M. Jit, Projecting social contact matrices in 152 countries using
contact surveys and demographic data, PLoS computational biology, 13 (2017), p. e1005697.
[22] J.-D. Van Wees, M. van der Kuip, S. Osinga, B. Keijser, D. van Westerloo, M. Hane-
graaf, M. Pluymaekers, O. Leeuwenburgh, L. Brunner, and M. T. van Furth, Sir model
for assessing the impact of the advent of omicron and mitigating measures on infection pressure and
hospitalization needs, MedRxIv, (2021).
[23] L. Veneti, B. V. Salamanca, E. Seppälä, J. Starrfelt, M. L. Storm, K. Bragstad,
O. Hungnes, H. Bøås, R. Kvåle, L. Vold, et al., No difference in risk of hospitalisation
between reported cases of the sars-cov-2 delta variant and alpha variant in norway, International
Journal of Infectious Diseases, (2021).
[24] R. Viana, S. Moyo, D. G. Amoako, H. Tegally, C. Scheepers, R. J. Lessells, J. Gi-
andhari, N. Wolter, J. Everatt, A. Rambaut, et al., Rapid epidemic expansion of the
sars-cov-2 omicron variant in southern africa, medRxiv, (2021).
[25] L. Wang, N. A. Berger, D. C. Kaelber, P. B. Davis, N. D. Volkow, and R. Xu, Compar-
ison of outcomes from covid infection in pediatric and adult patients before and after the emergence
of omicron, medRxiv, (2022), pp. 2021–12.
[26] N. Wolter, W. Jassat, S. Walaza, R. Welch, H. Moultrie, M. Groome, D. G. Amoako,
J. Everatt, J. N. Bhiman, C. Scheepers, et al., Early assessment of the clinical severity of
the sars-cov-2 omicron variant in south africa, medRxiv, (2021).
[27] F. Zhou, T. Yu, R. Du, G. Fan, Y. Liu, Z. Liu, J. Xiang, Y. Wang, B. Song, X. Gu,
et al., Clinical course and risk factors for mortality of adult inpatients with covid-19 in wuhan,
china: a retrospective cohort study, The lancet, 395 (2020), pp. 1054–1062.
25You can also read