Process mining applied to League of Legends to achieve performance insight by using API data extraction - Industrial Engineering & Management ...
←
→
Page content transcription
If your browser does not render page correctly, please read the page content below
August 2021   Process mining applied
              to League of Legends to
              achieve performance
              insight by using API data
              extraction
              Industrial Engineering & Management
              Bachelor Thesis

                First supervisor: Dr. G.W.J. Bruinsma
                Second supervisor: Dr. I. Seyran Topan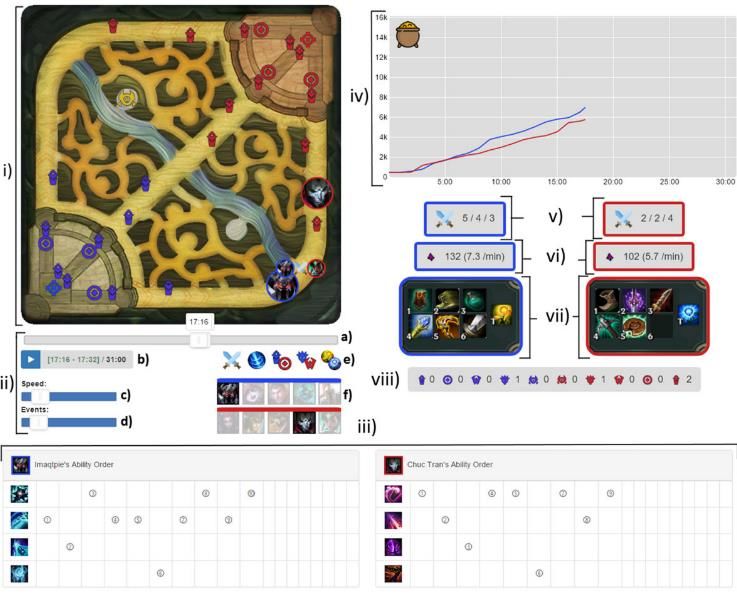
Bachelor thesis Industrial Engineering and Management

  Process mining applied to League of Legends to achieve performance insight by using API
                                      data extraction

                                           Author

University of Twente
Drienerlolaan 5
7522 NB Enschede
(053) 489 9111

Supervisors University of Twente
First supervisor: Dr. G.W.J. Bruinsma (Guido)
Second supervisor: Dr. I. Seyran Topan (İpek)

                                                                                            i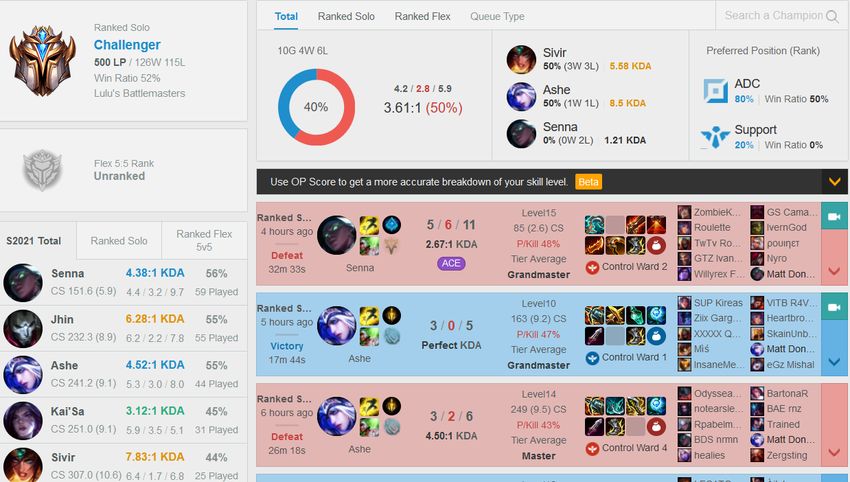
Management summary
eSports is an industry which has been growing over the past decade. This growth has been
realised in terms of viewers, players, and money involved. Due to the growth, the eSports
scene has been catching up on traditional sports. One particular game with a large eSports
scene is the video game League of Legends. Individual players, as well as the eSports teams,
benefit from improving gameplay. Performance improvement can be achieved in terms of
improving physiology, psychology, strategies, and team coherence. Data analysis is also a
way of gaining insight in gameplay, which can lead to performance improvement. There are
websites online which show dashboards where information is summarised and shared for an
inputted player to analyse. However, these dashboards only show statistics, and do not take
into account the timing when events during a match occurred. Furthermore, such
dashboards primarily show data which League already shows to the player in the game itself.
There seems to be a lack of applications which analyse in-game objectives, which play a
critical role in winning a match in League. Academic research also does not provide a tool or
application which combines the idea of analysing in-game objectives as well as the timing of
such events. Thus, the research of this thesis aimed to create a tool which analyses the
timed sequence of events concerning in-game objectives, in order to gain insight in an
inputted player’s playstyle, which could be used for personal improvement goals, as well as
analysing and creating counter strategies against opponents.
To realise this analysis tool, requirements had to be devised, which makes sure that the tool
would be sufficiently useful. Three requirement categories were created, namely “Collect
data”, “Analyse data to distinguish winning patterns”, and “Guarantee user friendliness”.
Each requirement category has its own requirements which need to be satisfied in order to
sufficiently satisfy the corresponding requirement category. The “Collect data” category
aimed to make sure that the online data source for the tool was reliable and that the user
defined inputted data can be analysed without errors. The “Analyse data to distinguish
winning patterns” category aimed to make sure that the tool scans and analyses the match
history of the inputted player to analyse by checking for each match the impact of taking an
objective, as well as the timing of it in a match. The “Guarantee user friendliness” category
aimed to make sure the tool runs automatically with minimal input from the user, as well as
providing options to visualise and filter information.
League provides an online API for players to use. They can use it to extract information
about their matches played. This API was used by the tool constructed in this thesis. The tool
consists of a Python code which asks input from the user, such as which player account to
analyse, and then extracts information of the player’s matches concerning in-game
objectives. Whether the player won the concerning match when a certain objective was
taken is used as a measurement of success for the objective. The collected data is put into an
Excel file which uses VBA coding to interpret the data and create a Pivot table and chart to
visualise it. The user has the possibility to filter information in the table and graph.
The constructed tool was tested by inputting a professional eSports player. The tool worked
as intended and the requirements were sufficiently satisfied. A sensitivity analysis was
executed for certain requirements where possible. For example, one requirement was that

                                                                                                ii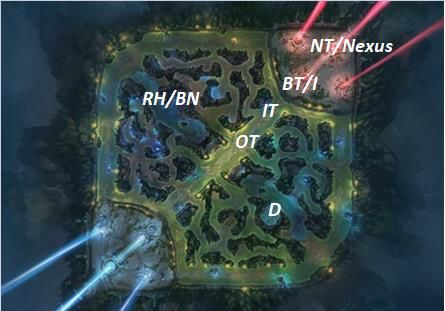
every player in the world could be inputted in the tool. This was tested by inputting players
from different regions and check whether the tool would adjust accordingly, which was
indeed the case.
A survey was constructed as a validation method to check to what extent potential users
thought the tool was suitable, and what improvements points they could think of. League
players from the Esports Team Twente were sent the survey to fill in. The response
concluded that the analysis of in-game objective events as well as their timing could indeed
be beneficial. Certain points of improvement were also formulated. One example was that a
more detailed analysis could be more beneficial, since League contains a lot of factors which
also influence the chances of victory.
The tool is initially used to analyse the success of taking objectives for the inputted player.
Even though the tool is not able to analyse the success of other events that occur during a
match, it requires relatively small changes in the Python code to adjust this, because the API
also contains data of other events. Furthermore, the design of the tool could be based
initially on the opinions of eSports players, instead of using their opinions as validation. Such
a design plan could also benefit if software would be used to create a standalone
application, instead of separate Python and Excel files, which could improve user
friendliness. Finally, the API has its limitations, as data is gathered every minute, and not
every second. Using analysis software to gather data from replays of matches can improve
the data and make it more detailed. All these aforementioned possibilities can be used as
starting point for further research.

                                                                                                iii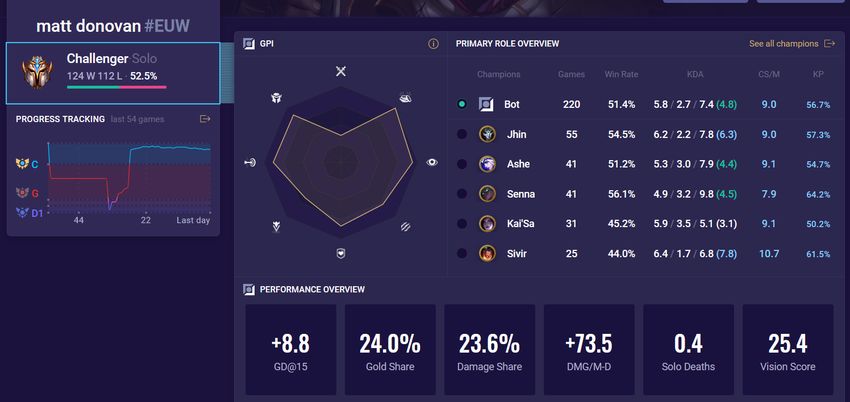
Preface
In front of you lies my bachelor thesis which I conducted for my bachelor study Industrial
Engineering & Management on the University of Twente. The assignment was conducted
internally on the university with Guido Bruinsma as my first supervisor.
First of all, I would like to thank my first supervisor Guido Bruinsma. I felt lucky that I was
able to do a bachelor assignment in a field of study that seemed interesting to me, namely
eSports. I was also glad that this assignment had a significant part of coding, since I thought
it is nice to make a product which works on its own. I want to thank him for the feedback he
provided, his patience, and his friendliness. I felt that I could do the things that I want
without feeling too much pressure.
Second of all, I would like to thank Ipek Seyran Topan, my second supervisor. She has helped
me since the graduation preparation of module 11. She helped me by relieving working
pressure and by answering all my questions. Her help continued when I started and worked
on my thesis assignment, and I would receive answers almost instantly whenever I asked
something. I want to thank her friendly commitment to me and how she supported me
throughout my whole graduation process.
I would also like to thank the League players of the Esports Team Twente for helping me out
with the external validation part for the tool.
Finally, I would like to thank my mother and my friends for supporting me throughout the
graduation. Especially Casper and Pim were two fellow graduate students who were also
busy with all the ups and downs that come with graduating, and hanging out with them
helped me charge up.

                                                                                              iv
Table of Contents
Management summary .....................................................................................................................ii
Preface .............................................................................................................................................. iv
Chapter 1: Context analysis .............................................................................................................. 1
Chapter 2: Theoretical framework ................................................................................................... 3
Chapter 3: Method of approach ..................................................................................................... 13
Collect data ................................................................................................................................. 13
Analyse data to distinguish winning patterns ............................................................................ 15
Guarantee user friendliness ....................................................................................................... 17
Prototype .................................................................................................................................... 18
Testing of the tool ...................................................................................................................... 21
Chapter 4: Results .......................................................................................................................... 22
Analysis of Rekkles ...................................................................................................................... 27
Requirements sensitivity analysis............................................................................................... 28
Validation.................................................................................................................................... 29
Chapter 5: Discussion and conclusion ............................................................................................ 31
Collect data ................................................................................................................................. 31
Analyse data to distinguish winning patterns ............................................................................ 32
Guarantee user friendliness ....................................................................................................... 32
Conclusion .................................................................................................................................. 33
Discussion and limitations .......................................................................................................... 33
Chapter 6: Further research ........................................................................................................... 35
References ...................................................................................................................................... 38
Appendix A: The game League of Legends ..................................................................................... 41
Game set-up ............................................................................................................................... 41
Objectives ................................................................................................................................... 42
Time periods ............................................................................................................................... 44
Remake ....................................................................................................................................... 44
Appendix B: Functioning of the tool............................................................................................... 46
Python......................................................................................................................................... 46
Excel ............................................................................................................................................ 51
Appendix C: Python script .............................................................................................................. 55
Appendix D: VBA macros ................................................................................................................ 67
Appendix E: External validation survey .......................................................................................... 69
vChapter 1: Context analysis
eSports, which is short for Electronic Sports, is the world of organised and competitive video
gaming, where millions of fans all over the world attend live or online events to watch the
competition play (Willingham, 2018). Professional gaming teams or individual competitors
battle each other for a title or championship, which includes prize pools, ad revenues (Reyes,
2021), and other income streams like selling merchandise (Pan, 2018). Research has been
done on the growth of eSports and a continuation of growth is expected (Newzoo, 2021).
The eSports scene has also grown compared to traditional sports and gathered in 2019 more
viewers than rugby and American football combined (Olya, 2021). Furthermore, the amount
of eSports watchers is expected to surpass the baseball scene in 2022. Especially younger
watchers, ranging in age from 18 to 25 years old, spend considerably more time watching
other people playing games than watching more traditional (Limelight Networks, 2020). The
amount of eSports players also grows when comparing 2014 with 2019.
Certain parties have already started anticipating on the growth of eSports over the year. For
example, Madison Square Garden, which has a capacity of 20.000 people, has been used for
eSports events and managed to consistently fully fill it with eSports watchers. Japanese
entertainment company Konami has constructed a big facility of 12 stories high which is
focussed on eSports activities, called the Konami Creative Center Ginza (Olya, 2021).
Furthermore, eSports has also been speculated to be part of future Olympic Games, and
eSports is even already part of the 2022 Asian Games.
In eSports, investments take place. This aspect is investigated on further in the following
part.
The prize pools of eSports tournaments also have increased over the years and are starting
to become comparable to the prize pools of more traditional sports, such as football, golf,
cricket, darts, and cycling (Wagner, 2018). To highlight the growth of the eSports scene with
an example: the world championship event of DotA 2 held in 2019 had a prize pool of over
34.3 million USD, which is also the biggest prize pool so far of an eSports tournament
(Nordmark, 2021).
The top 10 Forbes eSports organisation ranking list has the trait that 7 of the top 10 eSports
organisations currently have franchise League eSports teams (Settimi, 2020). The top 3
organisations, TSM, Cloud9 and Team Liquid, all have a history in the North American League
of Legends eSports scene. TSM, with its value around 410 million USD, is the biggest eSports
organisation in the world, and has been part of the League eSports scene from the
beginning.
As highlighted, especially League of Legends is an eSports scene which has seen growth and
is currently one of the biggest eSports industries in the world (Shelp, 2020). The growth over
the years of this eSports scene will be explained and elaborated on next.
The overall number of viewers who watch League of Legends grows over the years (Statista,
2021). To illustrate, the number of viewers for the League of Legends World Championship
1finals grew to 100 million in 2019 (Pei, 2019). For comparison, the Super Bowl of that year
had roughly 98 million viewers and its viewership is on a declining trend.
This growth of the League of Legends eSports scene manifests in, among others, viewers,
players, sponsors, investors, and business partners. Football and basketball sports clubs like
FC Schalke 04, Milwaukee Bucks and Golden State Warriors have started to create their own
professional League of Legends eSports teams and are competing on a professional level
(Church, 2020).
The eSports scene keeps growing over the ages. League of Legends is one of the more
prominent games with an eSports scene and it has been established for roughly ten years
now (Shelp, 2020).
League of Legends is a competitive video game. Performance optimisation could be
beneficial for the professional eSports teams, its players on the team, and players who do
not participate in the eSports scene but focus on improving their gameplay. Other more
traditional sports, like football, has staff to improve performance with relation to coaching,
game analysis, fitness and medical issues. There are also companies, like SciSports, which
aim to improve football performance via data algorithms. Similarly, League of Legends
eSports teams also has coaches, analysts, and data engineers, which could optimise the
performance of their eSports players. There are papers of academic research available which
explain about possibilities for performance optimisation concerning League of Legends, such
as optimisation with regard to physiology, psychology, game strategies, and team
coherence. Performance optimisation could also be achieved by insight in the game
performance of the individual. Concerning such game analysis, there are websites available
which show statistics about what happened during a match played. However, these websites
do not provide insight in the analysis of events that happened during a match with relation
to time. Such time series analysis could provide more insight in an individual’s performance,
which leads to performance improvement.
The available League of Legends academic research is investigated upon further in Chapter
2. To understand the material researched in Chapter 2, it would be beneficial to understand
the video game League of Legends better. Thus, basic information about the game will be
explained briefly.
The strategy video game League of Legends (abbreviated as League) consists of matches
played between 2 teams of 5 players each and the players try to destroy each other’s base,
which is situated on their respective side of the map. Bases are guarded by turrets which
needs to be destroyed first. Across the map, there are certain neutral monsters which can be
killed to make the team who killed it permanently stronger for the rest of the match.
Destroying turrets or these monsters are labelled as ‘objectives’. More in-depth explanation
about League is provided in Appendix A.
2Chapter 2: Theoretical framework
By investigating previous work and research, a starting point can be identified to find a way
to solve the main research opportunity faced in Chapter 1, which was about performance
optimalisation with regard to game analysis of League matches. Similar research might have
provided some answer regarding the research opportunity, but this should be analysed to
what extent this is done. Such research can be used as a starting point to modify the
research goals and adjust it in such a way so that a new innovative solution can be created.
This chapter starts off by listing current available data analysis visualisation methods. A few
websites and applications are shown to sketch the current state of visualisation possibilities,
to help understand what is offered. This shows what is currently done, and also shows what
is left to improve. Next up, the academic database Scopus is used to search for other
methods, such as data visualisation, that were used on eSports and League specifically. This
can show which methods are researched, and can highlight what state-of-the-art possibilities
there are concerning data analysis. The focus during this orientation phase is to see whether
a method truly adds value in the sense that the data can provide insight to a team’s or
player’s performance and whether or not it can contribute to winning. The main focus is that
either the research or applications should be able to improve the win rate of a team or
player. The checking of current available data visualisation applications, and the analysis of
literature of the topic, will realise a requirement list to accomplish setting steps in the
direction of creating an innovative solution concerning data analysis in League. The new
method created in the next chapter should be able to meet the requirement list, and thus
provide both a practical and innovative new method.
The current available data analysis visualisation methods will now be analysed. Most of
these available methods are realised in the form of websites. There are already websites
available which visualise and summarise the data that happened in a game. The best known
website for this is OP.GG, which is a website where you can fill in a summoner name of a
player and check their match history, along with their Ranked Queue ranks and other data. A
nice feature about OP.GG is that it easily also shows the rank, level, and runes of your
opponents and teammates in the game you are currently in. Figure 1 shows what OP.GG
looks like. OP.GG uses the League of Legends Riot API as data input. As an example, the main
account of a famous League eSports player called Rekkles is analysed. League players often
change the name of their account, which is the summoner name. The main name of the
player is Rekkles, but he has roughly 5 other accounts which each have other summoner
names. Thus, at the time of creation of Figure 1 and 2, one of his accounts had the name:
“Matt Donovan”. This account was used to show what the concerning websites look like in
the figures.
3Figure 1: The summoner stats from the summoner Matt Donovan. Extracted from [Matt
Donovan - Summoner Stats - League of Legends]. (2021). OP.GG Europe West. Retrieved
from https://euw.op.gg/summoner/userName=matt+donovan
OP.GG is not the only website which shows data visualisation of games played. There are
other websites which show and visualise data or winning strategies off champions, like
Champion.gg, Blitz.gg, Mobafire.com and Mobalytics.gg. Since Mobalytics tries to show more
data that other sites do not, like showing a playing profile. This is unique to Mobalytics and
an example of such a playing profile is shown in Figure 2. Its graph has aspects such as
Fighting, Consistency, Versatility, Survivability and Aggression. This graph is purely meant to
give an idea of what the data analysis roughly looks like, and thus these aspects are not
explained further.
4Figure 2: The playstyle of summoner Matt Donovan according to Mobalytics. Extracted from
[Matt Donovan (region: EUW) - Champion Stats - League of Legends (Season 11)]. (2021).
Mobalytics. Retrieved from
https://app.mobalytics.gg/lol/profile/euw/matt%20donovan/overview
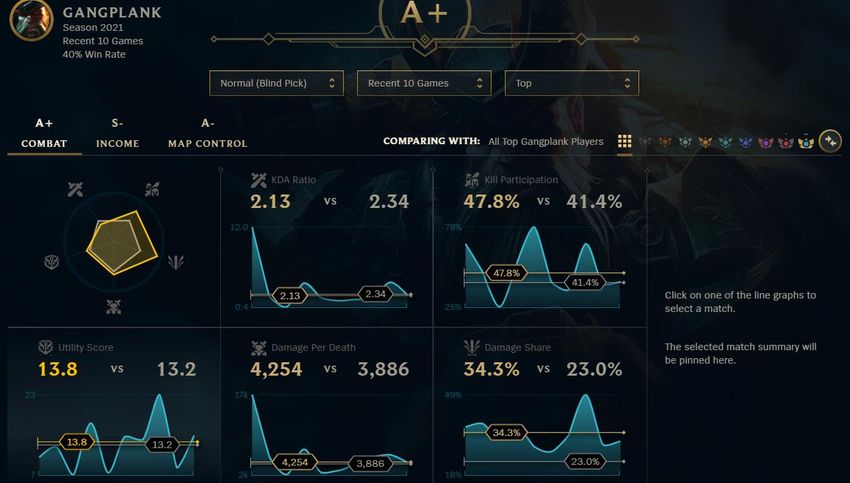
League of Legends itself also has a way of analysing player specific data and uses it to make a
playing profile for each champion on each position played, if enough data is gathered. It’s
similar to the graph of Mobalytics, but not completely. It uses three categories of gameplay
to visualise someone’s playstyle, which are Combat, Income, and Map Control. Aspects
shown are fairly general and can be easily viewed in tables and graphs of post-match data.
Concerning aspects are, for example, Damage Share, Kill Participation, minions killed per
minute, early gold advantage, Objective Control Ratio, and Vision Score. A dashboard of the
Combat category is shown in Figure 3. The higher the grade, the better your performance
compared to other players of different selected ranks.
5Figure 3: The playing profile visualisation from the game League itself. Extracted from: Riot
Games, Inc. (2009). League of Legends (Version: patch 10.7) [Video game]. Los Angeles, CA:
Riot Games, Inc.
As shown, there are ways to visualise data of players in different contexts. However, none of
these options take the sequence of events that happen during a game into account, which
are events in the context of when something happened during the game. Especially
concerning objectives taken during a game. Objectives have a large impact on the winning
probability of a game, but a clear analysis lacks so far. Only static data is analysed,
categorised and visualised. Thus, academic literature should be analysed to check whether
there are already methods developed to analyse the importance of the occurred sequence
of events during a game.
Thus, an innovative dashboard should so far contain the following tentative requirements to
distinguish itself from current visualisation applications:
- The sequence of events of a match should be taken into account, instead of just
analysing simply post-game statistics
- In -game objectives should be analysed
The next goal is to follow up on the search for innovative requirements by looking at
academic literature. It could be that academic research has already created methods which
meet to the tentative requirements list, even though such methods may perhaps not be
created in the form of an application or website yet. The main goal is to provide an
innovative solution, and if such a solution is already done in academic research, then such a
solution is not innovative after all, thus the academic literature should be analysed. Such
academic literature was reviewed by using the academic database Scopus. The total relevant
6list of sources are listed in the appendix. Keywords were used such as MOBA, League of
Legends, data, mining and strategy. The searching started of simple by searching for general
research on the eSports aspect of League of Legends.
Data analysis in League of Legends, and also for MOBAs in general, appears to be a useful
endeavour according to, for example, Sangster et al. (2016). In this paper, data about kills,
assists and the familiarity with teammates are analysed in an exploratory way. The
researcher conclude that expanding research in this field of study has beneficial possibilities.
The first article found specifically about this data analysis on League was about a dashboard
build which is called VisuaLeague (Afonso et al., 2019). It uses in-game data to visualise what
happened during the game, like making a 2D animation of how each player walked during
the game, thus creating walking routes. The data in the article used was said to be extracted
from the API of Riot. This API is accessible to general users and thus could be used as a data
extraction source to collect information about League and about matches played. Simply for
giving an idea of the dashboard, the VisuaLeague dashboard is shown in Figure 4. In
comparison to previously mentioned data visualisation, the VisuaLeague dashboard also
shows walking routes which happen during a game, which can be viewed on the upper left
map, thus it shows some information about the occurred sequence of events. Perhaps the
API data could be used to find more information about the timing of events that happen
during a match.
Figure 4: The VisuaLeague dashboard from Afonso, A. P., Carmo, M. B., Gonçalves, T., &
Vieira, P. (2019b). VisuaLeague: Player performance analysis using spatial-temporal data.
Multimedia Tools and Applications, 78(23), 33069–33090. https://doi.org/10.1007/s11042-
019-07952-z
7In the article of (Charleer et al., 2018), dashboards were built for League and also another
popular shooter game called Counter Strike: Global Offensive. The researchers tried to make
a dashboard for League which helps spectators watch official eSports matches better by
visualising potentially more useful information. They created a new visualisation module
which has not been known before, called Vulnerability, which is an indicator of how likely a
champion is to die in the current situation. This dashboard also shows other data like gold
progression and damage dealt by each champion. Even though this dashboard uses a new
way of analysing data which is also constantly updated, in the form of the Vulnerability
module, no clear overview is given over the sequence of events at the end of the game. The
data module simply shows which champion is vulnerable to dying at the moment, which is
meant to inform the spectator. For this dashboard, a Websocket was used which was
provided by the League eSports broadcasters, instead of API data like in the VisuaLeague
paper (Afonso et al., 2019a). In another paper of Afonso et al. (2019b), various visualisation
tools for League are compared. Interestingly, a VisuaLeague version 2 was developed in for
this research. The research was meant to test which visualisation is liked more by players,
where the result was that players favoured dynamic spatio-temporal visualisation, like
watching a replay of a match or a walking route animation. The walking route animation,
along with the replay of a match, shows the distinction between early events and late events
happening in a game, and thus seems to show that players prefer indeed data which give
insight in the sequence of events of the concerning game.
A nice goal of visualising and analysing the sequence of events in a game is to see what went
wrong, fix it, and measure the improved results. Thus, the analysis of useful and less useful
strategies should also be considered. The paper of Gerber et al., 2019 paper uses API data to
measure team performance and check performance improvement after an improvement
program was executed. This improvement program consisted of a three-day sleep-over
summer camp to do team building exercises with the goal of improving the mental aspect of
a player and, eventually, in-game team coordination. This research aimed at organising
activities which are totally separate from the game League of Legends itself. However,
another paper, which is from Lee & Ramler (2017), tested various different in-game team
strategies to check whether such behaviour would result in more victories. These team
strategies referred to mixing up roles. Thus, for example, the team composition of having
two junglers instead of the usual team role composition of one top laner and one jungler,
was considered. Readily available post-game statistics delivered by Riot was used to
compare the success of different team composition. Another paper (Sapienza et al., 2018),
also analysed the in-game behaviour of players. It used patterns in post-match kills, assists,
deaths and amount of earned gold to cluster behaviour types.
There is also research done about comparing the success of deviating strategies to a norm
for other MOBAs, like DotA 2 (Cavadenti et al., 2016). The research paper from Sapienza et
al., (2017) also researches DotA 2 to analyse which factors determine success for players.
Analysed factors were about overall player experience with the game and the type of player
specific in-game character choice. Another DotA 2 study which analyses success factors is
from Xia et al., (2019), and another study focussed on the application of machine learning on
predicting the win probability after the team composition of each team are set by using, just
8before the match starts (Semenov et al., 2016). The aforementioned DotA studies do not
distinguish between the timing of occurred in-game events to draw conclusions.
Another research paper which dived into the analysis of successful strategies for League, is
from Do Nascimento et al., (2017). In this paper, different behavioural profiles of teams were
categorised and for each profile, highly correlated post-game statistics were registered.
Essentially, the post-game statistics which fit a high win rate and a low win rate were
distinguished to conclude which statistics seemed the most relevant for a high win rate.
However, this paper uses static post-game statistics and thus does not differentiate between
the timing of occurrence of different in-game events. Another paper which also checks team
composition strategies is from Costa et al., (2019), where a Genetic Algorithm was used to
compose team compositions by selecting champions which all would fit a certain playing
strategy. There has also been done some research about victory prediction. However, the
data gathered and used is fairly basic. Examples of such papers are papers from Deja &
Myslak, (2015) and Ani et al., (2019).
There are multiple other research papers which identify winning strategies and other
behavioural patterns. Many of them use post-game data which does not differentiate
between the timing of occurred events. Most studies look if something happened, but not
when such an occasion occurred. However, some articles use this differentiation to some
extent. The research in Eaton et al., (2017), checks the importance of the survival of a team’s
Carry, which is the most important player who often does the most damage. This is analysed
by checking when either Carry of a team dies, and what effects these events have on the
amount of kills, assists, and buildings destroyed. Even though the timed sequence of events
of a match are taken into account, this paper does not provide some sort of advice in the
form of strategies or behavioural patterns, since it seems obvious that the team who kills the
other team’s Carry the most is extremely likely to win.
Another paper (Kho et al., 2020) also takes into account this sequence of events principle.
However, the focus is on objectives mainly. It analyses teams from professional eSports
League scenes from different regions and compare sequence of events with regard to
objectives result in victories. This objective focussed analysis is relatively unique compared
to other articles. The paper classifies 6 different objective events, which are first turret or
first dragon for example, and then looks which objective events happen most often for
winning teams in the concerning region. The analysed events are shown in Figure 5.
9Figure 5: The in-game objectives identified to keep track of in eSports matches. Extracted
from Kho, L. C., Kasihmuddin, M. S. M., Mansor, M. A., & Sathasivam, S. (2020). Logic mining
in league of legends. Pertanika Journal of Science and Technology, 28(1), 211–225.
However, this paper uses fairly basic sequence of events analysis because it only checks
when the first objective is taken by either team. This could be elaborated by checking more
data with regard to objectives. Also, every team of a region is analysed and allocated
towards the whole region. Thus, individual teams are not analysed, let alone individual
eSports players. In short, the depth of the sequence of events and the individuality of players
has a lot of room to be researched on.
The final paper discussed (Kho et al., 2020) suggested that there is enough research to be
done in the field of the sequence of events with relation to objectives. Objectives have a
large impact on the game but not a lot of academic research has been done to study this
extensively. Winning patterns for the sequence of events of objectives could be very useful
knowledge to help teams improve. Especially an automated method would be very useful
because the game League itself changes significantly after every year when the new season
arrives, and also after patches which happen roughly every half a month.
Overall, the academic research analysis concludes that the amount of research done in the
analysis of in-game objectives and the timed sequence of events is not researched
extensively. This further supports the requirement list which was constructed after the
orientation on current available data visualisation methods.
However, the academic theory orientation also helped extending requirements, since
common characteristics can be found among the methods done. For example, it was stated
multiple times in the aforementioned literature that the Riot API portal was used to access
match data online, and this gives the impression of being a reliable online source for
collecting data of League matches played. Visualised data in the form of a dashboard is also
used multiple times (Afonso et al., 2019a; Afonso et al., 2019b), and shows that a dashboard
has added value. Other aspects, such as quality of life additions, could be realised by the
customisability of the input and data visualisation. As a side note, in League, there are
different types of game modes. For example, a casual game mode can be played where the
results do not matter after a win or loss, or a ranked game mode can be played which will
impact a player rank depending on whether the player won or lost. Matches which are
considered serious have different playstyles than matches which are considered casual.
10Thus, the new method should be able to make a distinction in game modes when analysing a
player’s match history.
The full requirement list with its new requirements is as follows. Categories are added to add
overview:
- Data collection
o The method should extract data from a reliable online source about League
o The method should be flexible to analyse different players, from every region
o The method should change its sample data of matches analysed if the user
wants to
o The method should only collect data from matches played which are
considered serious
- Data analysis to identify winning patterns
o The method should focus on the importance of in-game objectives with
relation to winning
o The method should differentiate between early and late events in matches
(sequence of events)
- Ensure user-friendliness
o The method should have settings to view categories of analysed match data
o The method should use visualisation like graphs on a dashboard to help
create overview
o The method should run as automatic as possible
The requirements list yields a valuable research opportunity with a fitting research question,
which is:
How can the performance of League eSports players be identified by analysing behavioural
in-game patterns with regard to the sequence of events of objectives?
Essentially, the answer to this research question should be able to expand the research on
winning strategies and the analysis of player in-game behaviour. To make sure this happens,
three main aspects should be answered. First of all, it is important to check which data is
needed to answer the research question, and how it can be collected. Most likely, certain
data of League itself should be collected to analyse behavioural in-game patterns of players
during a match, such as with the aforementioned Riot API online portal. Second of all, the
gathering of the data should be able to be stored. Then, a method should be constructed to
analyse the data. Perhaps certain software can function as a way to store and analyse the
extracted data. Third of all, the analysed data should be translated and insightful conclusions
should be able to be drawn from them. This should result in an advice about the
performance of the player and would thus identify winning strategies. Meeting the
requirements of the requirements list will result in a tool which achieves the
aforementioned sub-goals, and thus would create an innovative method or tool which
achieves the required needs. For visualisation purposes, the figure with the requirements is
shown in Figure 6, and will be the blueprint for the actual development and creation of the
tool which will be done in Chapter 3.
11Figure 6: Visualised overview of blue requirements list
12Chapter 3: Method of approach
The aforementioned research opportunity was that research with relation to game analysis
to achieve performance optimisation in League can be beneficial. As mentioned in chapter 1,
such research would be significant due to the growth of the eSports scene in League, and
can be achieved with insight into the performance of a player. In this chapter is explained
how the research question posed in chapter 2 is answered.
The analysis of behavioural in-game patterns could be achieved by creating a tool. The
requirements, made in chapter 2, of such a potential tool are shown in Figure 6. The orange
boxes are the categories and the blue boxes are the requirements which can be used as a
checklist. Each category in this chapter has its own heading and the aspects of the tool which
would fit each category are explained. The end goal is to create a tool which is able to
identify in-game performance of League players concerning in-game objectives. This chapter
is about how each requirement is translated to an aspect of the tool. In Appendix B, a more
expansive and technical description about the tool itself is provided.
Collect data
The first category is “Collect data”. This refers to how data is collected and how it is stored.
The first requirement in this category is to use an online source for data collection.
Mentioned data collection methods in chapter 2 are, among others, a Websocket or the Riot
API. The latter is used by most of the analysed academic sources in chapter 2. The Riot API is
freely accessible to all players and is able to show in-game match data in the form of
structured documents, which highlights the impression of being a reliable online data
source.
The second requirement is that the data collection method should also be able to collect
data from every player in the world. Every player plays in its own region, and is not matched
with people from other regions. The Riot API is able to collect data from different regions,
which makes it a flexible data collection source. Thus, using the Riot API for data collection
would be a reliable option and also able to collect data from every player.
The third requirement is that the tool should be able to collect a desired amount of matches,
which would be inputted by the user. This should be a customisable option in the tool to
provide the user the possibility to analyse different amounts of data. The fourth requirement
also refers to data filtration. This requirement states that only data in the form of matches
should be included which are considered ‘serious’. Serious matches need to be classified as
matches where all participants had maximum effort and all played to win, in contrast to
playing casually for fun. ‘Ranked’ games are the most serious game types because the
outcome of the match played directly influences the public rank of the player profile. The
game type called ‘normal’ games, are matches which do not influence this public rank and
thus are played to a less serious extent. To conclude, the tool should have a customisable
match sample size and the ability to filter ranked games from normal games.
The Riot API gives the impression to be able to meet all four requirements of the “Collect
data” category, because of the data it offers. The Riot API can tell what has happened every
13minute within a match. To extract data from the Riot API, a program is needed. Python is a
programming language which is able to do this. Hence, the decision will be made to program
the data extraction procedure of the Riot API via Python.
In order to collect data of the Riot API in Python, functions have to be defined which extract
the match data of the inputted player to analyse when called. The Riot API uses JSON files
which can be accessed with an custom URL, which also requires a valid API key to access the
URL. The URL also contains the region of the player that is analysed, which means that every
player in the world can be analysed by inputting the region of the analysed player. The API
key for using the Riot API can be obtained by logging in with a League account and clicking
on the button to generate an API key, and this API key iteration expires after 24 hours.
Python is able to turn the JSON file into a ‘dictionary’ file, which makes it possible in Python
to extract data. In order to extract the data with an URL, the Python library called ‘requests’
needs to be imported. Four Python functions will be created to access summoner data, the
summoner’s match history, match details, and the match timeline. These functions yield all
the data to view what happened every minute in a match, because summoner data is
required to access the match history, and the match history contains the match IDs of the
matches played by the analysed player, which is used to access the match timeline and the
events of each minute. Not every match from the match history should be analysed, because
only the matches that are deemed as ‘serious’ matches should be extracted, which are
ranked matches. The Python code will only include such matches.
As mentioned before, the URLs which are used to retrieve the API data are customisable,
which means that specific data can be recalled if the URL is customised appropriately.
Customisable aspects for the URLs are: the region of the analysed player, the summoner
name of the player, a valid API key, a match ID, and the amount of matches to be analysed.
The region, summoner name, API key, and amount of matches analysed will need to be
inputted by the user. The match IDs would have to be automatically iterated through by the
code itself, and thus requires no manual input.
The “Collect data” requirements should be covered by the plan for the Python code:
• A reliable online source is used, namely the Riot API portal
• Every player in the world from each region can be analysed by the tool, due to the
customisable input for the region
• The amount of matches to be analysed is implemented as user input
• Only matches are collected which are considered serious, since ranked matches are
filtered by the code
Once the data is collected, the tool will need to analyse the data by registering objectives
and the timing of such events, which relate to the “Analyse data to distinguish winning
patterns” requirement category.
14Analyse data to distinguish winning patterns
The fifth and sixth requirements both refer to the desired ability of the tool to analyse data
to distinguish winning patterns. Successful in-game behaviour is defined as patterns which
elicit positive outcomes, which means outcomes that ultimately result in a player winning a
match.
The fifth requirement tells that a certain indicator should be provided by the tool which
shows which objectives seem to be more desirable. This indicator could be a win ratio, which
shows how likely it is for the analysed player to win when a certain objective is chosen. This
can be achieved by analysing matches where such an objective is taken and the outcome of
each match is registered.
The sixth requirement is that the tool should distinguish events based on their timing during
a match. This means that not only the acquired objective itself should be taken into account,
but also when it occurred. For example, whenever a tower is either destroyed in the early
game or in the late game, it has a different impact on the match. This requirement can be
realised by creating a data sheet which not only lists when an objective taken and whether
the outcome of the match was a win or loss for the player, but also at what time period this
event occurred.
The Python code explained in the ”Collect data” category should be able to gather the data
needed for the analysis. More coding is required to register the win rate of taking an
objective at what time period. The code should iterate through the filtered match IDs and
check what events concerning objectives occurred during the match. The code should also
register whether the analysed player won the match. Every match will be scanned by
analysing the match timeline JSON file by using a function to access the corresponding URL,
namely requestMatchTimeline. The timeline shows what has happened every minute in the
match, and thus can be used to register every objective that was taken during a match.
Other data, such as kills made or items bought, should be ignored because these are not
objective events. Another similar function is used to register which team won the match,
which is called requestMatchDetails. This is required to analyse whether the occurrence of
an objective event resulted in a victory or defeat for the analysed player. The script should
iterate every minute of a match and register all objectives taken by either team in an Excel
file which is used for data storage. For each row in this data storage file, the following
columns are used:
• Summoner (name of the player’s account)
• MatchID
• Outcome (1 means victory for the analysed player, 0 means defeat)
• Minute
• Period (early, middle, or late)
• Tower (whether a team destroyed a turret)
• Monster (whether a team has slain rift herald, dragon or baron nashor)
• Dragon Soul (whether a team acquired the dragon soul buff)
15Every objective event is registered in the Excel data storage file, along with its timing in the
form of minutes. This is done by using the Python library called ‘openpyxl’, which enables
Python to put data into an Excel file. The script should also determine whether an event
happened in the early, mid, or late game. The mid game is defined as the period from 15 to
25 minutes. The early game occurs before this time window while the late game occurs
afterwards. The outcome column will be used to calculate the expected win rate of each
occurred objective in the data set, which is done by dividing the amount of victories by the
amount of time a match was registered where the corresponding objective event occurred.
A summary table should be made where each objective event and its timing are shown next
to its expected win rate, which would grant the user insight into how successful taking an
objective is. The Excel data storage file will change whenever a new player will be analysed.
In order to make sure that the summary table reselects the new range of data in the Excel
data storage file, a VBA code should be created which automates this reselection and data
update. The library ‘openpyxl’ does not allow data to be pasted in a non-macro Excel file.
Thus, a separate dashboard Excel file with the summary table should be created which uses
the data from the data storage Excel file as input. The summary table should also include the
amount of time a match occurred where an objective event happens, as this amount gives
an indication of the reliability of the expected win rate. A minimum threshold for this
amount should be implemented to avoid exceptional matches as they are not
representative. A possible minimum threshold could be 3, which means that only matches
should be included with 3 or more occurances.
The “Analyse data to distinguish winning patterns” requirements should be covered by the
finished Python code and the plan for the Excel and VBA part:
• The winning probability is analysed of in-game objectives, because a summary table
is made in Excel which calculates the expected win rate of each objective event
• The timed sequence of events is analysed, because the filtered match data
categorises the objective events according to either the early, middle, or late game
A flow-chart of how the finished Python code works is shown in Figure 7.
16Figure 7: flow chart of the Python code
Guarantee user friendliness
The final three requirements are about visualisation and user friendliness aspects. The
seventh requirement is that information should be able to be filtered. This requirement aims
to make sure that customised navigation of the data analysis is possible, and thus only
chosen aspects of the data can be showed.
The eighth requirement is to include graphs or comparable visualisations, to make sure
conclusions can be drawn from a picture instead of lines of text, which aims to improve
visual clarity. Both the seventh and eight requirement can be satisfied by creating a
dashboard with customisable graphs and corresponding tables. The tables should be filtered
on chosen information by the user and the graphs should adjust accordingly. This provides
the user two types of ways to observe the conclusions of the data analysis by the tool.
17The ninth requirement should make sure that the tool runs automatically without
termination of the program and minimise the actions required by the user when running it.
The ability to filter information displayed by the tool can be implemented by the
introduction of an Pivot table in the Excel dashboard file, which should be a replacement for
the summary table as discussed in the part “Analyse data to distinguish winning patterns”. A
Pivot table categorises data and allows the user to only check for certain data. For example,
a Pivot table enables the user to only show objective events which happened in the early
game time period, along with its expected win rate. The objective events will be listed under
the ‘Situation’ heading in the Pivot table. Furthermore, it is also possible in Excel to add a
chart for the Pivot table. Changing which data is shown in the chart automatically updates
the Pivot table, which shows that data filtration is also possible in the chart. Thus, a
customisable visualisation is added this way, which fulfils both the seventh and eighth
requirements.
The final requirement aims to make sure the running of the tool is automated, in so far
possible. Since the API key has a limit of being able to be used 100 times per 2 minutes, the
tool should pause the program for 2 minutes once the API request counter comes close to
100. A threshold for this could be 98, because every analysed match requires 2 API requests.
Once this threshold has been surpassed, then the tool should pause and automatically
resume after 2 minutes.
After each run, new data is pasted in the Excel data storage file. The tool should
automatically reselect the new data for the Pivot table and graph, which can be achieved
with VBA macros in Excel.
The “Guarantee user friendliness” requirements should be covered by proposed
interventions:
• Customisable settings to filter displayed information is guaranteed because a Pivot
table and graph offers such options
• A visualisation of the data is added in the form of a Pivot chart
• Process automatization of the tool is guaranteed with built-in Python functions and
VBA macros
The method of approach is extensive enough to create a prototype, which will be discussed
in the “Prototype” heading.
Prototype
The prototype is a practical implementation of the plans proposed in the three
aforementioned requirement category headings. As mentioned before, the tool starts off by
running the Python code, which asks for user input. The full Python script is shown in
Appendix C. This user input is used to analyse the match history of an inputted player,
concerning in-game objectives. The tool summarises the data of objective events, called
situations in the Excel file, by putting them into a data storage Excel document. Another
dashboard Excel document reads this other file and turns the data into a Pivot table and
18graph, which enables the user of the tool to observe the impact of each analysed objective
on the outcome of a match. A flow chart of how the tool works is shown in Figure 8.
Figure 8: Flow chart of how the tool works
Running the Python code yields the interface as shown in Figure 9. The user types their
desired input and presses the Enter key to make the program save the input. As mentioned
before, the input is the region of the player to be analysed, the summoner name of the
player’s account, a valid API key for the Riot API, and the amount of previous matches to be
scanned.
Figure 9: Python input interface
The code first accesses summoner data of the inputted account to find the account ID of the
account, which is done by extracting data from a JSON file reached by a URL which contains
the API key. This account ID is used to collect the match history of the account, which is filled
with match IDs. The Python code accesses the API key two times per analysed match. An
example of a JSON file accessed by a constructed URL is shown in Figure 10. It shows the
19timeline of a match, where each frame is a minute, which contains events. Events tell what
happened during a minute, such as whether a champion is killed, an item is bought, or an
objective is taken. Every event is characterised by a participant ID. Another URL, which is
about match details, shows which player fits to which participant ID. Thus, both the match
details and match timeline needs to be analysed to analyse one match, which means that
the API key is requested twice. The limit API request limit is 100 times per 2 minutes. The
Python code will automatically pause and continue if the code would otherwise request the
API key above this limit.
Figure 10: A JSON file of the timeline of a match
After the Python code has finished running, the Excel data storage file should be opened by
the user. The name of this Excel file is shown at the end of the Python interface, which is
“LoLPMData”. The first row of this file contains the headings as discussed in the “Analyse
data to distinguish winning patterns” part of this chapter. Every next row will write down the
data of every objective taken by either team of the scanned set of matches by the tool. The
interface will also show the name of the Excel dashboard file, which should be opened only
after the Excel data storage file has been opened. This file is called “LoLPMDashboard”. This
file contains at the very left a table which transforms the data from the Excel data storage
file to a table which is able to be used as input for the Pivot table and graph. Thus, this table
is not meant to be looked at by the user. Instead, the Pivot table and graph are the focal
point of the data visualisation. They categorise each objective according to the time period
in which the objective events occurred. The user is able to adjust which time periods or
objective event, or situation, are filtered by the graph, which will automatically update the
Pivot table as well. It is important to note that the user should only change the filter settings
20You can also read