PRICED OUT Persistence of the Workforce Housing Gap in the San Francisco Bay Area
←
→
Page content transcription
If your browser does not render page correctly, please read the page content below
PRICED OUT
Persistence of the Workforce Housing Gap in the San Francisco Bay Area

                                  Terwilliger Center for Workforce Housing
Terwilliger Center for Workforce Housing

                              J. Ronald Terwilliger, Chairman                                                  Steve Preston
                              Trammell Crow Residential, Chairman                                              OAKLEAF Waste Management, President
                                                                                                               U.S. Department of Housing and Urban Development,
                              Carin Barth                                                                      Former Secretary
    National Advisory Board

                              LB Capital, Inc., President
                                                                                                               Jonathan Reckford
                              Tom Bozzuto                                                                      Habitat for Humanity International, CEO
                              The Bozzuto Group, CEO
                                                                                                               Nic Retsinas
                              Henry Cisneros                                                                   Joint Center for Housing Studies of Harvard University, Director
                              CityView, Executive Chairman
                              U.S. Department of Housing and Urban Development,                                Rick Rosan
                              Former Secretary                                                                 ULI Foundation, President

                              Bart Harvey                                                                      Ronnie Rosenfeld
                              Enterprise Community Partners, Former Chairman                                   Federal Housing Finance Board, Former Chairman

                              Bruce Katz                                                                       Alan Wiener
                              Brookings Institute, Metropolitan Policy Program,                                Wachovia Securities, Managing Director
                              Vice President and Director
                                                                                                               Pam Patenaude
                              Bob Larson                                                                       ULI Terwilliger Center for Workforce Housing, Executive Vice
                              Lazard Real Estate Partners, LLC, Chairman                                       President and Executive Director

                              Rick Lazio                                                                       Patrick Phillips, Ex Officio
                              JP Morgan Asset Management, Managing Director of                                 Urban Land Institute, CEO
                              Global Real Estate and Infrastructure

                              Copyright 2009 by Urban Land Institute. 1025 Thomas Jefferson Street, NW, Suite 500 West, Washington, D.C. 20007
2
About the Urban Land Institute                                                    About the ULI Terwilliger Center for
                                     The Urban Land Institute is a 501(c)(3) nonprofit research and education          Workforce Housing
                                     organization supported by its members. Founded in 1936, the Institute now
                                                                                                                       The ULI Terwilliger Center for Workforce Housing was established by J. Ronald
                                     has more than 32,000 members worldwide representing the entire spectrum of
                                                                                                                       Terwilliger, chairman and CEO of Trammell Crow Residential, to expand
                                     land use and real estate development disciplines, working in private enterprise
                                                                                                                       housing opportunities for working families. The mission of the center is to serve
                                     and public service. As the preeminent, multidisciplinary real estate forum, ULI
                                                                                                                       as a catalyst in increasing the availability of workforce housing in high-cost
                                     facilitates the open exchange of ideas, information, and experience among
                                                                                                                       communities by harnessing the power of the private sector.
                                     local, national, and international industry leaders and policy makers dedicated
                                     to creating better places.
                                                                                                                       The center supports the development of mixed-income communities close
                                                                                                                       to employment centers and transportation hubs. Through a multifaceted
                                     The mission of the Urban Land Institute is to provide leadership in the respon-
                                                                                                                       approach, the center facilitates research, advocates for public policy change,
                                     sible use of land and in creating and sustaining thriving communities world-
                                                                                                                       publishes best practices, convenes housing experts, and works to eliminate
                                     wide. Members regard ULI as a trusted idea place where leaders come to grow
                                                                                                                       regulatory barriers to the production of workforce housing.
                                     professionally and personally through sharing, mentoring, and problem solving.
                                     With pride, ULI members commit to the best in land use policy and practice.
                                                                                                                       About RCLCO (Robert Charles Lesser & Co.)
                                     About the ULI Foundation                                                          This report was prepared by RCLCO (Robert Charles Lesser & Co.) for the ULI
                                                                                                                       Terwilliger Center for Workforce Housing. RCLCO is a full-service real estate
                                     The ULI Foundation is the philanthropic partner of the Urban Land Institute,
                                                                                                                       advisory and land use economics firm with offices throughout the United
REPORT DESIGN BY SW CREATIVES, LLC

                                     providing an assured source of funding for ULI’s core research, education,
                                                                                                                       States. Contributors to this report include Adam Ducker, Charles Hewlett,
                                     and public service activities. Through its various giving and support programs,
                                                                                                                       Patrick Lynch, Lindsay Duerr, and Elisabeth Putney Mygatt.
                                     the Foundation helps strengthen ULI’s ability to provide leadership in the
                                     responsible use of land in order to enhance the total environment.

                                     The ULI Foundation is proud to support the ULI Terwilliger Center for Workforce
                                     Housing in its mission to expand housing opportunities for working families.

                                                                                                                                                                                                           3
Executive Summary

    Housing in the San Francisco Bay Area1 is persistently and pervasively                       As a consequence of the uniformly high housing costs, Bay Area households
    unaffordable despite the recent economic and housing market downturn. As                     in the “workforce” income range are largely priced out of homeownership.
    of the middle of 2009, every county in the Bay Area fell within the 15 percent               Owner-occupied workforce households in the Bay Area spend more of their
    least affordable in the country, and only New York City ranked less affordable.              income on homeownership than do households almost anywhere else in
                                                                                                 the country.
    The high cost of housing is particularly challenging for “workforce” house-
    holds, which the ULI Terwilliger Center for Workforce Housing defines as                     Uniformly high housing costs are similarly pervasive in the rental housing
    those earning between 60 percent and 120 percent of the area median                          market, which serves 42 percent of workforce households in the Bay Area.
    income (AMI). These residents, who work in important growth industries such                  Workforce households have a much higher propensity to rent in the Bay
    as education, health care, and professional services, must contend with a                    Area, especially among families, than in peer metropolitan regions across the
    housing stock in the Bay Area that is overwhelmingly, and in every county,                   country. Furthermore, Bay Area rents are high and a disproportionately high
    oriented toward higher-income households.                                                    percentage of workforce households also pay more than 30 percent of their
                                                                                                 incomes on rent, more than in peer metropolitan regions across the country.
    Only 15 percent of the existing for-sale housing stock in the Bay Area is
    affordable to workforce households earning the median family income — this                   Unless serious changes are made, future construction will not alleviate the
    compares with between 50 percent and 60 percent in many of the Bay Area’s                    problem. A scarcity of appropriately zoned and located land together with
    peer metropolitan regions. This low number is due in part to the fact that                   relatively high development costs makes it nearly impossible for builders and
    high housing prices extend across the region, and are not just concentrated                  developers to deliver high-quality new rental communities at price points
    in “closer-in” locations. In the Bay Area, moving “further out” does not                     affordable to workforce families.
    necessarily lead to less expensive housing.
                                                                                                 If current trends are any indication, housing production between 2009 and
                                                                                                 2025 will leave unmet additional demand for at least 6,000 for-sale housing
                                                                                                 units appropriate for workforce households. Demand for new rental housing
    1 For the purposes of this report, unless otherwise noted, the San Francisco Bay Area is
    defined as the nine counties including Alameda, Contra Costa, Marin, Napa, San Mateo,        is projected to exceed supply by almost 23,000 units resulting in a total
    Santa Clara, San Francisco, Solano, and Sonoma counties. This represents the following
    Metropolitan Statistical Areas (MSAs): San Francisco-Oakland-Fremont, Santa Rosa-Petaluma,   shortage of almost 29,000 workforce housing units.
    San Jose-Sunnyvale, Vallejo, and Napa.

4
Without creative new ways to help finance
housing for workforce households, the
Bay Area will face a further shortage of
29,000 units by 2025, leaving the region’s
teachers, firefighters, nurses, and other
workers vital to the regional economy
priced out.

                                             5
Defining the Workforce

    The U.S. Department of Housing and Urban Development (HUD) defines area             The ULI Terwilliger Center for Workforce Housing defines workforce households
    median income (AMI) for each metropolitan area. This indicator often is used        as those with incomes between 60 and 120 percent of AMI, adjusted for
    to determine relative housing affordability for different income ranges and         household size. Approximately 30 percent, or 820,000, of the Bay Area’s 2.7
    household sizes. The Bay Area includes six different Metropolitan Statistical       million households fell in this income range in 2007, indicating that workforce
    Areas (MSA) for which HUD defines an AMI.                                           housing is an issue relevant to a significant portion of the region’s households.

    Workforce Housing Income Ranges | 60% to 120% of AMI
    San Francisco Bay Area Average (varies by MSA)
                                              60% of AMI          120% of AMI
    One-Person Household                        $39,200               $78,500
    Two-Person Household                        $44,800               $89,700
    Three-Person Household                      $50,400              $100,900
    Four-Person Household                       $56,000              $112,000
    Five-Person Household                       $60,500              $121,000

                                                              Sources: HUD, RCLCO.

    Household Distribution
    San Francisco Bay Area
                                                                            Less than   60%–80%      80%–100% 100%–120% 120%–150%                  More than            TOTAL
                                                                            60% AMI         AMI           AMI       AMI       AMI                  150% AMI
    SAN FRANCISCO              Estimated Number of Households                825,390     306,341       276,401        237,341       299,273         793,464        1,912,820
    BAY REGION                 Distribution of Households                        29%         11%           10%            9%           11%              31%             100%
                                                                                          }                                           Sources: U.S. Census 2007 PUMA Data, RCLCO.

                                                                                                   30%
                                                                                                                          or 820,083 of the households in the nine-
                                                                                                                          county San Francisco Bay Region are in
                                                                                                                          the 60% to 120% AMI income range.
6
2009 Estimated Median Household                           $150,000+
Income by Census Block Group
San Francisco Bay Area                                    $100,000–$150,000

                                                          $50,000–$100,000

                                                          Less than $50,000

                                  Sources: Claritas, RCLCO.

                                                                              7
Workforce Household Profile
    Entry Level Engineer and Daycare Educator in San Jose
    (Dual-Income Household)

    Vital Statistics:
    •   Household Type: Working Parents, Two Children
    •   Profession: Engineer and Daycare Educator
    •   2009 Annual Household Income: $92,000
    •   2009 Affordable Home Price Range: $300,000–$350,000
    •   Required Downpayment: $30,000–$35,000
    •   Percent of AMI for Four-Person Household: 90%

    Locations with Affordable Median
    Home Values for Profiled Family
    2009
                                                                                                              The areas shown as
                                                                                                              affordable for this family
           Affordable
                                                                                                              contain only 7% of the
           Priced Out
                                                                                                              for-sale housing stock in
           Place of Employment
                                                                                                              Santa Clara County.

                                                          14% of the for-sale
                                                          housing in the Bay
                                                          Area is affordable to
                                                          this family.

8                                                                                 Sources: Claritas, RCLCO.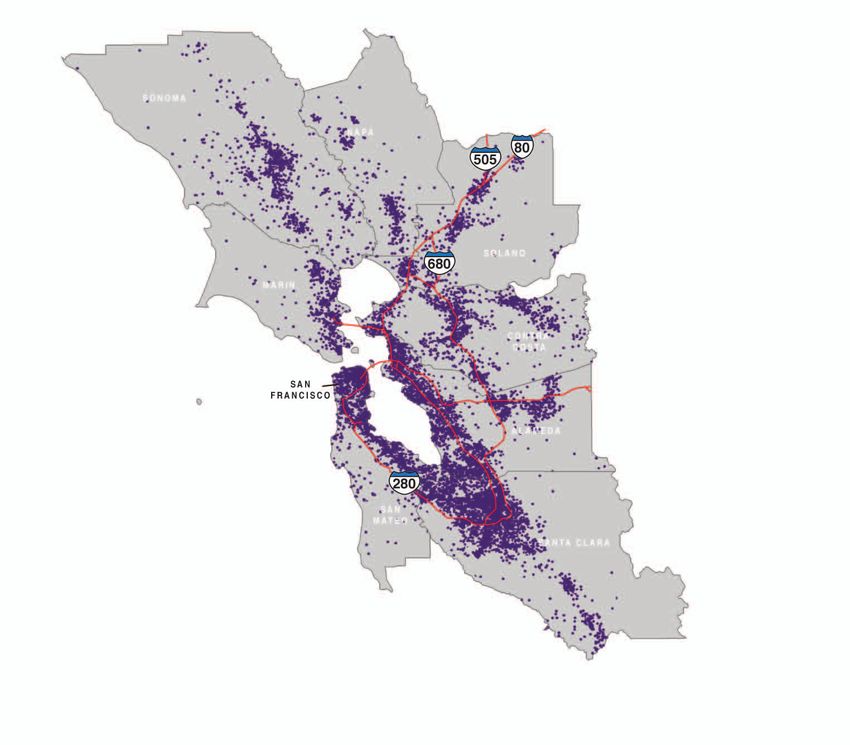
Metro Area Household Composition

A deeper analysis of the characteristics of          not significantly alter the overall distribution of                                               Workforce Household Composition in the
workforce households in the Bay Area reveals         household sizes in the near term. And while overall                                               San Francisco Bay Area
more about this group’s specific housing needs.      average household size is trending downward                                                       60% to 120% of AMI
An average of 40 percent of all households and       slightly, larger households       will continue to make
                                                                         Workforce Household Composition in the San Francisco Bay Region
                                                                                60%-120% of AMI
specifically workforce households are made up of     up a sizable portion of future growth, particularly
three or more people. This finding is significant,   among family workforce households. Households
because larger households require homes and/or       consisting of three or more individuals have highly
                                                                                                                                                                              27% 4+-Person                             28% 1-Person
apartments with more bedrooms, which typically       varied composition, including single- and dual-                                                                          Households                                Households
are more expensive.                                  parent households with children, multigenerational
                                                     households such as a couple with an older parent
Although recent demographic trends point toward      or parents, unrelated adults (e.g., roommates), and
an increasing number of smaller households as        others sharing a home for lifestyle preference or                                                                      15% 3-Person
echo boomers enter their 20s, divorce rates remain   cost reasons, and a variety of other combinations.                                                                     Households
                                                                                                                                                                                                                 30% 2-Person
                                                                                                                                                                                                                 Households
high, and baby boomers age, this trend likely will

                                                                                Source: U.S. Census 2007 PUMA Data, RCLCO

                                                                                                                                                                                                    1   2        3       4+
                                                                                2007 PUMA Data for All Counties in SF Bay Region incuded in our analysis

                                                                                Row Labels           100%-119% AMI            120%-149% AMI           150% of AMI or more    60%-79% AMI   Sources: RCLCO,
                                                                                                                                                                                                80%-99% AMI U.S. Census
                                                                                                                                                                                                               Less than 60% 2007
                                                                                                                                                                                                                             AMI  PUMA     data.
                                                                                                                                                                                                                                  Grand Total
                                                                                0                                                                                                                                                             174760
                                                                                1                                     64379                69543                    148523                 106780            75940            369358          834782
                                                                                2                                     81817               104228                    368595                  95182            91252            217515          958589
                                                                                3                                     44491                59262                    190848                  43243            49307            112568          499938
                                                                                4+                                    75260                95661                    264905                  93107            83644            197435          810481

                                                                                4                                     42503                   56982                 174352                  44305            44290             97885          460786
                                                                                5                                     20636                   24633                  61201                  27163            22530             58748          214911
                                                                                6                                      6556                    9170                  19776                  11365             9978             25009           81854
                                                                                7                                      3311                    3374                   4477                   6283             3955             10201           31601
                                                                                8 or more                              2254                    1502                   5099                   3991             2891              5592           21329

                                                                                                                                                                                                                                                       9
Employment Distribution                                                                                             Distribution of Employment by
                                                                                                                         Sector for Workforce Households:
                                                                                                                         San Francisco Bay Area
     Nearly every profession includes employees who
     fall into the workforce housing income range.
     The top categories of regional employment in
     the workforce housing income range, as shown
     in the accompanying pie chart, include health
                                                                                                  Health Care and Social Assistance
     care; manufacturing; professional, scientific, and                                                        10.9%

     technical services; and education.                                   All Other Occupation Categories
                                                                                       13.2%                                     Manufacturing
                                                                                                                                    10.9%

     Many of these professions are significant growth
     industries within the region and reflect its overall       Accommodation/Food Services
                                                                          4.6%
     distribution of employment by industry. As these
                                                                                                                            Professional, Scientific, and Technical Services
     industries continue to be engines of growth                 Finance and Insurance                                                            9.7%
                                                                         4.6%
     in the future, their employees will need to be
     accommodated with appropriate workforce                Admin/Support/Remediation Services
                                                                          4.8%
     housing options.
                                                                                                                                      Educational Services
                                                                          Other Services                                                     9.4%
                                                                              4.9%
     The ability to house key workforce housing
                                                                                  Government
     employment sectors — teachers, health care                                      5.0%
                                                                                                                            Retail Trade
                                                                                    Transportation/Warehousing                 8.3%
     workers, police officers, and firefighters, among                                         5.5%       Construction
                                                                                                             8.3%
     others — is vital to the economic sustainability of
     the Bay Area.

                                                                                                                                  Sources: U.S. Census 2007 PUMA data, RCLCO.

10
Concentration of Employees in the
San Francisco Bay Area
1 Dot = 200 Employees
Sources: Claritas, RCLCO.
11San Francisco Bay Area
Regional Supply Conditions
70% AMI
Most of the Bay Area’s for-sale housing supply is percent of the average median family income, it
unaffordable to workforce households. Pockets of is estimated that only 20 percent of the housing
affordability exist throughout the region, but they stock becomes affordable.
are scattered and represent less than 15 percent of
the total housing stock. Unlike most metropolitan These statistics are remarkable considering that
areas, the Bay Area’s periphery is no more afford- they reflect the situation in 2009 after home prices,
able to workforce households than its urban core. according to data published by Moody’s Case-
Schiller, have fallen by 40 percent or more from
A workforce household earning $65,000 per their 2006 peak. The workforce housing crisis here
year, or approximately 70 percent of the region’s is more pronounced than in many of the Bay Area’s
estimated median family income for the Bay Area, peer metropolitan areas, including Washington,
90% AMI
can afford to purchase only about 5 percent of D.C., and Boston, which offer substantially more
the total housing stock in the entire region. Even for-sale housing available to workforce households.
with a higher income of $102,000, or about 110
Comparison of For-Sale Affordability
Across Three Peer Metro Areas
Affordable
110% AMI
Priced Out
12Washington, D.C., Metropolitan Area Boston Metropolitan Area
As prices increased during the
real estate boom, some Bay Area
workers began moving to the
Central Valley, including Stanislaus
and San Joaquin counties, a
commute of two hours or longer
in many instances, and with
significant transportation cost
burden to the homeowner and
environmental impact to the region.
Since the boom went bust, prices
in this area have fallen dramatically
and the rate of foreclosures has
been among the highest in the
nation. While housing alone in the
Central Valley will likely remain
more affordable for the foreseeable
future, the depressed real estate
conditions, the added cost of
transit, and the extreme commute
times make it an undesirable
solution for Bay Area workforce
households.
13Workforce Household Profile
San Francisco State Associate Professor
(Single-Income Household)
Vital Statistics:
• Household Type: Single-Parent, One Child
• Profession: University Professor
• 2009 Annual Household Income: $101,000
• 2009 Affordable Home Price Range: $350,000–$380,000
• Required Downpayment: $35,000–$38,000
• Percent of AMI for Two-Person Household: 119%
Locations with Affordable Median
Home Values for Profiled Family The areas shown as
2009 affordable for this family
contain only 2% of the
for-sale housing stock in
Affordable
San Francisco County.
Priced Out
Place of Employment
19% of the for-sale
housing in the Bay
Area is affordable to
this family.
14 Sources: Claritas, RCLCO.High Rental Burden
As a result of the high for-sale home prices Percentage of Households that Rent by Income
60%
and other factors, workforce households in the
Bay Area remain in large measure in the rental
45%
market. Of the top 20 largest metro areas in the
country, only New York and Los Angeles have
30%
higher percentages of rental households in the
relevant workforce housing income groups.
15%
Census data from 2000 suggest that this high
propensity to rent is even more pronounced
0%
Atlanta Boston Chicago Denver Houston Los Angeles NewNewYork
Jersey-Long Washington, Top 20 Bay Area
among workforce families.
Atlanta-Sandy Springs-Marietta Chicago-Naperville-Joliet Houston-Sugar Land-Baytown New York-Northern Island Top 20 Metro Area Average
D.C. Metro Area
Average
Source: U.S. Census Bureau; American Community Survey 2008.
Choosing to rent may be a logical response
to a tight for-sale housing market; however,
Percentage of Renter Households Spending 30% or More
rents in the Bay Area are among the highest in
of Household Income on Rent
the country — and rents are not only high in 40%
downtown San Francisco; even Napa, the MSA
with the lowest rents in the Bay Area, has a 30%
higher median rent than the Boston, New York,
and Los Angeles metropolitan areas. This means 20%
that many workforce households, especially
families and those earning between 60 percent 10%
and 80 percent of AMI, still struggle to afford
rental housing. More than 30 percent of rental 0%
Atlanta
Atlanta-Sandy Springs-Marietta Boston Chicago
Chicago-Naperville-Joliet Denver Houston Los Angeles
Houston-Sugar Land-Baytown NewNewYork
New York-Northern Jersey-LongWashington,
Island Top 20
Top 20 Metro Area Average Bay Area
D.C. Metro Area
households in the Bay Area that earn between Average
$50,000 and $75,000 (roughly 60 percent to 80
$50,000–$75,000 Source: U.S. Census Bureau; American Community Survey 2008.
percent of AMI) spend more than 30 percent of
$75,000–$100,000
their income on rent. $100,000+
15Workforce Household Profile
Graphic Designer and Yoga Instructor in Alameda County
(Dual-Income Household)
Vital Statistics:
• Household Type: Married Couple, Three Children
• Professions: Graphic Designer and Yoga Instructor
• 2009 Annual Household Income: $78,540
• 2009 Affordable Home Price Range: $260,000–$300,000
• Required Downpayment: $26,000–$30,000
• Percent of AMI for Five-Person Household: 81%
Locations with Affordable Median
Home Values for Profiled Family The areas shown as
2009 affordable for this family
contain only 9% of the
Affordable for-sale housing stock in
Priced Out
Alameda County.
Place of Employment
9% of the for-sale
housing in the Bay
Area is affordable to
this family.
16 Sources: Claritas, RCLCO.New Rental Product Too Expensive
Additional high-quality rental housing could or more persons, is challenging, if not impossible, exist for the affordable segment of the marketplace
provide improved living opportunities for the Bay without creative public financing solutions and other (below 60 percent of AMI) is simply not feasible given
Area workforce and help fulfill the unmet demand. subsidy mechanisms that do not exist today. the price of land and the cost of construction.
To meet the needs of workforce families, rental
apartment communities need to offer housing with In the Bay Area, where construction costs are among Creatively exploring new financing techniques, public
more bedrooms for all income categories, as the the highest in the nation, the challenge becomes even policy solutions, approaches to lowering the cost
family housing need is the most dire. more severe. The rent that workforce households of construction, or other innovative development
can afford to pay is limited by their income (they are strategies will be necessary to address this critical
However, developing new rental products for this already spending more than their peers in other cities), issue and to provide adequate rental housing options
price range, particularly for households with three and new building without subsidies such as those that for workforce households.
Development-Supportable Rents for Workforce Households in the Bay Area
High-Rise Rental Development Supportable Rent per Square Foot for Workforce Households High-rise development dictated by land prices near
employment centers and transit.
Persons per Household Unit Type 60% 70% 80% 90% 100% 110% 120%
1 Studio $3.63 $4.00 $4.36
2 1B $3.20
3 2B
4 3B
PRICED OUT
5 3B
6 4B
Mid-Rise Rental Development Supportable Rent per Square Foot for Workforce Households Mid-rise development located in an urban area just
Persons per Household Unit Type 60% 70% 80% 90% 100% 110% 120% outside of employment center.
1 Studio $2.91 $3.27 $3.63 $4.00 $4.36
2 1B $2.94 $3.20
3 2B PRICED OUT $2.80
4 3B
5 3B
6 4B 17Future Supply Constraints
Despite a temporary correction in the housing A projection of future demand and supply suggests Workforce demand for new rental
market, the demand for additional housing in the that there will be a shortage of over 6,000 new housing, especially among those earning
Bay Area over the next 20 years will be immense. for-sale housing units affordable to workforce
between 60 and 100 percent of AMI, is
Between 2010 and 2030, the Association of households by 2025. This estimate, moreover, is
Bay Area Governments (ABAG) projects that likely conservative because it assumes that prices
projected to exceed supply by almost
the Bay Area will add over 500,000 households. do not rebound from their current lows. In reality, 23,000 units, resulting in a total shortage
Meeting the demand for workforce housing will the shortage could be substantially higher. of more than 29,000 workforce housing
be particularly challenging as most new housing
units in 2025.
construction in recent years has been out of the
reach of the vast majority of workforce
family households.
Future Supply and Demand for Workforce Housing in the Bay Area
30,000
22,500
15,000
7,500
0
2010 2011 2012 2013 2014 2015 2016 2017 2018 2019 2020 2021 2022 2023 2024 2025
Projected Workforce Housing Demand Projected Workforce New Housing Supply Cumulative Unmet Demand Sources: SOCDS, RCLCO.
18Conclusions
San Francisco suffers from a workforce housing Bay Area that they represent a significant strain on
Rents in the Bay Area are
shortage that is among the most acute and the finances of workforce families.
widespread in the nation. Despite the recent so high that they represent
housing market downturn, the high cost of housing Further, new rental housing appropriate to this
a significant strain on the
remains a critical challenge to the long-term group, particularly for families, is needed but not
economic health of the Bay Area. economically feasible to build in the Bay Area as finances of workforce
the rents needed to support new development are
Most major metropolitan regions exhibit a pattern well beyond the levels that are affordable to the
families — and new rental
in which workforce households cannot find workforce. New and innovative public policies that housing appropriate to this
affordable for-sale housing in neighborhoods incentivize the development of new properties with
convenient to major employment concentrations. rents affordable to the workforce will alleviate the
group is not economically
What distinguishes the Bay Area is that workforce growing shortage of workforce housing. feasible to build.
households are priced out of the for-sale housing
market almost entirely. There are no real “fringe” If current trends continue, new construction will
locations in the nine-county Bay Area where fail to meet the significant projected demand
workforce households can escape the high cost of for workforce housing. This will force even more
housing, even if they are willing to accept long and workforce households to stretch themselves
expensive commutes. financially to live in the Bay Area, or move to other
parts of the country where housing is affordable.
The for-rent market also provides profound and
pervasive affordability challenges to workforce Left unchanged, the pervasive and persistent
households, with Bay Area families allocating more housing burden of workforce households in the Bay
of their income to rent than their peers in other Area will imperil the region’s economic vitality.
major metropolitan regions. Rents are so high in the
20APPENDIX
21Methodology
Affordable Home Price data for the 20-minute drive-time area from each of the metro areas. Instead, workforce households
RCLCO used a 3.5 income-to-home price multiplier employment core to derive the relative over- or that own or rent pay a disproportionately high
to determine the affordable home price for each undersupply of workforce households for each percentage of income on housing compared with
income bracket and household size. This multiplier household size. their workforce counterparts in other major peer
was determined using the following assumptions: metropolitan regions.
a 10 percent downpayment, a 5.5 percent interest Interestingly, this analysis indicated that unlike
rate, a 30-year fixed mortgage, PMI of 0.5 percent other metropolitan regions that have been studied Future Supply Constraints
of the mortgage amount, and an estimated 1 to date, there does not appear to be a consistent ABAG projections were used to determine regional
percent of assessed value in annual property taxes. imbalance between employment concentrations household growth from 2010 to 2030. We used
and workforce housing. In peer metropolitan PUMA data to determine the percentage of
Bay Area Conditions & Balance/Imbalance regions, workforce households have generally total households with incomes between 60 and
Household size and income distribution of each been pushed to the periphery of the marketplace, 120 percent of AMI that are homeowners. This
employment core residential feeder area were creating a significant imbalance between the percentage was applied to the overall household
then compared to those of the region to estimate location of jobs and the amount of workforce growth figures to determine the projected average
the distribution of households that would exist if housing. In contrast, the Bay Area has a pervasive annual household growth for workforce households
each major employment core residential feeder housing unaffordability crisis, where workforce that seek for-sale housing options.
area were in relative balance (plus or minus 1,000 households generally do not even have the choice
households). These PUMA-based household to trade off the convenience of close-to-work The overall volume of new home sales was
distributions were applied to Claritas household housing for the affordability of housing on the fringe estimated using anticipated new household growth
22data from ABAG and future permit projections built each year, priced affordably for households the range of affordability for workforce households
from Moody’s Economy.com. Moody’s Economy. with incomes 60 to 120 percent of AMI. Future were not factored into this analysis. This will only
com data were used to calculate the proportion of new home sales projections were compared to the increase the need for more new homes to replace
for-sale versus rental residential permits likely to projected average annual new household growth to those no longer affordable to this group.
be issued and RCLCO applied this factor to ABAG determine the shortage in housing supply.
household growth forecasts in order to determine Data Sources
the annual projected for-sale housing and rental Similarly, the distribution of new apartments built RCLCO relied primarily on PUMA data from the
supply. For the purposes of this analysis, we between 2005 and 2007 by rent and number 2007 American Community Survey for demographic
assume that future permitting, or supply, will more of bedrooms based on 2007 PUMA data was information, including household size, tenure,
or less correlate with future household growth or applied to the forecasted rental permit issuance employment sector, and household income after
demand for housing. in each year, as described above, to determine adjustment to 2009 dollars. Except for the new
supply. Where the PUMA data indicated rents supply analysis described above, which required
The distribution of new home sales by price point that were clearly not feasible for new market-rate an assessment of the value of new homes only,
was identified for the Bay Area MSAs for homes construction, it was ignored. This supply was RCLCO used 2009 Claritas estimates to determine
built in 2005 to 2007 using PUMA data. This compared to the demand for each unit type based median home values by block group.
distribution, less a 30 percent price reduction to on ABAG household growth projections and 2007
account for market decline since 2007, was applied income, tenure, and household size distributions to
to the projected future for-sale residential permits determine the shortage in rental housing supply.
to determine the number of homes projected to be Home renovations that will take some homes out of
23A Related Report from the Terwilliger Center
Calculator
What do housing and transportation in the
Bay Area cost YOU?
Executiv
Find out with the Housing and Transportation
Cost Calculator.
Bay area Burden provides a comprehensive analysis of the “cost longer commutes on the environment and
The ULI Terwilliger Center for Workforce Housing is pleased to announce
of place” in nine counties located throughout the San Francisco
its Housing + Transportation Cost Calculator to the Bay Area to provide
region by examining the costs and consumers
impacts ofwith
housing and cost data to
up-to-date ImporTance of LocaTIon
make informed housing effIcIency
decisions
transportation on Bay Area residents, based on housing
their neighborhoods, and transportation
and costs.
This report exposes the complexity of the i
the environment. ing and transportation choices as well as e
To access the calculator, go to
unintended consequences on the natural e
www.bayareaburden.org.
The ImpacTs of hIgh housIng and TransporTaTIon cosTs they work at cross purposes. The report al
Bay Area households impo
The Terwilliger Center recently published a detailed report that exposes Housing Plus Transportation Costs in the Bay Area
spend an average of more effici
the complexity of the interaction of housing and transportation choices
than $28,000 annually on of ho
as well as expenditures, and the unintended consequences on the natural average annual average annual average annual housing
housing—about 39 percent housing costs Transportation costs + Transportation costs tion h
environment when they work at cross purposes. The report also highlights the
+ =
of the area median income. $28,045 $13,375 $41,420 retail
importance of “location efficiency”—the proximity of housing to transportation
In addition
hubs, employment, and retail centers—as a driver to the highand
of both affordability of bo
% of Income % of Income % of Income
environmental sustainability. cost of housing, Bay Area 39% 20% 59% envir
households spend nearly
$13,400 annually on transportation. Combined, this cost bur- aLIgnIng Land use, housIng, and TransporT
den of $41,420 per year represents 59 percent of the median Land use decisions play a critical role in de
household income in the Bay Area. The high combined costs ability of housing that is affordable to Bay A
24 of housing and transportation leave many Bay Area households in locations that are near employment centYou can also read