Pre and postmenopausal women have different core urinary microbiota
←
→
Page content transcription
If your browser does not render page correctly, please read the page content below
www.nature.com/scientificreports
OPEN Pre‑ and postmenopausal women
have different core urinary
microbiota
Nadia Ammitzbøll1,2, Benedikt Paul Josef Bau3, Caspar Bundgaard‑Nielsen1,2,
Annemarie Brusen Villadsen1,2, Ann‑Maria Jensen1, Peter Derek Christian Leutscher1,2,
Karin Glavind2,4, Søren Hagstrøm1,2,5, Louise Thomsen Schmidt Arenholt1,2,3 &
Suzette Sørensen1,2*
Recent studies suggest that alterations in the female urinary microbiota is associated to development
of bladder disease. However, the normal microbiota composition and variation in healthy women
are poorly described. Moreover, the effects of hormonal changes on microbiota during menopause
is not well understood. The aim of our study was to investigate the urinary microbiota in healthy
pre- and postmenopausal women without urinary tract symptoms. Microbiota composition in
catheterized urine samples was mapped using 16S rRNA gene sequencing. In total, 41 premenopausal
and 42 postmenopausal women were initially included. Samples with first PCR amplification
concentration below level of the negative control were excluded, resulting in 34 premenopausal
and 20 postmenopausal women included in data analysis. Urine from postmenopausal women
showed significantly higher alpha diversity compared to premenopausal women. Lactobacillus
was the most abundant bacteria in both groups, however the relative abundance of Lactobacillus
accounted for 77.8% in premenopausal versus 42.0% in postmenopausal women. In conclusion, urine
from premenopausal mostly presented with Lactobacillus dominated urotypes, whereas urine from
postmenopausal women presented a more diverse urinary microbiota with higher abundance of the
genera Gardnerella and Prevotella. The clinical and pathophysiological implications of this difference
remain to be elucidated.
The human urinary microbiota has recently received much attention in connection to bladder health and func-
tion. Based on standard culturing methods, urine from healthy bladders has traditionally been considered sterile.
Application of more sensitive and specific techniques, such as next generation sequencing and enhanced urine
culturing, has revealed the presence of a naturally dwelling bacterial community in urine from healthy individu-
als without urinary tract s ymptoms1–4. Previous studies have reported that the female urinary microbiota can be
divided into different urotypes, depending on their dominant bacterial genera. Some disagreement exists regard-
ing the number of urotypes, depending on collection and analysis methods5–9. However, the studies agree that the
majority of women have a urotype dominated by Lactobacillus, together with other common bacteria, including
Gardnerella, Prevotella, and Streptococcus1,2,9,10. The function and implications of the urinary microbiota is largely
unexplored. However, the first studies are emerging, pointing towards an association between a dysbiotic urinary
microbiota and bladder disorders such as urgency urinary incontinence (UUI)5,11–13, overactive bladder (OAB)14,
neuropathic bladder15, and recurrent urinary tract infections (rUTI)16. Whether there is a causal relationship
between this altered microbiota and urinary tract disease remains unknown.
UUI, OAB, and rUTIs are common in women of all ages, with an increased risk after m enopause17–19. The
underlying etiology is unclear, however, a plausible explanation may be found in possible age- or hormonal
status dependent differences in the urinary m icrobiota9,20–22. Microbiota alterations in relation to age and/or
hormone changes during menopause have been observed in other microbial niches such as the gut and vaginal
microbiota23,24. In the vaginal microbiota, a study reported that the bacterial composition was dependent on
menopausal status, in which Lactobacillus was more dominant in pre- and perimenopausal women compared
1
Centre for Clinical Research, North Denmark Regional Hospital, Bispensgade 37, 9800 Hjørring,
Denmark. 2Department of Clinical Medicine, Aalborg University, Aalborg, Denmark. 3Department of Gynecology
and Obstetrics, North Denmark Regional Hospital, Hjørring, Denmark. 4Department of Obstetrics and Gynecology,
Aalborg University Hospital, Aalborg, Denmark. 5Department of Pediatrics, Aalborg University Hospital, Aalborg,
Denmark. *email: suzette.soerensen@rn.dk
Scientific Reports | (2021) 11:2212 | https://doi.org/10.1038/s41598-021-81790-8 1
Vol.:(0123456789)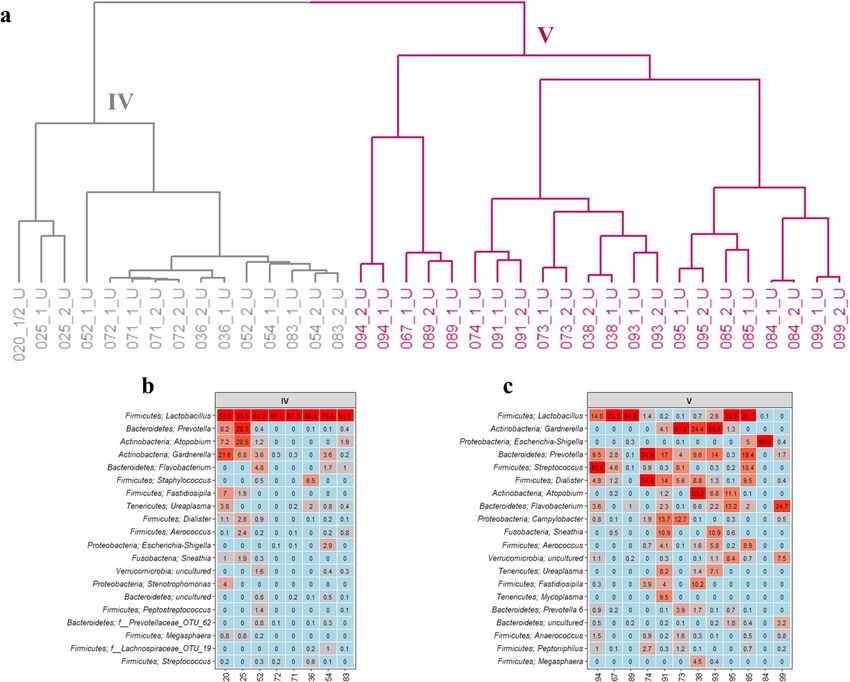
www.nature.com/scientificreports/
Participants Premenopausal Postmenopausal
n = 83 n = 41 (49.4%) n = 42 (50.6%)
Age
Range 18 – 49 55 – 81
Mean (Years (± SD)) 37.2 (± 9.5) 63.3 (± 6.9) p = 4.35 × 10⁻¹⁵
BMI
Mean (kg/m2 (± SD)) 26.4 (± 5.2) 25.8 (± 4.4) p = 0.067
Smoking status (n (%))
Never 19 (46.3%) 29 (69.0%) p = 0.095
Previously 17 (41.5%) 11 (26.2%) p = 0.095
Currently 5 (12.2%) 2 (4.8%) p = 0.095
Total births (n(± SD))
Mean births 1.6 (± 1.2 SD) 2.5 (± 1.0 SD) p = 0.002
Mean caesarean section 0.4 (± 0.7 SD) 0.2 (± 0.7 SD) p = 0.039
Table 1. Demographic characterization of study participants.
to postmenopausal w omen24. Additionally, local vaginal estrogen treatment in postmenopausal women have
shown increased level of Lactobacillus in the v agina25 and the b
ladder26. Both local vaginal estrogen treatment
and treatment with Lactobacillus supplements in patients suffering from rUTIs reduces the risk of infections25,27,28.
Together, this indicate a possible role of estrogen level on the urinary microbiota composition. Therefore, we
aimed at investigating the female urinary microbiota in healthy pre- and postmenopausal women to study if the
urinary microbiota of the bladder varies with age and/or menopausal status.
Results
In this study, 87 women were included of which 43 were premenopausal women and 44 postmenopausal women.
Four women were subsequently excluded based on a positive standard urine culturing, leaving 41 premenopausal
(mean age 37 ± 9.5 years) and 42 postmenopausal (mean age 63 ± 6.9 years) women in the final study. All women
were ethnic Danes. Characteristics such as BMI and smoking status were comparable between the two groups
(Table 1). The postmenopausal women had a higher mean number of total births but less caesarean sections
compared to premenopausal women.
DNA purification from the urine samples showed presence of DNA, albeit for some samples at low concentra-
tions, ranging from below 1 ng/mL urine to 15,000 ng/mL urine. To avoid miss- or over-interpretation of bacte-
rial status, the DNA concentration was subsequently evaluated after the initial PCR during library preparation
for 16S ribosomal RNA (rRNA) gene sequencing. Samples that produced lower DNA concentrations following
library generation, compared to the negative controls, were excluded in all subsequent analyses (supplementary
Fig. S1a). This resulted in urine samples from 29 women being excluded, leaving 34 women in the premenopausal
group and 20 women in the postmenopausal group in the data analysis. Subgroup analyses revealed that the
excluded women were older (p = 0.021), contained fewer active smokers (p = 0.036 and 0.030 for all women and
postmenopausal women only, respectively), and that there was a higher proportion of postmenopausal women
among the excluded women compared to the included women (p = 0.017). No differences were observed in
BMI and age after accounting for the variation in number of premenopausal and postmenopausal women (sup-
plementary Fig. S2). After removal of these samples, quality filtering, and chimera removal, a total of 2,467,401
reads were obtained with a mean number of 24,674.01 reads per sample. A total of 2,449 unique Operational
Taxonomic Units (OTUs) were identified, with 93.14% being identified at the phylum taxonomic level, 50.84%
at the genus level, and 0.08% at the species level. A rarefaction curve showed good sequencing coverage (sup-
plementary Fig. S1b).
The urinary microbiota in premenopausal women is different from that of postmenopausal
women. When comparing the bacterial composition in urine from premenopausal women with that of post-
menopausal women, we observed a statistically significant difference in alpha diversity. A significantly lower
OTU richness (p = 0.004), Pielou evenness (p = 0.010), and Shannon diversity index (p = 0.005) was observed
in the urine of premenopausal women compared to that of postmenopausal women (Fig. 1a–c). Beta diver-
sity was analyzed, using Principal Coordinates Analysis (PCoA), showing a segregation of pre- and postmeno-
pausal women (Fig. 2a). We investigated the resulting clusters using hierarchical cluster analysis and observed
that the urinary microbiota separated into three distinct urotypes. Two of the urotypes were predominantly
found amongst premenopausal women, whereas the last urotype was mostly observed amongst postmenopausal
women (Fig. 2c). Heatmap representation of the 20 most abundant genera showed that urine of both the pre- and
postmenopausal women were dominated by the Lactobacillus genus (Fig. 2b), however, the relative abundance
of these were markedly lower in the postmenopausal women (42.0%) compared to the premenopausal women
(77.8%, Benjamin-Hochberg corrected p value < 0.01). Instead, the postmenopausal women appeared to have a
broader representation of different bacteria, as supported by the higher alpha diversity, including higher relative
abundances of Gardnerella, Prevotella, Escherichia-Shigella, Atopobium, Streptococcus, and Dialister.
Scientific Reports | (2021) 11:2212 | https://doi.org/10.1038/s41598-021-81790-8 2
Vol:.(1234567890)
www.nature.com/scientificreports/
Figure 1. Alpha-diversity of the urinary microbiota in pre- and postmenopausal women depicted using (a)
Number of observed OTUs, (b) Pielou’s evenness index, and (c) Shannon diversity index.
Figure 2. The bacterial composition in urine samples from pre- and postmenopausal women. (a) PCoA plot
using Bray Curtis dissimilarity. Three urotypes were identified, as indicated with green, purple and orange
circles. (b) Heatmap, indicating the 20 most abundant bacterial genera in the urine, as well as percentage of
total OTUs. Red and blue respectively indicates high and low relative abundance. *Benjamin Hochberg adjusted
p value < 0.01. (c) Dendrogram obtained with hierarchical clustering of OTU diversity in samples, based on
the PCoA plot. Branch colors represent urotype, while label color represent menopausal state: red indicate
premenopausal women, whereas blue represent postmenopausal women.
Since we observed different urotypes in the two groups, we analyzed pre- and postmenopausal women sepa-
rately, to determine if variations in core microbiota existed within the groups.
Hierarchical cluster analysis demonstrated that the bacterial composition of the premenopausal women sepa-
rated into three urotypes (Fig. 3a). In urotype I, representing the majority of premenopausal women, Lactobacillus
was the primary genus accounting for a high relative abundance with a small contribution from Gardnerella
(Fig. 3b). The second urotype, urotype II, was likewise dominated by Lactobacillus (Fig. 3c) with secondary con-
tributions from Flavobacterium, Ureaplasma, and Enhydrobacter. In addition to these Lactobacillus-dominated
urotypes, a third urotype, urotype III, appeared with a more mixed bacterial distribution (Fig. 3d).
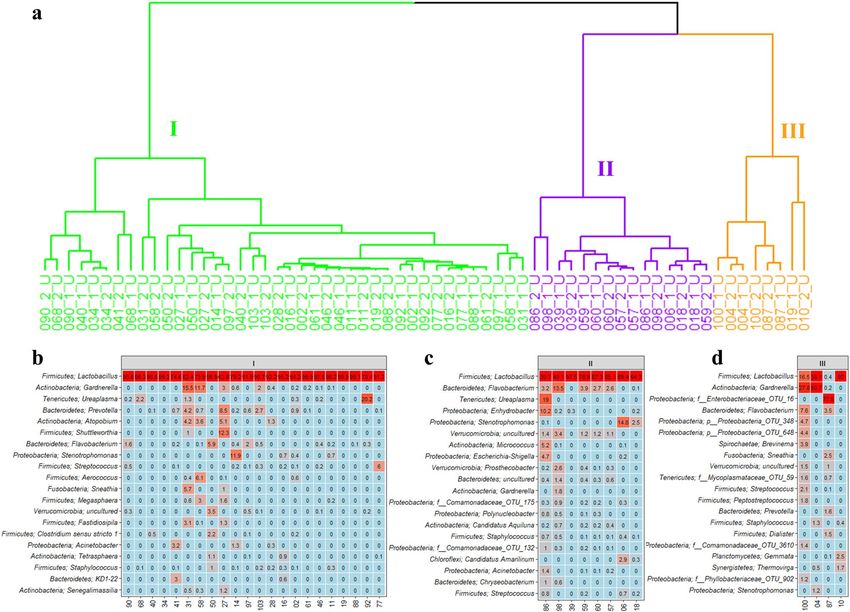
The postmenopausal women were similarly grouped into two separate urotypes (Fig. 4a). The first urotype of
postmenopausal women, urotype IV, showed high similarity to urotype I and II for premenopausal women by
Scientific Reports | (2021) 11:2212 | https://doi.org/10.1038/s41598-021-81790-8 3
Vol.:(0123456789)www.nature.com/scientificreports/
Figure 3. The bacterial composition in urine samples from premenopausal women. (a) Dendrogram obtained
with hierarchical clustering of OTU diversity in samples. Three urotypes were identified, with green, purple and
orange branches representing urotype I, II, and III respectively. (b–d) Heatmaps showing the 20 most abundant
bacterial genera in the three urotypes, I, II and III. The premenopausal donors 2, 4, and 6 were not placed in any
clusters by the unsupervised clustering algorithm used.
being highly dominated by Lactobacillus (Fig. 4b). In contrast, the second urotype, urotype V, was defined by a
highly diverse bacterial composition with less abundant Lactobacillus and higher contributions from Gardnerella,
Escherichia-Shigella, Prevotella, Streptococcus, Dialister, Atopobium, and Flavobacterium (Fig. 4c).
To evaluate whether differences in age, and thereby proximity to menopause, could explain what urotype
defined the women, we compared the mean ages of the participants in each urotype. There was no significant
difference in the mean age between premenopausal women with urotype I, II, or III (Fig. 5a), indicating that
the low-Lactobacillus profile observed in urotype III was not associated with age. Conversely, the two urotypes
observed amongst the postmenopausal women appeared to be defined by age (p = 0.041, Fig. 5a) but not by time
since last menstruation (Fig. 5b). This indicates that after menopause, the age of the women may influence the
composition of the urinary microbiota.
Discussion
The composition and normal variation in the urinary microbiota throughout life in healthy women is poorly
described, and the effects of hormonal changes, especially during menopause, is not well understood. Our study
showed that pre- and postmenopausal women have different core urinary microbiotas, with a predominance
of Lactobacillus in both groups, but a lower abundance of Lactobacillus together with more mixed composition
in postmenopausal women. Our results are partly in line with previous studies detecting the bacterial popula-
tion in healthy females, showing that the urinary microbiota of healthy women is dominated by a few genera,
including Lactobacillus, Gardnerella, and Prevotella3,5,10,11,15,28. These studies, however, vary in age criteria for
study participants and often describe a mixed representation of women ranging from young premenopausal
women to late postmenopausal women. Similar to our study, Price et al.9 compared the urinary microbiota from
catheterized samples between pre- and postmenopausal women. They reported Lactobacillus to be the most
common urotype (defined by > 50% relative abundance), however, it appeared that this was not associated with
age or menopausal status. The reason for this discrepancy between their and our results are unknown, but it may
be explained by differences in age or ethnicity. Moreover, methodical differences may also explain some of the
differences, as Price et al.9 included enhanced bacteria culture together with their 16S rRNA gene sequencing
Scientific Reports | (2021) 11:2212 | https://doi.org/10.1038/s41598-021-81790-8 4
Vol:.(1234567890)www.nature.com/scientificreports/
Figure 4. The bacterial composition in urine samples from postmenopausal women. (a) Dendrogram obtained
with hierarchical clustering of OTU diversity in samples. Two urotypes were identified, with grey and mangenta
colored branches representing urotype IV and V respectively. (b,c) Heatmaps showing the 20 most abundant
bacterial genera in the two urotypes.
Figure 5. Demographics of the urotypes from pre- and postmenopausal women. (a) Age of the different
urotypes in pre- and postmenopausal women. (b) Months since last menstruation for postmenopausal women.
* p = 0.041.
Scientific Reports | (2021) 11:2212 | https://doi.org/10.1038/s41598-021-81790-8 5
Vol.:(0123456789)www.nature.com/scientificreports/
results. In contrast, we only used 16S rRNA gene sequencing and some bacteria may therefore be differentially
detected. As an example, in the culture data from Price et al.9 they found a high number (9.4%; defined by > 50%
relative abundance) of women with a Streptococcus dominated urotype, whereas we only identified one woman
(1.2%) in our study, with > 40% relative abundance of Streptococcus. However, similar to our results, the 16S
rRNA gene sequencing data from Price et al.9 reported lower relative abundance of Streptococcus, indicating that
methodically differences highly impact the results.
It is well known that low alpha diversity, with predominant Lactobacillus colonization of the vaginal flora is
imperative for vaginal h ealth29,30 and that a reduction in Lactobacillus abundance may cause vaginal d isease30.
31
Since the vaginal and urinary microbiotas appear to have functional and structural o verlaps it is reasonable
to presume that a urotype with low relative abundance of Lactobacillus in urine, may be an indicator of bladder
dysbiosis and therefore constitutes an increased risk of developing bladder disorders. In our study, the major-
ity of the premenopausal women belonged to one of two urotypes characterized by high relative abundance of
Lactobacillus; however, we observed a small subgroup of participants belonging to a more mixed urotype, with
a lower relative abundance of Lactobacillus. This could represent a dysbiotic urinary microbiota putting these
women in higher risk of experiencing future bladder related diseases. In line with this, younger women with a low
or moderate-Lactobacillus dominated urotype have been found to be associated with mixed urinary incontinence,
pointing towards a dysbiosis in women lacking Lactobacillus32. Conversely, it might represent personal variations
in the urinary microbiota or be influenced by temporal factors that could change the microbial composition,
such as menstruation or c oitus33.
The menopausal reduction of estrogen has been shown to cause a decrease in the level of free glycogen in the
vaginal epithelium in postmenopausal women34. As glycogen serves as nutrition for the Lactobacillus, a reduced
level of Lactobacillus in the vagina is observed34,35. Therefore, transition to a less Lactobacillus dominated urotype
in postmenopausal women might be a result of decreasing levels of estrogen24. In our study, the postmenopausal
women with the Lactobacillus dominated urotype, urotype IV, were significantly younger than the women in
urotype V. However, this was not related to time since last menstruation, and it is thus unclear if the bacterial
variations was related to fluctuations in hormonal levels. Studies investigating the direct role of estrogen on the
urinary microbiota are thus urgently needed, in order to evaluate the role of hormonal changes on the bacterial
composition in the bladder.
UUI, OAB and other lower urinary tract symptoms are common in elderly women affecting around 12–55%18
and the cause behind this may be the altered urinary microbiota following menopause36. When looking at the
vaginal microbiota, women with lack of Lactobacillus spp., especially the loss of peroxide-producing Lactobacilli,
have increased risk of genital disease, including bacterial vaginosis, increased risk of susceptibility of sexually
transmitted infections, pre-term delivery, miscarriage, and pelvis inflammatory d isease37,38. If the same is true for
the urinary microbiota, decrease in Lactobacillus abundance could make the women more prone to urinary tract
disorders. Previous studies5,6,39 have reported an altered bacterial composition in women suffering from UUI,
characterized by a more diverse and rich bacterial composition, higher abundance of Gardnerella, and signifi-
cantly decreased Lactobacillus compared to healthy controls. These results match our findings in the postmeno-
pausal group. Neither Pearce et al.5 nor Thomas-White et al.6 used age- and menopausal status matched controls
for the two groups (women with UUI being significantly older), and the observed variations may therefore reflect
age differences rather than disease state. Furthermore, Price et al.39 utilized expanded quantitative urine culture
to asses bacterial abundance, which has been demonstrated to result in different bacterial compositions of urine
compared to 16S rRNA gene s equencing9. Intriguingly, the urinary microbiota profile of the postmenopausal
women in our study bear high resemblance to what has been reported for the women with U UI5,6. Notably, in a
study by Karstens et al.11 using age- and menopausal matched controls, they did not find any difference in alpha
diversity or in relative abundances of Gardnerella and Lactobacillus between UUI patients and controls. Larger
studies, however, on UUI are needed to conclude on a role of the urinary microbiota in UUI disease. Our study
demonstrates that age and menopausal status should be considered in future studies on urinary microbiota and
that pre- and postmenopausal women cannot be compared to each other due to significant different microbiota
composition.
A number of limitations in our study need to be addressed. First, four asymptomatic women were excluded
based on a positive standard urine culture. Uropathogens, specially E.coli, has however been found above the
typical threshold in asymptomatic women in the study by Price et al.40, indicating that exclusion of these four
women could have impacted our results. In future studies, one should include women with a positive standard
urine culture if they have no clinical symptoms of urinary tract infection. Second, the use of 16S rRNA gene
sequencing only allowed us to reliably classify bacteria at phylum and genus level, and specific variation at spe-
cies level was therefore not evaluated. Studies have previously implicated Lactobacillus species, like L. gasseri
and L. iners, to play a function in bladder diseases such as UUI and neuropathic b ladder5,41, indicating that dif-
ferent Lactobacillus species may have different functional effects on bladder health. Third, use of 16S rRNA gene
sequencing and enhanced bacteria culture may give different urinary microbiota r esults9 and one may argue that
both methods should be included to proper reflect the microbiota of the bladder. Fourth, we only collected urine
at a single timepoint, and as the bacterial composition has been shown by some to fluctuate over t ime33, this
possible lack of temporal stability may have impacted the results. We have, however, previously shown that the
composition of the urinary microbiota remains stable over a shorter time period42. Finally, we did not account
for other factors that could potentially influence the urinary microbiota, such as diet43, fluid intake, urinary
oxygen concentrations44, menstruation c ycle33, sexual a ctivity33, and vulvo-vaginal s ymptoms45,46. This could in
particular be a limitation since these would be expected to differ highly between our two groups.
However, this study also has strengths. This is one of the first studies investigating a difference between pre-
and postmenopausal women using catheterized urine samples instead of midstream urine samples, minimizing
vulva-vaginal contamination1,47 and thereby likely giving a more representative picture of the urinary microbiota.
Scientific Reports | (2021) 11:2212 | https://doi.org/10.1038/s41598-021-81790-8 6
Vol:.(1234567890)www.nature.com/scientificreports/
For instance, a relatively high number of samples were excluded due to DNA concentrations being below negative
control cut-off levels (after the initial PCR reaction in library preparation). This is consistent with other studies
investigating urine obtained by transurethral c atheterization1,5,6,12, and may not be a technical issue, but rather
reflect a biologically relevant variation in urinary bacterial content. Importantly, the excluded women were older
and less likely to be smokers, which corroborate this theory. Studies using voided urine, in contrast, obtained a
higher bacterial DNA y ield2,48,49, suggesting contamination with urethral bacteria. Moreover, in our statistical
analyses possible confounders including smoking status, age, and BMI have been taken into account, increasing
the strength of the study. Additionally, we included duplicates of our urine samples increasing the reproducibility
of our results. Finally, the characterization of study participants regarding in- and exclusion criteria is highly
well defined; e.g. by the use of two validated symptom questionnaires.
Conclusion
This study demonstrated that pre- and postmenopausal women overall possess different urinary microbiotas.
Urine from women prior to menopause was dominated by Lactobacillus whereas postmenopausal women tended
to display a more diverse urinary microbiota. Moreover, in healthy women, a normal variation in urinary micro-
biota might be present and a shift in urinary microbiota may occur during menopause that need to be empha-
sized when investigating dysbiosis of the bladder. Results from our study extend the knowledge of the normal
microbiota in women and the role of age and/or menopausal stage on the microbial composition.
Methods
Study participants and clinical data. Women were recruited by advertisement on social medias and in
the newspaper. The study was approved by The North Denmark Region Committee on Health Research Ethics
(N-20170050) and all women provided informed consent. The investigation was conducted according to the
principles expressed in the Declaration of Helsinki. The study was registered at the Danish Data Protection
Agency.
The premenopausal group consisted of non-pregnant women aged 18–50 years, while postmenopausal women
were aged > 55 years and without vaginal bleedings within one year of study inclusion. Exclusion criteria for
both groups included bladder symptoms, antibiotic treatment within three months prior to inclusion, recurrent
cystitis (> 2 per year) or current UTI evaluated by a positive urine culture of the collected urine sample. For the
postmenopausal group, use of hormonal replacement therapy (oral and topical) was considered an exclusion
criterion. Clinical assessment of bladder symptoms was evaluated by two questionnaires designed to measure
frequency and severity of urinary incontinence; the International Consultation on Incontinence Questionnaire
(ICIQ) Urinary Incontinence Short Form (ICIQ-UI-SF)50 and Overactive Bladder (ICIQ-OAB)51. Additional
data was collected, including menstrual status, use of hormonal contraceptives, BMI, age, caesarean section,
and previous births.
Urine collection. All samples were collected at the Department of Obstetrics and Gynecology, North Den-
mark Regional Hospital, using a CH/FR 12/4.0 mm urinary catheter (SpeediCath, Coloplast Denmark) for ster-
ile intermittent catheterization. Prior to catheter insertion, the urethral meatus was cleaned with sterile water.
Urine was collected in a 50 mL collection tube, aliquoted into 10 mL fractions within 15 min, and immediately
placed at -80 °C until further processing. Ten mL of urine was collected in a Urine Monovette with boric acid
(Saarstedt, Germany) for standard urine culture at the Department of Clinical Microbiology, Aalborg University
Hospital.
DNA extraction. From 10 mL of urine, bacterial DNA was isolated using the QIAamp Viral RNA Mini
Kit (Qiagen) according to manufacturer´s recommendations, modified with a pre-treatment step, as previously
explained42. All samples were extracted and analyzed as duplicates. Briefly, before DNA extraction, urine sam-
ples were centrifuged at 3,220 × g for 20 min. Pellets were resuspended in lysis buffer and a bead beating step
was included using the TissueLyser LT (Qiagen) for 2 min at 30 Hz with a 5 mm stainless steel bead. DNA yield
was measured by fluorometric quantification using the Qubit 4 Fluorometer (Thermo Fisher) with the Qubit
dsDNA Broad Range Assay Kit (Thermo Fisher). Reagent and procedure contamination controls were included
by performing the DNA extraction on Nuclease-free water.
16S rRNA Gene Sequencing and bioinformatics. Bacterial composition of urine samples were evalu-
ated by 16S rRNA gene sequencing, targeting the V4 hypervariable region, on the Illumina MiSeq platform.
Library preparation and sequencing was performed by DNASense (Denmark), as previously described52,
using ≤ 5 ng/µL DNA for library preparation. For error rate estimation during sequencing, a 20% PhiX control
library (Illumina) was used. A second negative control, consisting of nuclease-free water, was sequenced to elim-
inate background contaminants. Finally, a positive control (complex bacteria sample obtained from an anaerobic
digester system) was used to monitor sequencing efficiency and minimize batch effects.
Forward reads were trimmed for quality using Trimmomatic v. 0.3253 utilizing settings: SLIDINGWIN-
DOW:5:3 and MINLEN:250 to remove poor quality reads and discard reads < 250 bp in length. Reads were
dereplicated and processed using the UPARSE pipeline54. Dereplicated reads were clustered using the usearch v.
7.0.1090 command “-cluster_OTUs” with default settings, and OTUs were formed based on 97% identity, using
the “-usearch_global”. Finally, bacterial taxonomy was assigned using the RDP c lassifier55, with the command
“parallel_assign_taxonomy_RDP.py” in Q IIME56 and the MiDAS database v.1.2057.
Scientific Reports | (2021) 11:2212 | https://doi.org/10.1038/s41598-021-81790-8 7
Vol.:(0123456789)www.nature.com/scientificreports/
Statistics. Data analysis was performed using R version 3.6.158 through the Rstudio IDE (http://www.rstud
io.com/). 16S rRNA data was analyzed using the ampvis2 package v.2.4.1259. Alpha diversity was determined
using OTU richness and Shannon diversity index, whereas β diversity was determined using PCoA based on
Bray–Curtis distance measures. To further analyze differences and similarities, we performed unsupervised
hierarchical cluster analysis on the Euclidian distance between OTUs, and visualized the results with dendro-
grams, using the dendextend package v. 1.13.260. This dendrogram was furthermore used to classify urotypes.
To determine OTUs with statistically significant distributions in pre- and postmenopausal women, we used the
DESeq2 package v.1.24.061 to generate multiple hypothesis corrected p values using the Benjamini–Hochberg
procedure62.
For continuous data, like OTU richness, Shannon diversity index, age etc., distribution and variance were
assessed using Shapiro-Wilks test and Bartlett’s test, respectively. Normal distributed data with equal variance
were compared using Student´s t-test or ANOVA followed by Tukeys post hoc test. Non-parametric data were
compared using Mann–Whitney-Wilcoxon test or Kruskall-Wallis test followed by Dunn’s post hoc test. A p
value of < 0.05 was considered significant for all statistic tests, whereas for multiple hypothesis corrected p values,
a padj of < 0.01 was required.
Data availability
All data generated or analyzed in the study, are included in this published article and its supplementary informa-
tion files. Sample information (supplementary_metadata) and OTU-tables (Supplementary_Otutable) generated
during sequencing and used for bioinformatics are included as supplementary files.
Received: 15 April 2020; Accepted: 4 January 2021
References
1. Wolfe, A. J. et al. Evidence of uncultivated bacteria in the adult female bladder. J. Clin. Microbiol. 50, 1376–1383 (2012).
2. Siddiqui, H., Nederbragt, A. J., Lagesen, K., Jeansson, S. L. & Jakobsen, K. S. Assessing diversity of the female urine microbiota by
high throughput sequencing of 16S rDNA amplicons. BMC Microbiol. 11, 244 (2011).
3. Hilt, E. E. et al. Urine is not sterile: use of enhanced urine culture techniques to detect resident bacterial flora in the adult female
bladder. J. Clin. Microbiol. 52, 871–876 (2014).
4. Khasriya, R. et al. Spectrum of bacterial colonization associated with urothelial cells from patients with chronic lower urinary
tract symptoms. J. Clin. Microbiol. 51, 2054–2062 (2013).
5. Pearce, M. M. et al. The female urinary microbiome: a comparison of women with and without urgency urinary incontinence.
MBio 5, e01283-e1314 (2014).
6. Thomas-White, K. J. et al. Incontinence medication response relates to the female urinary microbiota. Int. Urogynecol. J. 27, 723–733
(2016).
7. Gottschick, C. et al. The urinary microbiota of men and women and its changes in women during bacterial vaginosis and antibiotic
treatment. Microbiome 5, 99 (2017).
8. Kramer, H. et al. Diversity of the midstream urine microbiome in adults with chronic kidney disease. Int. Urol. Nephrol. 50,
1123–1130 (2018).
9. Price, T. et al. The urobiome of continent adult women: a cross-sectional study. BJOG Int. J. Obstet. Gynaecol. https://doi.
org/10.1111/1471-0528.15920(2019).
10. Mueller, E. R., Wolfe, A. J. & Brubaker, L. Female urinary microbiota. Curr. Opin. Urol. 27, 282–286 (2017).
11. Karstens, L. et al. Does the urinary microbiome play a role in urgency urinary incontinence and its severity?. Front. Cell. Infect.
Microbiol. 6, 78 (2016).
12. Pearce, M. M. et al. The female urinary microbiome in urgency urinary incontinence. Am. J. Obstet. Gynecol. 213(347), e1-11
(2015).
13. Schneeweiss, J., Koch, M. & Umek, W. The human urinary microbiome and how it relates to urogynecology. Int. Urogynecol. J. 27,
1307–1312 (2016).
14. Curtiss, N. et al. A case controlled study examining the bladder microbiome in women with Overactive Bladder (OAB) and healthy
controls. Eur. J. Obstet. Gynecol. Reprod. Biol. 214, 31–35 (2017).
15. Fouts, D. E. et al. Integrated next-generation sequencing of 16S rDNA and metaproteomics differentiate the healthy urine micro-
biome from asymptomatic bacteriuria in neuropathic bladder associated with spinal cord injury. J. Transl. Med. 10, 174 (2012).
16. Jung, C. & Brubaker, L. The etiology and management of recurrent urinary tract infections in postmenopausal women. Climacteric
https://doi.org/10.1080/13697137.2018.1551871 (2019).
17. Coyne, K. S. et al. The prevalence of lower urinary tract symptoms (LUTS) in the USA, the UK and Sweden: results from the
Epidemiology of LUTS (EpiLUTS) study. BJU Int. 104, 352–360 (2009).
18. Irwin, D. E. et al. Population-based survey of urinary incontinence, overactive bladder, and other lower urinary tract symptoms
in five countries: results of the EPIC study. Eur. Urol. 50, 1306–1315 (2006).
19. Raz, R. Urinary tract infection in postmenopausal women. Korean J. Urol. 52, 801 (2011).
20. Curtiss, N. et al. Age, menopausal status and the bladder microbiome. Eur. J. Obstet. Gynecol. Reprod. Biol. 228, 126–129 (2018).
21. Lewis, D. A. et al. The human urinary microbiome; bacterial DNA in voided urine of asymptomatic adults. Front. Cell. Infect.
Microbiol. 3, 41 (2013).
22. Liu, F. et al. Characterization of the urinary microbiota of elderly women and the effects of type 2 diabetes and urinary tract infec-
tions on the microbiota. Oncotarget 8, 100678–100690 (2017).
23. Kumar, M., Babaei, P., Ji, B. & Nielsen, J. Human gut microbiota and healthy aging: Recent developments and future prospective.
Nutr. Heal. Aging 4, 3–16 (2016).
24. Brotman, R. M. et al. Association between the vaginal microbiota, menopause status, and signs of vulvovaginal atrophy. Menopause
21, 450–458 (2014).
25. Raz, R. & Stamm, W. E. A controlled trial of intravaginal estriol in postmenopausal women with recurrent urinary tract infections.
N. Engl. J. Med. 329, 753–756 (1993).
26. Thomas-White, K. et al. Vaginal estrogen therapy is associated with increased Lactobacillus in the urine of postmenopausal women
with overactive bladder symptoms. Am. J. Obstet. Gynecol. 223(727), e1-727.e11 (2020).
27. Eriksen, B. C. & Haugesund, P. A randomized, open, parallel-group study on the preventive effect of an estradiol-releasing vaginal
ring (Estring) on recurrent urinary tract infections in postmenopausal women. (1999).
Scientific Reports | (2021) 11:2212 | https://doi.org/10.1038/s41598-021-81790-8 8
Vol:.(1234567890)www.nature.com/scientificreports/
28. Stapleton, A. E. et al. Randomized, placebo-controlled phase 2 trial of a Lactobacillus crispatus probiotic given intravaginally for
prevention of recurrent urinary tract infection. Clin. Infect. Dis. 52, 1212–1217 (2011).
29. Ravel, J. et al. Vaginal microbiome of reproductive-age women. Proc. Natl. Acad. Sci. USA 108(Suppl 1), 4680–4687 (2011).
30. van de Wijgert, J. H. H. M. et al. The vaginal microbiota: what have we learned after a decade of molecular characterization?. PLoS
ONE 9, e105998 (2014).
31. Thomas-White, K. et al. Culturing of female bladder bacteria reveals an interconnected urogenital microbiota. Nat. Commun. 9,
1557 (2018).
32. Komesu, Y. M. et al. The urinary microbiome in women with mixed urinary incontinence compared to similarly aged controls.
Int. Urogynecol. J. 29, 1785–1795 (2018).
33. Price, T. K. et al. Temporal Dynamics of the Adult Female Lower Urinary Tract Microbiota. mBio https://doi.org/10.1128/mBio
(2020).
34. Mirmonsef, P. et al. Exploratory comparison of vaginal glycogen and Lactobacillus levels in premenopausal and postmenopausal
women. Menopause 22, 702–709 (2015).
35. Muhleisen, A. L. & Herbst-Kralovetz, M. M. Menopause and the vaginal microbiome. Maturitas 91, 42–50 (2016).
36. Govender, Y., Gabriel, I., Minassian, V. & Fichorova, R. The current evidence on the association between the urinary microbiome
and urinary incontinence in women. Front. Cell. Infect. Microbiol. 9, 133 (2019).
37. Ravel, J. & Brotman, R. M. Translating the vaginal microbiome: gaps and challenges. Genome Med. https://doi.org/10.1186/s1307
3-016-0291-2 (2016).
38. Stapleton, A. E. The Vaginal Microbiota and Urinary Tract Infection. Microbiol. Spectr. 4 (2016).
39. Price, T. K. et al. Bladder bacterial diversity differs in continent and incontinent women: a cross-sectional study. Am. J. Obstet.
Gynecol. 223, 729.e1-729.e10 (2020).
40. Price, T. K. et al. The clinical urine culture: Enhanced techniques improve detection of clinically relevant microorganisms. J. Clin.
Microbiol. 54, 1216–1222 (2016).
41. Groah, S. L. et al. Redefining healthy urine: a cross-sectional exploratory metagenomic study of people with and without bladder
dysfunction. J. Urol. 196, 579–587 (2016).
42. Bundgaard-Nielsen, C. et al. Voided urinary microbiota is stable over time but impacted by post void storage. Front. Cell. Infect.
Microbiol. 10, 435 (2020).
43. De Filippo, C. et al. Impact of diet in shaping gut microbiota revealed by a comparative study in children from Europe and rural
Africa. Proc. Natl. Acad. Sci. USA 107, 14691–14696 (2010).
44. Shannon, M. B. et al. Bladder urinary oxygen tension is correlated with urinary microbiota composition. Int. Urogynecol. J. 30,
1261–1267 (2019).
45. Altmäe, S., Franasiak, J. M. & Mändar, R. The seminal microbiome in health and disease. Nat. Rev. Urol. https://doi.org/10.1038/
s41585-019-0250-y (2019).
46. Vodstrcil, L. A. et al. The influence of sexual activity on the vaginal microbiota and Gardnerella vaginalis clade diversity in young
women. PLoS ONE https://doi.org/10.1371/journal.pone.0171856 (2017).
47. Chen, Y. B. et al. The urethral microbiota: A missing link in the female urinary microbiota. J. Urol. 204, 303–309 (2020).
48. Siddiqui, H., Lagesen, K., Nederbragt, A. J., Jeansson, S. L. & Jakobsen, K. S. Alterations of microbiota in urine from women with
interstitial cystitis. BMC Microbiol. 12, 205 (2012).
49. Nelson, D. E. et al. Characteristic male urine microbiomes associate with asymptomatic sexually transmitted infection. PLoS ONE
5, e14116 (2010).
50. Avery, K. et al. ICIQ: A brief and robust measure for evaluating the symptoms and impact of urinary incontinence. Neurourol.
Urodyn. 23, 322–330 (2004).
51. Jackson, S. et al. The bristol female lower urinary tract symptoms questionnaire: development and psychometric testing. Br. J. Urol.
77, 805–812 (1996).
52. Bundgaard-Nielsen, C., Hagstrøm, S. & Sørensen, S. Interpersonal variations in gut microbiota profiles supersedes the effects of
differing fecal storage conditions. Sci. Rep. 8, 17367 (2018).
53. Bolger, A. M., Lohse, M. & Usadel, B. Trimmomatic: a flexible trimmer for Illumina sequence data. Bioinformatics 30, 2114–2120
(2014).
54. Edgar, R. C. UPARSE: highly accurate OTU sequences from microbial amplicon reads. Nat. Methods 10, 996–998 (2013).
55. Wang, Q., Garrity, G. M., Tiedje, J. M. & Cole, J. R. Naive Bayesian classifier for rapid assignment of rRNA sequences into the new
bacterial taxonomy. Appl. Environ. Microbiol. 73, 5261–5267 (2007).
56. Caporaso, J. G. et al. QIIME allows analysis of high-throughput community sequencing data. Nat. Methods 7, 335–336 (2010).
57. McIlroy, S. J. et al. MiDAS: the field guide to the microbes of activated sludge. Database (Oxford) 2015, bav062 (2015).
58. R Development Core Team. R: A Language and Enviroment for Statistical Computing. the R Foundation for Statistical Computing
Available at: https://www.r-project.org/. (Accessed: 26th November 2019)
59. Andersen, K. S., Kirkegaard, R. H., Karst, S. M. & Albertsen, M. ampvis2: an R package to analyse and visualise 16S rRNA amplicon
data. bioRxiv 299537 (2018). doi:https://doi.org/10.1101/299537
60. Extending ‘dendrogram’ Functionality in R [R package dendextend version 1.13.2]. Available at: https://cran.r-project.org/web/
packages/dendextend/index.html. (Accessed: 22nd January 2020)
61. Love, M. I., Huber, W. & Anders, S. Moderated estimation of fold change and dispersion for RNA-seq data with DESeq2. Genome
Biol. 15, 550 (2014).
62. Benjamini, Y. H. Controlling the false discovery rate—a practical and powerful approach to multiple testing. J. R. Stat. Soc. B 57,
1 (1995).
Acknowledgements
This study was supported by Marie Pedersen and Jensine Heiberg Grant. The grant had no role in the study
design, data collection and analysis, the decision to publish, or preparation of the manuscript. We thank Signe
Agerlin Klitgaard Poulsen and Katrine Lauritzen for assisting with laboratory work at the Centre for Clinical
Research, North Denmark Regional Hospital, Denmark.
Author contributions
N.A., B.P.J.B., C.B.N., A.J., P.D.C.L., K.G., S.H., L.T.S.A., and S.S. participated in conception and design of the
study; N.A., B.P.J.B., and A.J. performed the experiments; S.S. and L.T.S.A. supervised the project; N.A., B.P.J.B.,
C.B.N., A.B.V., L.T.S.A., and S.S. performed data analyses; N.A., C.B.N., A.B.V., L.T.S.A., and S.S. prepared the
manuscript, while all authors contributed to finalizing the manuscript. All authors read and approved the final
manuscript.
Scientific Reports | (2021) 11:2212 | https://doi.org/10.1038/s41598-021-81790-8 9
Vol.:(0123456789)www.nature.com/scientificreports/
Competing interests
The authors declare no competing interests.
Additional information
Supplementary Information The online version contains supplementary material available at https://doi.
org/10.1038/s41598-021-81790-8.
Correspondence and requests for materials should be addressed to S.S.
Reprints and permissions information is available at www.nature.com/reprints.
Publisher’s note Springer Nature remains neutral with regard to jurisdictional claims in published maps and
institutional affiliations.
Open Access This article is licensed under a Creative Commons Attribution 4.0 International
License, which permits use, sharing, adaptation, distribution and reproduction in any medium or
format, as long as you give appropriate credit to the original author(s) and the source, provide a link to the
Creative Commons licence, and indicate if changes were made. The images or other third party material in this
article are included in the article’s Creative Commons licence, unless indicated otherwise in a credit line to the
material. If material is not included in the article’s Creative Commons licence and your intended use is not
permitted by statutory regulation or exceeds the permitted use, you will need to obtain permission directly from
the copyright holder. To view a copy of this licence, visit http://creativecommons.org/licenses/by/4.0/.
© The Author(s) 2021
Scientific Reports | (2021) 11:2212 | https://doi.org/10.1038/s41598-021-81790-8 10
Vol:.(1234567890)You can also read