Powering the Future
A Deep Dive into the Alberta Power Market

April 12, 2021
←
→
Page content transcription
If your browser does not render page correctly, please read the page content below
Powering the Future A Deep Dive into the Alberta Power Market April 12, 2021
Forward-Looking Statements
This presentation includes forward-looking statements or information (collectively referred to herein as “forward-looking statements”) within the meaning of
applicable securities legislation. All forward-looking statements are based on our beliefs as well as assumptions based on available information and on management’s
experience and perception of historical trends, current conditions, and expected future developments, as well as other factors deemed appropriate in the
circumstances. Forward-looking statements are not facts, but only predictions and generally can be identified by the use of statements that include phrases such as
“may”, “will”, “can”, “believe”, “expect”, “anticipate”, “intend”, “plan”, “project”, “forecast”, “foresee”, “potential”, “enable”, “continue”, or other comparable
terminology. These statements are not guarantees of TransAlta Corporation’s (“we”, “our”, Company”) future performance and are subject to risks, uncertainties, and
other important factors that could cause actual results or outcomes to be materially different from those set forth in the forward-looking statements. In particular,
this presentation includes forward-looking statements pertaining to, among other things: the characteristics of the Alberta fleet; Alberta load growth; forecasted
carbon costs; Alberta pricing and its sensitivity to EBITDA; and pro forma Hydro EBITDA outlook. The material factors and assumptions used in the preparation of the
forward-looking statements contained herein, which may prove to be incorrect, include, but are not limited to, the assumptions set forth in the management's
discussion and analysis and the Company's annual information form for the year-ended December 31, 2020.

The forward-looking statements contained in this presentation are subject to a number of significant risks, uncertainties and assumptions that could cause actual
plans, performance, results or outcomes to differ materially from current expectations. Factors that may adversely impact what is expressed or implied by the
forward-looking statements contained in this presentation include the impacts of COVID-19, including a decrease in electricity demand and lower merchant pricing in
Alberta; regulatory and policy changes; fluctuations in market prices; changes in demand for electricity and capacity and our ability to contract our generation for
prices that will provide expected returns; disruptions in the transmission and distribution of electricity; the effects of weather, natural disasters and other climate-
related risks; disruptions to the operations, including unplanned outages, equipment failure and our ability to carry out repairs in a cost-effective or timely manner;
and industry risks and competition. The foregoing risk factors, among others, are described in further detail in the Company's Management's Discussion and Analysis
and Annual Information Form for the year ended December 31, 2020, which are available on SEDAR at www.sedar.com. Readers are cautioned not to place undue
reliance on these forward-looking statements, which reflect the Company’s expectations only as of the date of this presentation. The purpose of the financial outlooks
contained in this presentation are to give the reader information about management's current expectations and plans and readers are cautioned that such
information may not be appropriate for other purposes and is given as of the date of this presentation. The Company disclaims any intention or obligation to update
or revise these forward-looking statements, whether as a result of new information, future events or otherwise, except as required by law.

Certain financial information contained in this presentation, including EBITDA, may not be standard measures defined under International Financial Reporting
Standards (“IFRS”) and may not be comparable to similar measures presented by other entities. These measures should not be considered in isolation or as a
substitute for measures prepared in accordance with IFRS. Please refer to the Company’s MD&A for the year ended December 31, 2020, for further discussion of non-
IFRS measures, including, where applicable, reconciliations to measures calculated in accordance with IFRS.
Evolution of the Alberta Electricity Market

  Energy
               Creation          PPAs                             Balancing Pool
dispatched                                                                                December 31,
              and auction     returned to                         terminates Sun
  through                                                                                  2020 PPAs
                of the         Balancing                          B&C and Battle
   market                                                                                    expire
                PPAs             Pool                               River 5 PPA
   offers

             1996           2001            2016                2018               2019          2021

      Regulated /                                    PPA                                             Fully
     Cost Recovery                                 Transition                                     Deregulated

      PPAs used by AB government to introduce competition and provide a transition to fully
                         deregulated market over a 20-year period

        From a regulated, cost recovery market to a deregulated energy-only market

                                                                                                                3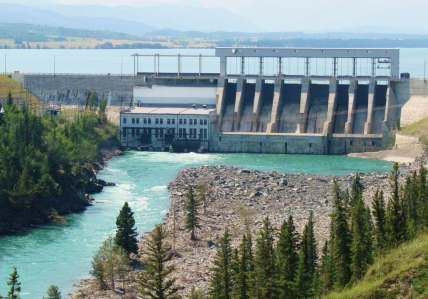
Alberta Power Market 101
Alberta Government has never owned/operated an electric utility company
Energy-only market
Competitive markets determine wholesale prices
Merchant generators are paid only for the electricity that is produced
Prices fluctuate every hour with available/offered supply and consumer demand
Generators are expected to receive adequate wholesale prices to deliver both
return on and of capital for their fixed capital investments through their cumulative
offer strategies
Alberta Power Market is fully deregulated energy-only market
4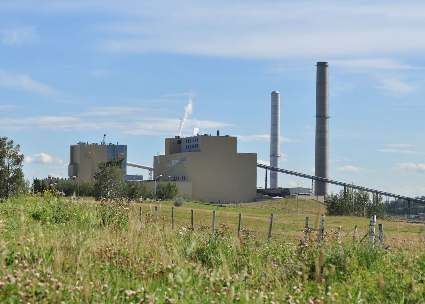
Historical Alberta Energy Prices

      ALBERTA ELECTRICITY PRICES – AVERAGE POOL PRICE ($/MWH)

                                                       Subdued
                                                       demand –
                                                    financial crisis
                                                                                           PPAs put back
                                                      & expanded
     $100                                                                                   to Balancing
                                                      generation
                                                                                                Pool       PPAs expire –
                                                         fleet
      $90                                                                                                   offer control
                                                                                                           with generation
      $80                                                                                                      owners
      $70

      $60

      $50

      $40

      $30

      $20

      $10

       $0

                                                              Weak oil prices & Shephard
                                                                         online

Source: AESO Historical prices; TA 2021 guidance)                                                                            5
2021 Shift in Offer Control and Market Share

                    2020 OFFER CONTROL (1)                                                                    2021 OFFER CONTROL (2)

                                                 TransAlta,
                                                                                                                     Other,   TransAlta,
                         Other, 5,427            3,268 MW
                                                                                                                   5,026 MW   3,676 MW
                            MW                                              Capital
                                                                            Power,
                                                                          1,321 MW                                                            Capital
                                                                                                                                              Power,
                                                                                                                                            2,083 MW
                                                                        Enmax,
                                                                       1,446 MW
 Balancing Pool,                                                                                         Heartland,               Enmax,
    2,284 MW                                        Heartland,                                           2,552 MW                1,446 MW
                                                    1,796 MW

          Offer control transitioned back to generators from Balancing Pool in 2021

(1) Source: MSA 2020 Market Share Offer Control Report as at Feb 2020 includes TransAlta Sun 3, which has since retired                          6
(2) Excludes TransAlta’s Sun 3 and includes TransAlta’s mothballed Sun 5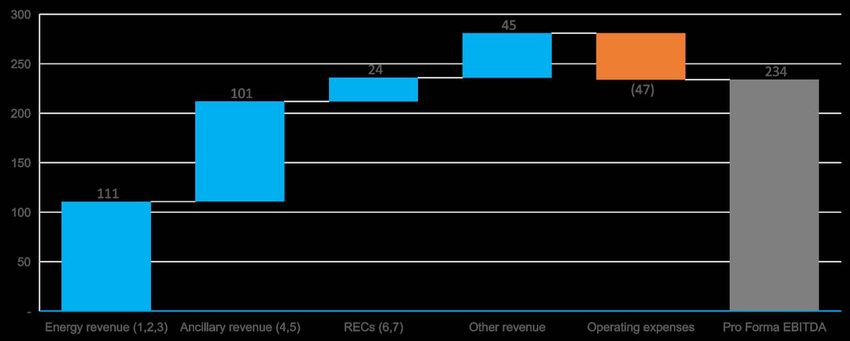
Supply Cushion

  Q1 2021 SUPPLY CUSHION – ADJUSTED FOR LONG LEAD-TIME ASSETS
                      900

                      800                   37.1%

                      700

                              27.9%                                 28.1%
                      600
    Number of Hours

                      500

                      400

                      300

                      200
                                                                                  6.1%

                      100
                                                                                            0.8%
                       0
                              >2,000      1,500-2,000             1,000-1,500   500-1,000
TransAlta’s Role in Alberta Power Supply
Fleet flexibility is key in the Alberta merchant market
Converted units provide supply when renewables are not available/generating
Renewables create credits that offset carbon and provide clean power to the grid
2020 ALBERTA FLEET 2021 ALBERTA FLEET
19%
32% 24%
14%
57%
19%
35%
Coal Gas Wind/Battery Hydro Coal Gas Wind/Battery Hydro
TransAlta has a diverse asset portfolio that supplies clean, low-cost, reliable power
Based on Iistalled MW’ 8TransAlta’s Alberta Fleet Characteristics
Hydro Wind Converted Gas
Low variable cost Low variable cost Higher variable cost
Water a finite, storable Price taker Low capital investment
resource
Not correlated to Base load and peak
Allows for optimization of flows event/weather driven pricing capacity
Super-peak capacity, must Produces EPCs
run, ancillary market products
Grid reliability support
Produces Emission
Performance Credits “EPCs”
9Rising Carbon Costs
Under TIER every large emitting facility is given a GHG emissions benchmark
Gas generation is less carbon intensive and less impacted by changing carbon
prices than coal
Renewable generation generates credits and avoids a carbon levy
IMPACT OF INCREASING CARBON COSTS ON GENERATION COSTS
$50.00
$40.00
Price Impact ($/MWh)
$30.00
$20.00
$10.00
$0.00
($10.00) $40 $50 $65
($20.00)
($30.00)
Coal CTG Renewables
TransAlta fleet resilient with rising carbon costs
10Historic Demand - Alberta
Recent Alberta demand has been impacted by large decreases in industrial
load, due to the wildfires and COVID-19
12,000 Record high demand
Feb 9, 2021
11,000 Oilsands development driving
demand growth
10,000
Demand (MW)
9,000
8,000
7,000
Fort McMurray COVID-19
Wild Fires Outbreak
6,000
Demand in Q1 showing recovery from 2020 levels and
signs of improving economic activity
11Demand - Load Growth
Future load growth will
come from new sources
such as:
cryptocurrency, electric
vehicles, cannabis, and new
petrochemical business
Rooftop solar will absorb
some load as customers
offset some demand
Annual load growth of ~0.9% driven by new sources of industrial demand & EV
transition
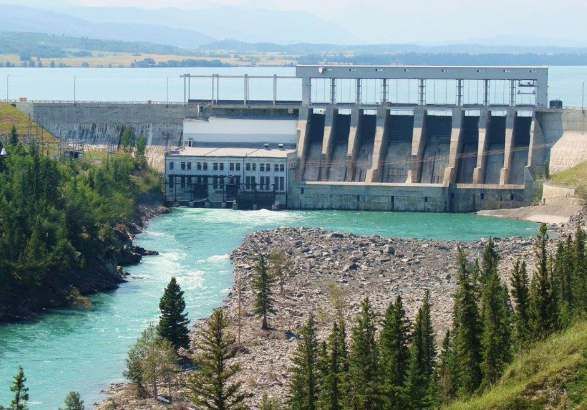
12Hydro - Overview
Own and operate over 90% of Alberta’s
hydro (834 MW)
Mix of storage and run-of-river facilities
Brazeau and Bighorn facilities account
for ~80% of ancillary revenue
Green credits under new Alberta carbon
policy
Step up in cash flows with the expiry of the
2020 SEGMENTED CASH FLOW
Energy
Alberta PPAs (end of 2020) Marketing
14%
Critical back-up for wind and solar Hydro 10% Coal 20%
Essential for market stability
Immediate ramping Wind/Solar
Gas 27%
29%
Brookfield has option to acquire interest
Unique, reliable and perpetual
13Hydro EBITDA Build-up Example
POST-PPA HYDRO EBITDA BUILD-UP
Capacity Payment
Hydro EBITDA step-up expected with PPA expiration
Assumptions: (4) Based on 3-year average historical ancillary production levels of 3,000 GWh
(1) Based on 3-year average historical production levels of 1,625 GWh (5) Based on 3-year average historical discount to pool price
(2) Assumed pool price of $60/MWh (6) RECs generated in 2021 to be realized in future years 14
(3) Realized energy price based on 3-year historical average premium to pool price of (7) Based on $40/tonne carbon with intensity factor of 0.37
$68/MWhQuestions and Answers
You can also read