POVERTY WATCH SPAIN 2020 - CARM.es
←
→
Page content transcription
If your browser does not render page correctly, please read the page content below

POVERTY WATCH
               SPAIN
               2020

                          Graciela Malgesini Rey
                          Advocacy & European Affairs Officer
                          EAPN-ES

EUROPEAN ANTI-POVERTY NETWORK - SPAIN
European Anti-Poverty Network (EAPN) es una Plataforma Europea de Entidades Sociales que
trabajan y luchan contra la Pobreza y la Exclusión Social en los países miembros de la Unión
Europea. La EAPN busca permitir que aquellas personas que sufren la pobreza y la exclusión social
puedan ejercer sus derechos y deberes, así como romper con su aislamiento y situación, y tiene
como objetivo principal situar ambas cuestiones en el centro de los debates políticos de la Unión
Europea.

En España, la Red Europea de Lucha contra la Pobreza y la Exclusión Social en el Estado Español
(EAPN-ES) es una organización horizontal, plural e independiente que trabaja para trasladar este
objetivo a la realidad española y por incidir en las políticas públicas, tanto a nivel europeo como
estatal, autonómico y local. Actualmente está compuesta por 19 redes autonómicas y 18
entidades de ámbito estatal, todas ellas de carácter no lucrativo y con un componente común:
la lucha contra la pobreza y la exclusión social. En total, EAPN-ES engloba a más de ocho mil
entidades sociales en todo el Estado.

Entre nuestros objetivos, al igual que entre los objetivos de EAPN en Europa, se encuentra el de
implantar un método de trabajo en Red para trabajar de manera conjunta y aunar esfuerzos para
la consecución de mayores y mejores resultados en la lucha por la erradicación en España de la
pobreza y la exclusión social.

Se permite la reproducción total o parcial de este documento siempre y cuando se citen las
fuentes, respetándose el contenido tal y como está editado sin ningún tipo de tergiversación o
cambio.

Título: POWERTY WACTH SPAIN 2020

Coordinación: Secretaría Técnica EAPN-ES

Autora: Graciela Malgesini

Fecha: Octubre 2020

EAPN ESPAÑA
C/Tribulete, 18 Local, 28012 Madrid
91 786 04 11 - eapn@eapn.es
www.eapn.es

                                                                                                 1
                   EAPN ES – EAPN Spain
                   Calle Tribulete 18, 28012, Madrid, Spain.
                   Web: https://www.eapn.es/
Contents
1.     INTRODUCTION ............................................................................................................3

1.1. WHAT DO WE MEAN BY POVERTY? .....................................................................................3
2. WHAT IS HAPPENING TO POVERTY? WHAT ARE THE GROUPS MOST AFFECTED? ............4

2.1.  KEY DATA ON POVERTY FROM EU SURVEY OF LIVING CONDITIONS (SILC) ....................................5
2.2.  EUROPE 2020 INDICATORS: AT RISK OF POVERTY, MATERIAL DEPRIVATION, LOW INTENSITY OF WORK,
ANALYSING TRENDS AND GAP ON ACHIEVEMENT ON THE TARGETS. .......................................................5
2.3. KEY EU SILC INDICATORS.................................................................................................6
2.3.1. AT RISK OF POVERTY AND/OR EXCLUSION (AROPE) .................................................................. 6
2.3.2. AT RISK OF POVERTY ........................................................................................................... 10
2.3.3. MATERIAL DEPRIVATION ..................................................................................................... 11
2.3.4. LOW WORK INTENSITY ........................................................................................................ 13
2.3.5. INEQUALITY ....................................................................................................................... 13
2.4. IN-WORK POVERTY ...................................................................................................... 15
3. THE IMPACT OF COVID 19 ........................................................................................... 24

3.1. THE HEALTHCARE SYSTEM BEFORE THE PANDEMIC ................................................................ 24
3.2. THE HEALTH IMPACT OF COVID-19 .................................................................................. 26
3.3. DATA ........................................................................................................................ 29
3.3.1. DISTRIBUTION BY AGE AND SEX ............................................................................................. 29
3.4. VULNERABLE GROUPS ................................................................................................... 30
3.4.1. UNDOCUMENTED MIGRANTS AND ASYLUM SEEKERS ................................................................. 33
3.5. GENDER INEQUALITY ..................................................................................................... 35
3.6. SOCIAL SHIELD............................................................................................................. 39
3.7. GUARANTEED MINIMUM INCOME.................................................................................... 40
3.7.1. BACKGROUND SITUATION .................................................................................................... 40
3.7.2. THE NEW INGRESO MÍNIMO VITAL (GUARANTEE MINIMUM INCOME) ........................................ 42
3.7.3. CHARACTERISTICS ............................................................................................................... 43
3.7.4. ASSESSMENT ..................................................................................................................... 44
3.8. NGO ........................................................................................................................ 44
4. RECOMMENDATIONS ................................................................................................. 45

4.1. FRAMEWORK RECOMMENDATIONS................................................................................... 45
4.2. SPECIFIC RECOMMENDATIONS ......................................................................................... 47
4.2.1. HEALTHCARE ..................................................................................................................... 47
4.2.2. INCOME PROTECTION .......................................................................................................... 48
4.2.3. SUSTAINABILITY, DIGITALISATION .......................................................................................... 49
ANNEX. ADVOCACY: “FUTURO EN COMÚN” ALLIANCE.................................................................... 49

                                                                                                                                          2
                        EAPN ES – EAPN Spain
                        Calle Tribulete 18, 28012, Madrid, Spain.
                        Web: https://www.eapn.es/
1. Introduction

EAPN is a network dedicated to the fight against poverty. Our aim is to work together to
achieve a reduction of poverty, through an effective integrated antipoverty strategy based on
participation, at national and EU level. Monitoring trends on poverty is part of this process,
holding governments to account, and raising awareness to the general public.

The proposal of the National Poverty Watch Reports is to give priority to members’ own
assessment of what is happening to poverty in their country, drawing on the lived
experience/voice of people experiencing poverty.

This Report Objectives are:

    a. To monitor key trends and policy on poverty and social exclusion in Spain.
    b. To raise awareness about priority issues and impact/reality for people
       experiencing poverty
    c. To propose concrete recommendations backed by experience and evidence.
This Report is directed to:

    a.   National and EU decision-makers
    b.   National stakeholders
    c.   Activists
    d.   General public

      1.1. What do we mean by poverty?

In Spain, the different manifestations of poverty and social exclusion are a shortage of
income, lack of decent housing, material deprivation, more difficult educational and
healthcare paths due to hardships, poverty of families living in disadvantaged environments,
and limited or truncated access to basic services.

           The Poverty Watch 2020 describes the key characteristics of poverty
           and social exclusion in Spain, including the impact of the COVID-19
             pandemic, and presents recommendations for the eradication of
                                    poverty and social exclusion.

On March 3rd, 2010, the European Union presented the Commission Communication
entitled "Europe 2020, a strategy for smart, sustainable and inclusive growth", with common
headline targets for economic and social development. To meet these targets, Member
States made specific commitments and generated reform programs to achieve them. Within
these commitments, for the period 2009-2020, the Spanish government adopted the
objective of "reducing between 1,400,000 and 1,500,000 the number of people at risk of

                                                                                            3
                EAPN ES – EAPN Spain
                Calle Tribulete 18, 28012, Madrid, Spain.
                Web: https://www.eapn.es/
poverty and social exclusion, according to an aggregate indicator that includes people who
live below the poverty line (relative poverty); people who suffer severe material deprivation,
and people who live in homes with low or no employment intensity. The reduction of child
poverty would be carried out in a proportion similar to the reduction of poverty in general ".1

EUROSTAT set up the AROPE (At Risk of Poverty and / or Exclusion) indicator, including
and combining the three abovementioned sub-indicators, as well as a standardized
methodology for its annual calculation in each of the EU countries.

Since 2011, the European Network for the Fight against Poverty and Social
Exclusion (EAPN-ES) analyses the AROPE evolution in Spain and the degree of compliance
with the Spanish commitments in our annual Report “The State of Poverty”.2 Its objective is
to present a vision -as complete as possible- of the incidence and intensity of poverty and
social exclusion, at the national and regional levels, and to evaluate the degree of progress
towards our social inclusion target, specified in the European 2020 Strategy.

    2. What is happening to poverty? What are the groups most
       affected?

In February 2020, the European Commission published the Country Report, which warned
that Spain was still in a danger zone. After six years of growth, the country failed to overcome
the macroeconomic, employment and social problems that characterized the period of the
crisis. Persistent unemployment and precarious employment, chronically high at risk of
poverty and exclusion rates (particularly children, immigrants and single parents), and
insufficient efforts done by the governments, were some of the facts highlighted.

The Country Report summarized the situation related to poverty:

“The proportion of people at risk of poverty and / or social exclusion continues to decrease,
but remains high, especially for children. Labour market challenges and the low impact on
poverty of social transfers result in one of the highest risks of poverty or social exclusion for
children in the EU. The weakness of family benefits and income guarantee schemes limits
the poverty reduction effect of social transfers. Regional minimum income schemes are
estimated to only reach 20% of their potential beneficiaries nationwide, with strong regional
disparities. Even though fertility rates are much below the population replacement level,
family benefits in Spain remain the lowest in the EU. They reach only half of the children at
risk of poverty or exclusion as a strict means test for child benefits results in low coverage,
and tax allowances are of limited benefit for lower income families.”

1 Programa Nacional de Reformas de España 2011. Madrid: Ministerio de sanidad, servicios sociales e igualdad.
https://www.msssi.gob.es/ssi/familiasInfancia/inclusionSocial/inclusionSocialEspana/programasNacionales/docs/pnr
Espana
2 Juan Carlos Llano (2019). IX Informe sobre el Estado de la Pobreza. Seguimiento del indicador de riesgo de

pobreza y exclusión social en España. EAPN-España. Madrid: EAPN-España. Available at:
https://www.eapn.es/estadodepobreza/

                                                                                                              4
                   EAPN ES – EAPN Spain
                   Calle Tribulete 18, 28012, Madrid, Spain.
                   Web: https://www.eapn.es/
In this part of the Report we will go through the key data related to the Survey of Living
Conditions published in 2020 analysing the changes that are exposed by the most recent
data.

     2.1. Key data on poverty from EU Survey of Living Conditions
          (SILC)

In July 2020, the National Institute of Statistics (INE) published the latest Survey of Living
Conditions, corresponding to the income data for 2018 and the rest of variables for 2019.

The Survey is strongly marked by two important issues.

In the first place, this is the ending year for the EU 2020 Strategy. The statistical data
show not only that Spain failed to meet the social goals committed, but that the said data is
even more negative than at the beginning of the period covered by the EU 2020 strategy.

Secondly, although the data show a notable improvement compared to the previous year,
which would be confirming a positive trend that began in 2014, the COVID-19 crisis has
turned them into "the light of a star that no longer exists" and forces us to consider them
as a downward reference of the real situation.

     2.2. Europe 2020 indicators: at risk of poverty, material deprivation,
          low intensity of work, analysing trends and gap on
          achievement on the targets.

Despite the improvement in most of the indicators, the Survey confirms an increase in poverty
and exclusion in some of the most disadvantaged sectors of the population. Among them,
the increase in child poverty stands out. This rate had been reduced by 1.5 percentage points
in 2019 and has increased again with the 2020 data, reaching 27.4% of children. This figure
is 35% higher than the poverty rate of the adult population, between 18 and 64 years old.

There is also an increase in the inequality rate: the richest 20% of the population has a net
income about six times higher than that of the poorest 20% (reaching a level of inequality
even more intense than that corresponding to 2008). The Survey also certifies an increase
in the AROPE rate in certain groups, as is the case of single-parent households.

The official statistics show that severe material deprivation resumed its reduction process
and, at present, reaches 4.7% of the population, which represents just over 2.2 million
people. Despite the appreciable reduction experienced, this indicator is still very high,
reaching some 560,000 more people than in 2008.

                                                                                            5
                EAPN ES – EAPN Spain
                Calle Tribulete 18, 28012, Madrid, Spain.
                Web: https://www.eapn.es/
2.3. Key EU SILC indicators

           2.3.1.    At risk of Poverty and/or Exclusion (AROPE)

In 2019, a total of 11,875,000 people, which represents 25.3% of the Spanish
population, are at risk of poverty and / or social exclusion. The figure shows a small
decrease of 0.8. percentage points compared to last year and supposes maintaining the
downward trend for the fifth consecutive year. In absolute terms, it implies that some 300,000
people were no longer at risk of poverty or social exclusion this past year.

Despite this reduction, the indicator still remains 1.5 percentage points above the
control year specified for the EU 2020 Strategy (2008). In absolute terms, if in 2008 there
were about 10.8 million people in AROPE, in 2019 there are 11.8 million, which means that,
instead of reducing the AROPE rate by 1.4 million people, it increased in 1 million more
people. The conclusion is clear: Spain has failed to fulfil the commitments for the 2020
Strategy. The last decade can be considered as “lost” in terms of poverty reduction, as we
warned in the Poverty Watch 2018.3

Women are more affected by poverty and social exclusion. With respect to specific
groups, younger persons and children, foreigners, single parents, those unemployed
and with low-education attainment have higher rates than their respective average.

              2.3.1.1. Composition of the AROPE rate

The data -once again- show a feminization of poverty and social exclusion, with higher
rates of AROPE and of each of its components. In other words, the economic recovery
occurred more among men than among women.

At Risk of Poverty is the main indicator of the AROPE indicator, with a 20.7% of the
population affected. In the second place, the indicator of “low work intensity” reaches 10.8%
of the population. Thirdly, 4.7% of the population suffers from “severe material deprivation”.

       Table 1. Components of the AROPE indicator, by sex
    AROPE components                                       Total         Men         Women

    At Risk of Poverty (income in the year                       20.7%     20.2%        21.1%
    prior to the interview)

    Severe Material Deprivation                                  4.7%      4.6%         4.8%

    Living in homes with low work intensity                      10.8%         10%      11.7%
    (from 0 to 59 years old)
    AROPE                                                        25.3%     24.6%        26%

Source: INE, Encuesta de condiciones de vida, 2020

3   https://www.eapn.es/publicaciones/368/poverty-watch-2018

                                                                                                6
                     EAPN ES – EAPN Spain
                     Calle Tribulete 18, 28012, Madrid, Spain.
                     Web: https://www.eapn.es/
Those suffering from the three factors -relative poverty, severe material deprivation and lived
in homes with low intensity- accounted for 1.4% of the Spanish population (656,180
individuals).

          2.3.1.2. Household composition

The worse situation of single parent households should be highlighted again, as in the
previous years. Although there has been a small reduction of the rate this year, the
percentage of single parent households who are AROPE (an adult and dependent children)
reaches 46.8%, a figure that is higher than that registered in 2008.

    Table 2. AROPE by household composition
                                                            2008    2019     2019-2008
                                                                                in pp
     Total                                                  23.8    25.3    1.5
     One person                                             33.8    26.1    -7.7
     2 adults without dependent children                    22.3    20.3    -2
     Other households without dependent children            14      21.9    7.9
     1 adult with 1 or more dependent children              45      46.8    1.8
     (single parents)
     2 adults with 1 or more dependent children             24.2    25.2    1
     Other households with dependent children               29.6    33.4    3.8
     Not included or provided                               0       36.5    36.5

         Source: INE, Encuesta de condiciones de vida, 2020

Having children is "a risk factor" of being in a situation of poverty and social
exclusion. This risk is much higher, if it is an adult person who is exclusively in charge of
the household. Currently, there are 18,535,900 households and single parents already
represent 10.1% of the total. 81.9% are headed by women, while 18.1% by men. This
proportion has been stable over the last decade. The number of single-parent households
has increased as the number of breakups, separations and divorces has increased, on the
one hand, but also due to the increase in life expectancy, particularly for women, which leads
to high percentages of widowhood among those with older age. On the other hand, the
number of women who face motherhood alone has also grown, not only due to traditional
causes (related to unplanned pregnancy, which is faced alone), but also by choice (through
planned pregnancy, surrogacy and / or adoption), regardless of the existence of a conjugal
bond with the parent. 68.2% of single-parent households are made up of two members (adult
person and child) and 27.2% are made up of three people.

                                                                                             7
                EAPN ES – EAPN Spain
                Calle Tribulete 18, 28012, Madrid, Spain.
                Web: https://www.eapn.es/
2.3.1.3. Age groups

Young people, with 31.7% in AROPE, and children, with 30.1%, are the most affected groups
by age. The elderly persons have the lowest rate, with 15.7%.

   Table 3. AROPE by age groups
                                  Age groups                       AROPE
                                  Below 16                         30.1
                                  16-29                            31.7
                                  30-44                            24.7
                                  45-64                            26.2
                                  65 +                             15.7

                    Source: INE, Encuesta de condiciones de vida, 2020

There are outstanding differences by sex. In the case of young people, the AROPE rate for
men is 29.7%, and it goes up to 33.8% in the case of women. A similar situation happens
within children: 28.2% of boys and 32.1% of girls. Therefore, the AROPE figures show the
impact of gender inequality on poverty and exclusion.

   Table 4. AROPE by age groups, by sex

               Age groups               Men           Women               Difference W-M in
                                                                                  pp
               Below 16                 28.2                32.1                  3.9
               16-29                    29.7                33.8                  4.1
               30-44                    24.4                25.2                  0.8
               45-64                    25.3                27.0                  1.7
               65 +                     15.7                15.8                  0.1

                    Source: INE, Encuesta de condiciones de vida, 2020.

         2.3.1.4. Nationality

In Spain, foreigners, both EU and non-EU, have a high probability of being at risk of poverty
and exclusion. The historical trend is confirmed in 2020, with an AROPE rate for the non-EU
population that more than doubles that of the Spanish (54.2% and 24.4% respectively). The
AROPE rate of the European population is also 29.8 percentage points higher than that of
the Spanish.

                                                                                              8
                EAPN ES – EAPN Spain
                Calle Tribulete 18, 28012, Madrid, Spain.
                Web: https://www.eapn.es/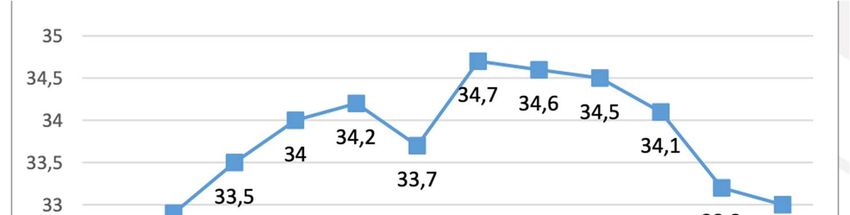
Table 5. AROPE by nationality
                                       Nationality          AROPE
                                                             rate
                             Total                               24.4

                             Española                              21.7
                             Extranjera (Unión                     46.2
                             Europea)
                             Extranjera (Resto del                 54.2
                             mundo)
                      Source: INE, Encuesta de condiciones de vida, 2020.

         2.3.1.5. Education

In Spain it is striking that having a secondary education level does not protect individuals
from being poverty and/or excluded. As shown in the table, both primary and secondary
(compulsory) education have the highest AROPE rates, with 31.6% and 31.7%. Having
university studies only reduces the AROPE rate with respect to the average by 10.7
percentage points, that is, it does not work correctly as a barrier against poverty either.

   Table 6. AROPE by educational attainment
                                                            2019
                         Total                              24.4
                         Primary education or lower         31.6
                         Secondary education first          31.7
                         stage
                         Secondary education second         23.7
                         stage
                         Higher education                   13.7
                         Not included or provided           30.2
                      Source: INE, Encuesta de condiciones de vida, 2020.

         2.3.1.6. Occupation

56.9% of the unemployed and 37% of the inactive are in AROPE. It is important to note that
15.3% of the people who work are at risk of poverty and social exclusion.

   Table 7. AROPE by occupation status
                                                              2019
                                Total                          24.4
                                Occupied                       15.3
                                Unemployed                     56.9
                                Retired                         14
                                Other inactive                  37
                      Source: INE, Encuesta de condiciones de vida, 2020.

                                                                                          9
                EAPN ES – EAPN Spain
                Calle Tribulete 18, 28012, Madrid, Spain.
                Web: https://www.eapn.es/
2.3.1.7. AROPE Regional situation
The highest AROPE rates are located in both Autonomous Cities, Ceuta (45.9%) and Melilla
(38.5%). The most affected Autonomous Communities are Extremadura, Andalusia (37.7%
each) and the Canary Islands (35%).
In 2020, with respect to 2019, the AROPE rate was reduced in all the communities except
for Galicia (an increase of 1.3 percentage points), Madrid (remained the same), and the
Basque Country (an increase of 2.3 percentage points).
Graph 1. AROPE by Autonomous Communities
The regional distribution of AROPE shows the enormous existing disparities, between
the Northern regions with poverty levels similar to the European average and the
Southern regions which quadruple that average.
2.3.2. At Risk of Poverty
20.7% of the Spanish population, that is, about 9.7 million people, are at Risk of
Poverty. The figure represents a small reduction of eight tenths with respect to the 2019
data, which translates into some 315,000 people who are no longer poor. In addition, the rate
is still far from the records prior to the crisis: there are currently some 670,000 more people
at risk of poverty and a difference of 0.9 percentage points with respect to the values of 2008.
Women have higher Poverty rates in every group age, except for the elderly. The most
striking difference is 4 percentage points among the 16-29 group.
10
EAPN ES – EAPN Spain
Calle Tribulete 18, 28012, Madrid, Spain.
Web: https://www.eapn.es/Table 8. At Risk of Poverty, by age groups
Age groups Total Men Women Difference
W-M in pp
Total 20.7 20.2 21.1 0.9
Below16 27.1 26.0 28.2 2.2
16-29 26.5 24.6 28.6 4.0
30-44 18.8 18.1 19.5 1.4
45-64 19.7 19.5 19.8 0.3
65 + 14.5 14.5 14.4 -0.1
Source: INE, Encuesta de condiciones de vida, 2020
Child poverty, that is, that registered among boys and girls under 18 years of age,
which had fallen by 1.5 points in 2019, increased up to 27.4% of children and
adolescents, a figure that is about 7 points, that is, 35%, higher than the rate of the
rest of the adult population (from 18 to 64 years old).
2.3.3. Material Deprivation
Severe Material Deprivation includes those people who live in households that cannot cope
with four or more concepts, items or consumption elements, out of a total of nine considered
basic in the European territory. Severe material deprivation is an indicator of severe
vulnerability and each of its variables is essential for participation in European society.
Between 2008 and 2014, Severe Material Deprivation registered an almost uninterrupted
and highly intense growth, which led to a doubling of its amount. As of 2014, this indicator
began a cycle of decline, at a rate of six or seven tenths per year until 2019. In 2019, Severe
Material Deprivation fell, reaching 4.7% of the population residing in Spain, which it
supposes something more than 2.2 million people. Despite this trend, it reaches about
560,000 more people than in 2008.
Severe Material deprivation affects mostly single parent households.
Table 9. Severe Material Deprivation, by household type
Household
One person households 5,9
2 adults without dependent children 3,2
Other households without dependent children 4,2
1 adult with 1 or more dependent children (single parents) 9,5
2 adults with 1 or more dependent children 4,3
Other households with dependent children 5,4
Source: INE, Encuesta de condiciones de vida, 2020
11
EAPN ES – EAPN Spain
Calle Tribulete 18, 28012, Madrid, Spain.
Web: https://www.eapn.es/Material deprivation is higher in women regarding most of the variables.
Table 10. Material Deprivation Variables, by sex, in percentages of the population
You cannot afford… You have
had delays
in paying
expenses
To go on To have a To keep your To cope To have a To have a
related to
vacation at meal of home at an with car personal
the main
least one meat, adequate unforeseen computer
home
week a poultry or temperature expenses
(mortgage
year fish at
or rent, gas
least every
bills,
other day
community
...) in the
last 12
months
Total 33.4 3.8 7.6 33.9 4.7 5.6 7.8
Men 32.4 3.7 7.4 32.5 4.4 5.6 7.8
Women 34.5 3.8 7.7 35.3 5 5.5 7.8
Source: INE, Encuesta de condiciones de vida, 2020
Having children is a source of risk of suffering from Material Deprivation, particularly in the
case of single parents and other households with children.
Table 11. Material deprivation variables, by household type
You cannot afford You have had
To go on To have a To keep your To cope To To have a delays in
vacation meal of meat, home at an with have a personal paying
at least poultry or fish adequate unforeseen car computer expenses
one week at least every temperature expenses related to the
a year other day main home
(mortgage or
rent, gas bills,
community ...)
in the last 12
months
One person 37.0 4.2 10.1 38.8 5.6 4.3 6.4
2 adults 29.8 3.6 6.6 28.1 4.4 3.6 3.9
without
dependent
children
Other 36.6 3.0 6.7 33.1 4.0 4.6 7.2
households
without
dependent
children
1 adult with 1 48.0 6.4 9.2 52.8 12.9 9.4 16.4
or more
dependent
children
2 adults with 27.4 2.8 6.1 30.3 3.4 5.9 7.8
1 or more
dependent
children
Other 43.5 5.1 10.1 44.8 5.4 7.5 12,8
households
with
dependent
children
Source: INE, Encuesta de condiciones de vida, 2020
12
EAPN ES – EAPN Spain
Calle Tribulete 18, 28012, Madrid, Spain.
Web: https://www.eapn.es/2.3.4. Low Work Intensity
The Low Work Intensity per Household sub-indicator comprises those people under 60 years
of age who live in households with low employment intensity, that is, in which their members
of working age did less than 20% of their total work potential during the reference year.
In 2019, 10.8% of people under 60 years of age live in households with Low Work
Intensity, a figure that is practically identical to that of the previous year and which means
ending the process of reducing the rate that had been registered in the last four years. In
absolute terms, there are a little more than 3.7 million people living in low work intensity, a
figure that, due to population variation, represents about 80,000 more people than the
previous year and almost 1.4 million more than those registered in 2008 (2.36 million).
On the other hand, this increase has mainly affected women, whose rate is 1.7 percentage
points higher than that of men.
Graph 2. People living in households with Low Intensity of Employment
Men
Women
Source: INE, Encuesta de condiciones de vida, 2020
2.3.5. Inequality
The economic situation was slowly improving for those with low-income. The average income
per person reached € 11,680 € 268 (2%) more compared to 2019 and € 943 (8.8%) more,
compared to 2008. This increase did not produce an substantial reduction in inequality
as register by the S80 / S20 indicator, which measures the proportion of total income received
by the 20% of the population with the highest income compared to that received by the 20%
with the lowest income. The higher the value of the indicator, the greater the inequality
between the extreme groups of the population in which it is measured. This year's data
shows that the richest 20% of the population has a net income about six times that of
the poorest 20%. The graph shows that inequality is even more intense than it was in
2008.
13
EAPN ES – EAPN Spain
Calle Tribulete 18, 28012, Madrid, Spain.
Web: https://www.eapn.es/Graph 3. S80/S20 Indicator - Spain
Source: INE, Encuesta de condiciones de vida, 2020
The Gini coefficient measures the extent to which the distribution of income within a country
deviates from a perfectly equal distribution. A coefficient of 0 expresses perfect equality
where everyone has the same income, while a coefficient of 100 expresses full inequality
where only one person has all the income. The Gini index decreased very little this year and
reached a value of 33, a figure that is also higher than the measurement in 2008.
Graph 4. Gini Index - Spain
Source: INE, Encuesta de condiciones de vida, 2020
The improvement of the economy has not been sufficient to reduce inequality to pre-
crisis levels of 2008.
Disposable income inequalities declined but remained among the highest in the EU.
In 2018, the income share of the 20% richest households was 6.0 times higher than that of
the 20% poorest, down from 6.6 in 2017. This is the lowest S80/S20 ratio since 2010, but it
remains well above the EU average (5.2). While job creation helped improve the income of
14
EAPN ES – EAPN Spain
Calle Tribulete 18, 28012, Madrid, Spain.
Web: https://www.eapn.es/the poorest, the income share of the poorest 40% of the population, at 19.1% in 2018,
remained below its pre-crisis levels and the EU average (21.0%). 4
2.4. In-Work Poverty
Before the breakout of COVID-19, Spain’s employment rate remained largely below the EU
average. Given significant labour market segmentation, stagnant incomes and the limited
redistributive capacity of social transfers, income inequality is high, though decreasing, as
explained before.
There is a widespread use of temporary contracts, which do not carry unemployment
benefits, and therefore generate instability and lack of income. Involuntary part-time work,
particularly among women who use them to reconciliate with their often solely assumed
family responsibilities, and the incidence of bogus self-employment among platform workers
are other areas of concern regarding in-work poverty.
In-Work Poverty was 11.7% in 2008, peaked up to 14.8% between 2012 and 2015, and is
currently placed at 13.2% of the occupied population. Precarious working conditions
affect young people to a greater extent. Among those under 30 years of age, this percentage
climbed to 16.3%. The rise in the rates of working poor while the economy was expanding
coexists with the increase in forms of underemployment.
Graph 5. In-work Poverty, 2008-2019, in percentages
20
15 14,8 14,2 14,8 14,1 14,1 13,8 13,2
11,7 11,6 11,7 11,7 11,7
10
5
0
2008 2009 2010 2011 2012 2013 2014 2015 2016 2017 2018 2019
Source: INE, Encuesta de condiciones de vida, 2020
Job creation continues to support a reduction in the share of people at risk of poverty or
social exclusion, but in-work poverty is still disproportionately high. There are four possible
explanatory variables: 1) Internal devaluation and the limited effect of the minimum
wage in reducing in-work poverty; 2) The “dumping effect” of the informal work at the
shadow economy; 3) The persistent youth unemployment and 4) Gender inequality at
the labour market, mainstreamed into the three previous variables.
2.4.1.1. Internal Devaluation: The limited effect of the Minimum Wage in reducing in-work
poverty
4 European Commission, Country Report Spain, 2020.
15
EAPN ES – EAPN Spain
Calle Tribulete 18, 28012, Madrid, Spain.
Web: https://www.eapn.es/Internal devaluation is an economic and social policy option whose aim is to restore the
international competitiveness of a country mainly by reducing its labour costs – either wages
or the indirect costs of employers. Sometimes internal devaluation is considered as
alternative to 'standard' external devaluation when nominal exchange rates are fixed, as in
the Eurozone, although social implications and speed of economic recovery can significantly
differ between the two options. The scientific basis and efficacy of this policy is very
controversial. The theory seems to be grounded on several myths, the main of which refers
to the need to create harsh conditions for employees and unemployed in order to increase
the productivity of the workforce.5
In Spain, labour market institutions guarantee adequate social dialogue, and the 2019 and
2020 increases of minimum wage are examples. However, there is still a long road for the
minimum wage to reach the purchasing power of 2008.
Spanish workers have lost an average of 7% of purchasing power in the last 25 years,
a period in which there have been gains, but also sharp declines: with the economic crisis,
wages have lost 20% compared to inflation. A study carried out by the consultancy firm
CEINSA reflects that salaries tend to react with at least one-year delay to changes in the
economic cycle.
The most serious wage reduction originated in layoffs in staff or cuts in working hours through
employment regulation files, but there was also a wage freeze for stable staff. With the 2011
and 2012 labour reforms, the wage cuts ceased to be an exceptional event, but became a
generalized pattern. Other indirect ways were to apply “entry wages” in new hires that were
much lower than those that the company had been paying previously, to eliminate
supplements or to reduce the amounts paid as variable compensation. Between 2009 and
2014 there was a sustained pressure towards the reduction of real wages. In the years prior
to the crisis (1994-2008), the evolution of wages showed a high correlation with the CPI and
GDP, and wages grew with an average gain of more than 9% compared to inflation. Since
2008, the CPI has ceased to be, at least temporarily, the basic reference for determining
increases, with the result that at the peak of the crisis, wages fell even when inflation rose.6
An additional problem is that the rise in the Minimum Wage only affects those employees
who are not covered by a sectoral collective agreement, that is around 2 million workers,
both permanent and temporary, for any activity in agriculture, industry and services,
regardless of the sex or age of the workers. According to the government, with the latest
increase in the Minimum Wage there will be "a reduction in the gender wage gap, since it
affects 56.74% of women compared to 43.26% of men".7
5 Uxó, Jorge; Paúl, Jesus and Febrero, Eladio (2009), Internal devaluation in the European periphery. The story of
a failure. UCLM, at
https://www.researchgate.net/publication/270896333_Internal_devaluation_in_the_European_periphery_the_story_of
_a_failure
6 Heraldo de Aragon, March 19th 2020, at https://www.heraldo.es/noticias/economia/2020/03/10/informe-poder-
adquisitivo-ceinsa-1363089.html
7 “Subida del SMI en 2020”, at https://a3.wolterskluwer.es/blog/subida-del-salario-minimo-interprofesional-2020 The
government is probably based on this official report, Mujeres en el mercado de trabajo, mujeres pensionistas y
mujeres migrantes en el siglo XXI, available at
http://www.mitramiss.gob.es/es/destacados/HOME/documentos/Informe_mujeres_febrero_2019.pdf
16
EAPN ES – EAPN Spain
Calle Tribulete 18, 28012, Madrid, Spain.
Web: https://www.eapn.es/“The gender pay gap is reduced in the Community of Madrid by one point due to the
rise in the minimum wage”
In the Community of Madrid, in 2018, the average salary of men was 29,573 euros and that
of women 21,906 euros. This figure represents a reduction of 0.73% in the gender gap
compared to 2017, a gender-equality advance with a hidden trap, according to the Trade
Union UGT: It is only explained by the increase in the Minimum Wage.
“It is not so much because the salary situation of women has been corrected, it is because
we are at the lowest of the salary tables”, indicates Ana Sánchez de Coba, secretary of
Equality of the Union, on the reduction of the gender pay gap. In other words, since there are
more women than men in the salary brackets with lower incomes, the increase in the
Minimum Wage benefits them to a greater extent.
The number of women with wages below 1.5 times the MW is higher than that of men,
specifically 106,278, while with salaries above that amount the difference in favour of men
shoots up, 235,508 more than women, according to the data collected by the union. These
contributions have an impact on subsequent benefits, such as unemployment benefits.
In fact, when women are out of work they earn, on average, about 400 euros less in
unemployment benefit than men, a gap of 10.70%. "Women would have to work nine more
years to have a pension similar to that of men, it is devastating," explains the Secretary of
Equality of UGT. 8
Although the Minimum Wage9 is applicable in most of the regions and cases, there are some
exceptions. 1) Care and domestic workers perceive a different amount, established at 7,43
euro/hour. 2) The Royal Decree Law does not specify how the calculation of the Minimum
Wage for piece-rate workers should be made (that is, per unit of work performed), and if the
minimum rate corresponds to a cost per hour, and in that case, what hours of work are taken
into account, or at a monthly rate. 3) The regional exceptions are the Autonomous Cities of
Ceuta and Melilla, who can establish the interprofessional Minimum Wage "as an indicator
or reference of the level of income to determine the amount of certain benefits or to access
said aid, benefits or public services". 4) There is a fourth situation of exception, that is when
the Minimum Wage is included in a collective agreement, also as a “reference” and not as
“compensation”. This increase in the minimum wage is intended to give effect to “the right to
a fair and sufficient remuneration that provides a decent standard of living”, in line with that
established by the European Committee of Social Rights, which has interpreted that
threshold to be 60% of the average wage of workers.
The percentage that represents the Minimum Wage with respect to the regional average
wage is highly variable: there are 9 Communities where the Minimum Wage exceeds this
threshold, compared to others that do not reach it.10 Specifically, the Minimum Wage already
8 Julia Cadenas, “La brecha salarial se reduce en Madrid en un punto por la subida del salario mínimo”, El País,
February 18th 2020, at https://elpais.com/ccaa/2020/02/18/madrid/1582033407_413048.html
9 Minimum Wage per day: 31,66 euros. Per month (14 payments): 950 euros.
10 Pablo Cerezal, El salario mínimo ya supera el 60% del sueldo medio en nueve comunidades, Expansión, January
27th, 2020, at https://www.expansion.com/economia/2020/01/26/5e2dbe1fe5fdeab3608b456e.html
17
EAPN ES – EAPN Spain
Calle Tribulete 18, 28012, Madrid, Spain.
Web: https://www.eapn.es/represents 67.6% of the average wage in Extremadura, followed by the Canary Islands
(65.9%) and Castilla-La Mancha (63.2%), while Murcia, Comunidad Valenciana, Andalucía,
Galicia, Castilla y León and Balearic Islands would be near the threshold set by the
Government.11 The fact that these 9 regions are now above the 60% level of the average
salary could be concerning, since they all account for more than half of employment in Spain
as a whole. Therefore, although the rest of the Autonomous Communities would not notice
the impact of the rise in the MW, a good part of the labour market would be impacted.
2.4.1.2. The “dumping effect” of the informal work at the shadow economy
The irruption of the COVID-19 pandemic and the impact of the confinement and
lockout measures on the economy forced the shadow economy to (partially) come out
to light.
In 2016, Friedrich G. Schneider estimated that the shadow economy in Spain represented
24.5% of the 2015 GDP. Other studies of the same nature, using a similar methodology,
lowered it to slightly less than 18 % in 2016.12 All the estimations placed it well above the
12% average for the OECD.
Most experts consider that between two million and four million people would be working
informally, in one way or another in the underground channels of the economy.13 Due to the
COVID-19 restrictions and the freezing of the productive activity, they would find themselves
in an extreme situation.14
The crisis has left these millions of workers without income. Those whose incomes depend
on sporadic jobs or receive a part of their income in the shadow are scattered throughout
almost all productive sectors, mainly services and agriculture. That is particularly prevalent
in the case of the most precarious workers, although in recent years the shadow economy -
due to outsourcing or labour deregulation of the formal market- increasingly gets to qualified
professionals who are part of a chain of activity outside the formal economy.
11 However, it must be borne in mind that these figures are calculated on the total average wage, including part-time
workers, since the National Institute of Statistics does not break down the data for the Autonomous Communities
between both categories, so the data endings could be somewhat lower.
12 Fernandez Leiceaga, Joaquín; Lago Peñas, Santiago; Martínez-Vazquez, Jorge and Vaquero-García, Alberto (2018),
Economía sumergida y fraude fiscal en España: ¿qué sabemos? Una panorámica de la literatura, FUNCAS. At
https://www.researchgate.net/publication/325870461_Economia_sumergida_y_fraude_fiscal_en_Espana_que_sabem
os_Una_panoramica_de_la_literatura
13 Shadow economy. Estimates of unregulated, undeclared production as a percentage of recorded GDP, using the
multiple-indicators-multiple-causes approach. Informal work. Any form of unregulated, unregistered, or undeclared
work, as a dependent worker, unpaid family member, or an own-account or self-employed worker. Informal dependent
employment. Undeclared, dependent, salaried employment, proxied with three measures: employees in firms of 10 or
fewer or five or fewer workers; employees not contributing to social insurance; employees without a written
employment contract in their main job. Informal self-employment. Own-account, independent work as a sole trader or
employer, distinguished from “formal self-employment” and “professional self-employment” by (a) nonprofessional
occupation, or (b) employment by five or fewer workers. Truman Packard, Johannes Koettl, and Claudio E. Montenegro
(2012) In From the Shadow. Integrating Europe’s Informal Labor. World Bank, DIRECTIONS IN
DEVELOPMENT, Human Development 70602, page 9, at
http://documents1.worldbank.org/curated/en/458701468035954123/pdf/706020PUB0EPI0067902B09780821395493
.pdf
14 El Confidencial, April 5, 2020, at https://www.elconfidencial.com/economia/2020-04-05/economia-sumergida-
coronavirus-pandemia-negro-hosteleria_2534287/
18
EAPN ES – EAPN Spain
Calle Tribulete 18, 28012, Madrid, Spain.
Web: https://www.eapn.es/There is abundant evidence that the phenomenon of employment outside the legal channels
is very relevant, since it plays a role as a competitive force in the formal labour market
and is a factor that drives down wages.
As most of the informal jobs are performed by undocumented migrants, low-income
workers are agitated by xenophobic political parties in order to direct their anger
towards them, while protests should be directed to those Spanish employers who
make huge profits through their exploitation. In turn, these employers allege that “the
market is very competitive” and that “their prices should be kept low”, justifying their
need to hire informally as a survival strategy of their economic sector.
"We do the work that nobody wants to do, and they don't want to see us, not even on
the streets"
At the beginning of the nineties, a radical change took place in the Murcian countryside and
the native workers were replaced by immigrant labour, especially Moroccan, who arrived
first, and then Ecuadorian, although there are also day laborers from sub-Saharan Africa or
Europe from the East. Currently, the Region of Murcia, with a 14% foreign population,
employs agricultural workers almost the year around. This makes many immigrants prefer to
live in the Region compared to other agricultural areas of the country, where the agriculture
is more seasonal.
In Murcia there is a reserve of cheap labour installed: employers have many people to turn
to and can offer lower salary conditions. Agriculture is fundamental in the economy of the
Region: it accounts for 20% of GDP compared to 2.7% for the country as a whole. This may
explain a certain degree of tolerance to the shadow economy and the informal work.
The days of field workers are usually between 13 and 15 hours a day, including transport,
since in many cases the day laborers have to travel to destinations such as Albacete, Alicante
or Granada, out of the Autonomous Community. In addition, work is mostly piecework, that
is, it is paid by the number of pieces collected and not by hours - a worker can collect up to
2,000 lettuces a day, while the piece is paid at 0.046 euro cents in 2019-.
These testimonies are explanatory of the situation described above:
- "Entrepreneurs want to enrich themselves quickly and by the sweat of many without
stopping, so that nothing is missing for the orders that come from abroad," says
Mustapha Ziani, leader of the Alafa Union.
- "We have 80% of the contracts that are made in the field through a Temporary
Employment Company and the piecework has returned. The precariousness of the
field has deepened, which was already high," says sociologist Andrés Pedreño.
- "We are a reality that they want to cover up. In fact, the Spaniards are never going
to put up with the abuses of the Murcia’s countryside business culture. But all the
time you hear on the street that the Moors come to steal or that they come to live on
government aid. In Murcia you don't even see a Moroccan working as a cashier at
the Mercadona (supermarket) or as a bus driver, as it happens in France"." Mustafá
Sadir denounces.
19
EAPN ES – EAPN Spain
Calle Tribulete 18, 28012, Madrid, Spain.
Web: https://www.eapn.es/- “When you are illegal it is even possible not to charge. A lot happens with temporary
work agencies in fruit picking jobs, such as apricots or peaches, which work for a
week or ten days at most. There they tend to use a lot of illegal labour and as they
change farms it is very difficult for the labour inspectorate to catch them”, says
Mustafa Sadir, trade union delegate of Comisiones Obreras in Torre Pacheco.15
2.4.1.3. Youth unemployment, the highest among the EU-27
The British economist Guy Standing defines the “precariat” as those workers who are not
capable of looking beyond their day to day, with jobs or occupations that allow them just to
survive. One of the faces in which this precariat is embodied are young people, who
concentrate unemployment rates above the average, wages below the average and a
temporary employment rate above the average.
According to Eurostat, Spain has the highest youth unemployment of the EU 27. Compared
to an EU-27 average of 17% for those under 25, Spain peaks to the highest point, with 41.7%.
The situation is even worse for young women.
Table 12. Unemployment by sex, Under 25 years old – July 2020
Both Males Females
sexes
EU-27 17.0 16.8 17.2
Spain 41.7 41.4 42.0
Eurostat, https://appsso.eurostat.ec.europa.eu/nui/submitViewTableAction.do
The most qualified young people are having some access to jobs, although in a very small
number. In general, the job growth experienced by the Spanish economy since 2014 is not
benefiting youth employment.
15Elisa Reche, “Jornaleros inmigrantes en Murcia: Hacemos el trabajo que nadie quiere hacer y no nos quieren ver, ni
siquiera en las calles", May 18 2019, El diario, at https://www.eldiario.es/murcia/sociedad/jornaleros-murcia-
hacemos-trabajo-siquiera_1_1545991.html
20
EAPN ES – EAPN Spain
Calle Tribulete 18, 28012, Madrid, Spain.
Web: https://www.eapn.es/Table 13. Occupied by sex and age group. Percentages with respect to the total for
each sex
AGE groups Both sexes Men Women
16-19 0.5 0.6 0.3
20-24 3.7 3.8 3.6
25-29 8.1 7.7 8.5
30-34 10.2 10 10.4
35-39 12.7 12.7 12.8
40-44 15.9 15.7 16
45-49 15.5 15.6 15.3
50-54 14 14.1 13.8
55-59 11.6 11.7 11.4
60-64 6.7 6.8 6.6
65-69 1 1 0.9
70 and more 0.3 0.3 0.2
INE, Encuesta de Población Activa, 2º term 2020
On the other hand, the working conditions of young employees have deteriorated
substantially with an increasing proportion of temporary hires and a decrease in wages.
Young people are the main employees in "atypical jobs", platform workers, Internet-based,
etc. Finally, on this issue too, great regional disparities are found in terms of the recent
reduction in youth unemployment and the slight creation of youth employment since 2014.
Policies to improve young people’s integration into the labour market are making very slow
progress. In Spain, the Youth Guarantee is not working as expected, particularly for young
people with difficulties or/and in poverty and social exclusion.16
“Young people in precarious conditions: Languages, career and master's degree for
little more than the minimum wage”
Paula, at 28 years old, not a year ago signed her first contract with a certain job stability. This
young woman born in Lleida, Catalunya, is a researcher specialized in evolutionary genetics.
She already has a degree and a master's degree and a second master's degree on the way.
She has just signed a four-year predoctoral contract at the University of Barcelona (UB) and
earns 1,000 euros per month, 50 above the Minimum Wage. "In Barcelona this is just enough
to barely survive and little else," she says.
Using bioinformatic tools Paula is investigating the genome of some spiders from the Canary
Islands. "They are interesting to study specialization and adaptation processes," she
explains. From the last year of her degree until her current contract, this young woman has
combined her studies with 'mini-jobs' as an administrative clerk, a clerk in a fast food chain
or as a pub’s bar-tender. "I spent almost two years waiting for the funds for my doctoral
16 EAPN (2018), “El acceso de la Juventud en exclusión a los Programas de Empleo Juvenil”, at
https://www.eapn.es/empleoJuvenil/estudio.php
21
EAPN ES – EAPN Spain
Calle Tribulete 18, 28012, Madrid, Spain.
Web: https://www.eapn.es/project to be approved. If I had known that I would have to wait in hold for so long, with that
uncertainty, I would not have accepted it. In this profession they take advantage of our
vocation," she says.17
2.4.1.4. Gender Inequality at the labour market
Spanish legislation reflects efforts to promote gender equality. Spain is ranked among the
most advanced countries in terms of equal legal rights for men and women. Measures
adopted at the beginning of 2019 promote equal rights in the workplace. All employers are
required to keep mandatory records of the average wages of men and women, while
companies with more than 50 employees (against 250 before) have to negotiate equality
plans with workers’ representatives. Parental leave of 16 weeks for each parent will replace
the maternity and paternity leaves by 2021. In the meantime, the parent other than biological
mothers are entitled to eight weeks’ leave in 2019 (it was five in 2018) and 12 weeks in 2020,
to reach 16 in 2021.
However, there are major gender inequalities that produce higher poverty and exclusion
levels. The economic crisis and austerity policies have affected women the most. There has
been a reduction in social spending that manifested itself in a lower supply of goods and
services aimed at families. At present, the levels of 2008 have not been recovered yet.
Families and, within them, women have compensated with their reproductive work for this
drop in social costs, particularly in the area of care, including dependent people. Cuts in care
services have led to their privatization and / or a return to traditional gender roles, by
transferring responsibility from society to households, that is, to women. The new situation
with the COVID-19 is reinforcing this process, leading more women into economic
inactivity, unemployment, unvoluntary part-time and precarious jobs, due to
reconciliation with their increased family responsibilities and/or to discrimination at
the labour market.
“COVID-19 and the precariousness of female employment: testimony of a worker
when she has not received her salary for two months due to the State of alarm”
“My name is Mariah Oliver and I teach after-school English at a public school in the Sierra
de Madrid. On March 9th, the closure of all educational centres in the Community of Madrid
was announced, and on the 10th my company communicated that this suspension affected
us and that, therefore, we would not have classes until March 26th, in principle.
My mother is a cook in a privately-owned nursery school, and -at the same day- she was
notified of the closure. On the morning of the 11th, she received a communication via
WhatsApp saying that the company had requested a temporary employment regulation file
(ERTE).
17Gabriel Ubieto, “Jóvenes en precario: Idiomas, carrera y máster por poco más del salario mínimo”, El Periódico,
October 24 2019, at https://www.elperiodico.com/es/economia/20191024/reportaje-experiencias-jovenes-trabajo-
precario-7699733
22
EAPN ES – EAPN Spain
Calle Tribulete 18, 28012, Madrid, Spain.
Web: https://www.eapn.es/I tried to reassure my mother, who receives the scrapped minimum wage, but it is difficult,
many questions and no answers. When can you request the benefit? Will the Social Security
collapse these days when thousands like her are out of work?
In the afternoon of the same day 11th I received an email with the same information. Our
company is also preparing an ERTE, they will notify us when there is news and we can go
for our papers. Neither of them has even received a phone call.
If the ERTEs are not approved, will the companies pay or appeal the decision? If approved,
when will they be that? When can we start requesting benefits? Is there anyone aware,
someone who cares, that there are people who cannot spend two months waiting to
collect our salary?
In my case, it is a complementary salary to my main job, but in my mother's (and in that of
so many others) it is her only source of income. Finally, yesterday we reflected together
on how, again, this is a crisis that women are enduring more than anyone. Because,
let's face it, we are the vast majority in the affected sectors: cooking, cleaning, early
childhood education, complementary activities, extracurricular activities, care ....”.18
A set of inequalities is related to the labour market. The constant increase in
unemployment during the economic crisis justified a greater social "tolerance" towards
discrimination based on gender, age and ethnicity or origin. There are employers (and even
employers' leaders) who consider that women are less desirable as workers due to
pregnancy, childbirth, breastfeeding, maternity, incompatibility of schedules (due to taking
care of the elderly, babies or disabled people), or simply because of the fact of being a
woman of reproductive age. 19
Statistics on the labour market indicate that women have a higher rate of inactivity and
unemployment, an employment gap, as well as a pay gap, a higher rate of temporary
employment and involuntary part-time, among other aspects. The gender wage gap is made
up of more elements than a salary difference between co-workers of different sexes, such as
salary supplements, which are applied on a discretionary basis. If it were only about that
difference, it could be classified as direct wage discrimination prosecuted by law. But the
reality is more complex, and that gap is formed by factors that mean that at the end of the
year, all female workers in the country are earning 14.9% less per gross hour than male
workers, according to Eurostat. 20 In 2017, the average annual earnings of working women
were € 20,131.41 and that of working men: € 25,924.43. The gender pay gap in the average
annual earnings is € 5,793.02 per year (22.35%). A series of factors make the existence of
the gender pay gap possible and chronic, among which it is worth highlighting the higher
18 “Dos meses sin cobrar el sueldo”, March 13th 2020, https://elpais.com/espana/madrid/2020-03-13/dos-meses-sin-
cobrar-el-sueldo.html
19 Malgesini, Graciela and Oviedo, María José (2019), Género y Desigualdad. Empoderamiento y defensa de los
derechos de la mujer en España. Madrid, EAPN Spain, At
https://eapn.es/ARCHIVO/documentos/documentos/1587468121_estudio-gnero-y-derechos_empoderamiento-y-
defensa.pdf
20 Ministerio de Trabajo Ministerio de Trabajo, Migraciones y Seguridad Social (2019), Mujeres en el mercado de
trabajo, Mujeres pensionistas y mujeres migrantes en el siglo XXI, pp.29-30, at
http://www.mitramiss.gob.es/es/destacados/HOME/documentos/Informe_mujeres_febrero_2019.pdf.
23
EAPN ES – EAPN Spain
Calle Tribulete 18, 28012, Madrid, Spain.
Web: https://www.eapn.es/You can also read