Possible mechanisms related to internal dynamics for anomalously high rainfall during August 2020 of Indian Summer Monsoon
←
→
Page content transcription
If your browser does not render page correctly, please read the page content below
Possible mechanisms related to internal dynamics
for anomalously high rainfall during August 2020 of
Indian Summer Monsoon
Malay Ganai
IITM: Indian Institute of Tropical Meteorology
Sahadat Sarkar
IITM: Indian Institute of Tropical Meteorology
Radhika Kanase
IITM: Indian Institute of Tropical Meteorology
R. Phani Murali Krishna
IITM: Indian Institute of Tropical Meteorology
P Mukhopadhyay ( parthasarathi64@gmail.com )
Indian Institute of Tropical Meteorology https://orcid.org/0000-0001-8770-9167
Research Article
Keywords:
Posted Date: January 12th, 2022
DOI: https://doi.org/10.21203/rs.3.rs-1239524/v1
License: This work is licensed under a Creative Commons Attribution 4.0 International License.
Read Full License
Page 1/31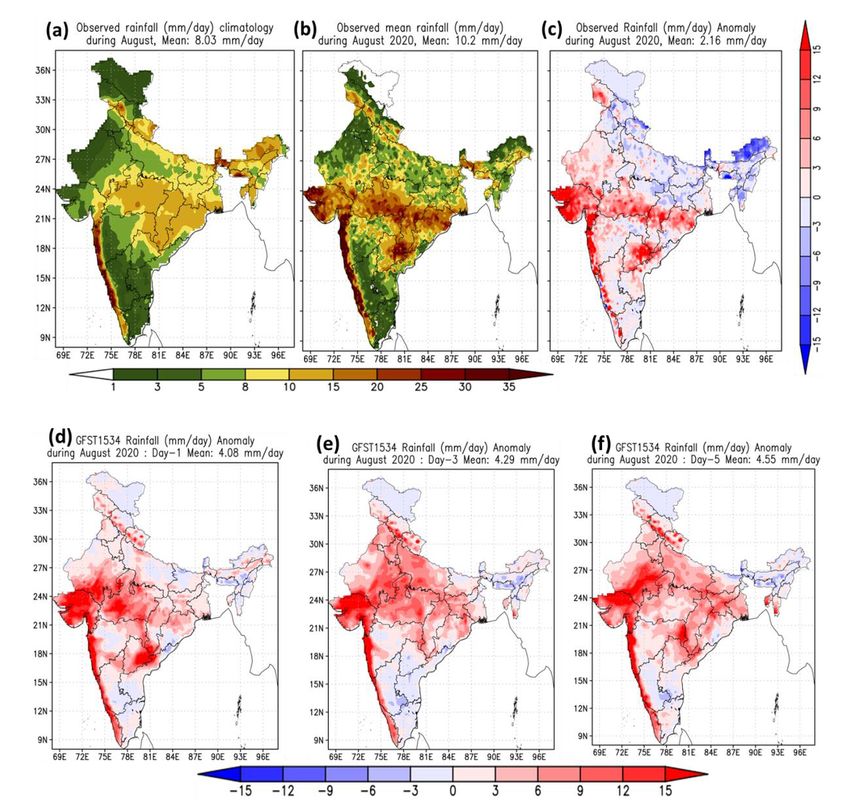
Abstract
In the present study, an investigation is made to understand the physical mechanism behind the
anomalous high rainfall during August 2020 over the Indian subcontinent using both observation and
GFS T1534 weather forecast model. According to India Meteorological Department (IMD), the country
receives 27% excess rainfall in the month of August 2020. The excess rainfall is mainly contributed by
the 5 well marked low pressure systems which formed over Bay of Bengal and moved west-
northwestwards across central India up to Western Madhya Pradesh and Rajasthan. The analysis reveals
that the observed anomalous rainfall is distributed over central India region extending from coastal
Orissa to central part of Chhattisgarh, Madhya Pradesh and western coast of Gujarat region. It is also
found that the August-2020 heavy rainfall is mainly contributed by the synoptic (2-10 days) component
of the total rainfall whereas the contribution of the large-scale intraseasonal oscillation (ISO) component
(10-90 days) is quite less. Although the present operational Global Forecast System (GFS) T1534 (GFS
T1534) is able to predict the anomalous high rainfall with day-1 lead time, it underestimates the
magnitude of the synoptic variance. Further, the large-scale dynamical and thermodynamical parameters
show anomalous behaviour in terms of strong low level (850 hPa) jet, vertical velocity and associated
moisture convergence in the lower level. The GFS T1534 is able to forecast the above large-scale features
reasonably well even with day-5 lead time. From energetics analysis, it is found that the mean kinetic
energy (MKE) is stronger for August 2020 as compared to climatological value and the strong MKE
efficiently transfers the energy to the synoptic scale, and hence the synoptic eddy kinetic energy is
higher. Along with that, the ISO scale kinetic energy for August 2020 is less compared to the August
climatological value. GFS T1534 model has some fidelity in capturing the energy conversion processes,
but it has some difficulty in capturing the magnitude with increased lead time.

1 Introduction
The Indian summer monsoon (ISM) brings about 80% of the annual rainfall and the Indian population
heavily depends on this water for agriculture, industry and other socio-economic activities. Therefore, any
variation in timing, duration and intensity of the monsoon rainfall has a significant impact on the
livelihood of the people over the region. In recent decades, studies (Goswami et al. 2006; Rajeevan et al.
2008; Roxy et al. 2017) have highlighted the increasing trend of extreme rainfall over the Indian region. As
a result, different parts of the country become vulnerable to devastating flood related incidents (e.g.,
Mumbai, 2005; Uttarakhand, 2013; Chennai, 2015; Kerala, 2018 etc.) in recent times. These floods related
events from extreme rainfall have severely affected human livelihood. Each year, flooding from extreme
rainfall events over India results in a loss of about $3 billion, which amounts to 10% of the global
economic losses (Roxy et al. 2017).

According to the India Meteorological Department (IMD), the summer monsoon rainfall over the country
as a whole during the year of 2020 was above normal and was 109% of its Long Period Average (LPA)
based on the data of 1961-2010. During 2020 monsoon season, the four broad homogeneous regions
(defined by IMD) of the country namely Central India (CI), South Peninsula (SP), Northwest (NW), and
                                                  Page 2/31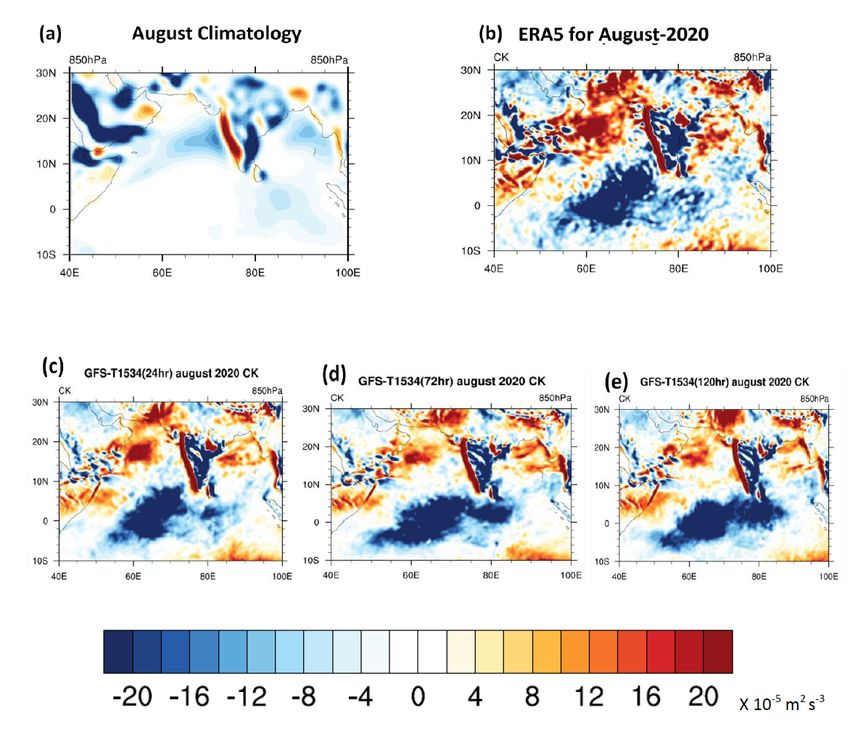
East and Northeast India received seasonal rainfall of 115%, 129%, 84% and 106% of its LPA respectively.
Therefore, seasonal rainfall has been above normal over CI, SP, and East and Northeast India and
deficient over NW India. IMD further reported the monthly rainfall variation for the summer season of the
year of 2020. It is found that the season is placed in the historical record for its unique and contrasting
monthly variation. The June, July, August and September rainfall over the country as a whole was 118%,
90%, 127% and 104% of its LPA respectively. In the month of August of 2020, the country has received
27% excess rainfall. According to IMD, such large excess rainfall was reported in August of 1926 (33%
above normal) and 1976 (25% above normal) during the period of 1901-2020. The anomalous high
rainfall in August of 2020 has brought widespread flooding in the CI and SP region. The large excess
rainfall in August 2020 is mainly contributed by the 5 low pressure systems (LPS) formed over the North
Bay of Bengal (BoB) during 4-10, 9-11, 13-18, 19-26 and 24-31st August. These synoptic LPS moved west-
northwestwards across CI up to Western Madhya Pradesh/Rajasthan. Figure 1 (solid lines) shows the
track of these LPS based on observation. IMD further reported that the monsoon trough was active and
lies south of its normal position during most of the days in August, 2020. Consequently, the active
monsoon condition prevailed in the country (except East and Northeast India) for the whole month of
August.

The spatio-temporal variability of the ISM rainfall is associated with the internal dynamics (intraseasonal
oscillations) and to the external forcing like El Nino Southern Oscillation (ENSO), Indian Ocean Dipole
(IOD), Eurasian snow cover, north Atlantic oscillation, etc. (Goswami and Ajaya Mohan 2001; Wu and
Kirtman 2004; Saji et al. 1999; Saha et al. 2013 etc.). The northward propagating low-frequency (30-60
days) component and the westward propagating high frequency (10-20 days) synoptic scale component
of the intraseasonal oscillation contribute equally to the intraseasonal active and break cycles (Goswami,
2005). Most of the heavy rainfall events over the Indian subcontinent are associated with the synoptic-
scale disturbances such as the depressions or the cyclonic storms moving across the country (Dhar and
Nandargi 1995). These disturbances originate over the warm oceanic water and are having a life time of
around 3-4 days. Active monsoon condition is characterized by clustering of low pressure systems over
the warm sea waters surrounded by the subcontinent. Kripalani et al. (2004) showed that the strength of
the summer monsoon is directly (inversely) linked to the faster (slower) 10-20 days (30-60 days) high
(low) frequency mode. Several observational studies (Dash et al. 2004; Ajayamohan et al. 2010) have
shown that the frequency of monsoon depressions has decreased, whereas the frequency of low pressure
systems has increased in the recent decades. This indicates a weakening trend in monsoon synoptic
activity.

In recent years, with the increase in computational resources, use of very high resolution numerical
weather prediction (NWP) models with advanced data-assimilation methods have shown improved
prediction skill and accuracy (Mass et al. 2002; Klingaman and Woolnough, 2014; Bush et al. 2015;
Mukhopadhyay et al. 2019). Studies (Kumar and Krishnamurti 2006; Sharma et al. 2019) have
demonstrated that high resolution models are often capable to predict the heavy rainfall associated with
the large and synoptic scale systems. However, Sharma et al. (2019) showed that the high resolution
models still find difficulty in accurately predicting the location, timing and duration of heavy rainfall
                                                  Page 3/31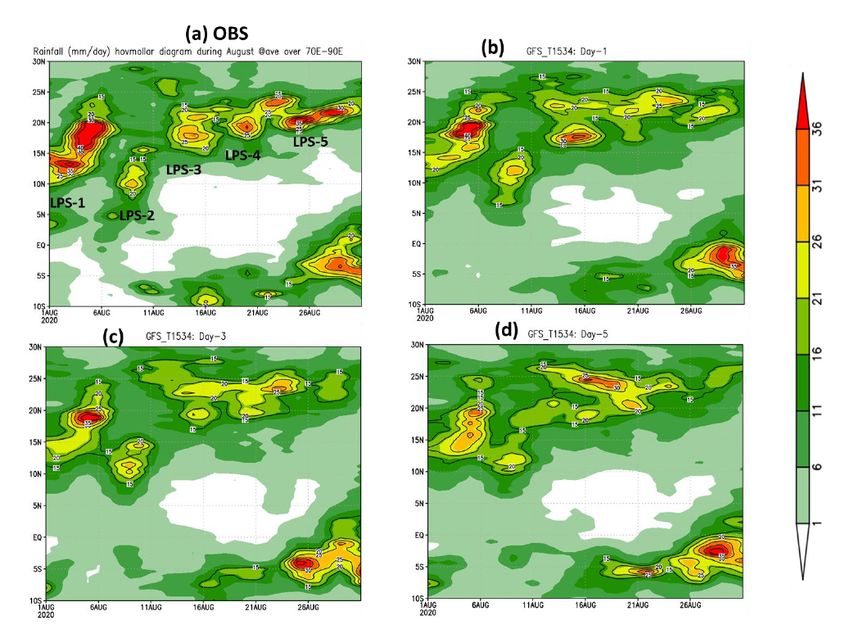
events associated with large and synoptic scale systems. Mukhopadhyay et al. (2019) showed that the
present operational short to medium range weather prediction model (Global Forecast System (GFS)) at
T1534 (~12.5 km) horizontal resolution has reasonable forecast skill in predicting spatio-temporal
variability of ISM rainfall distribution. Recently, Sarkar et al. (2021) have demonstrated that GFS T1534
model have some fidelity in capturing the precipitation, temperature and potential vorticity structure
during low to depression transition but the model has difficulty in capturing the heating structure, vertical
velocity and moisture convergence at the lower level.

While studies (Behera et al 1999; Saji et al 1999; Ashok et al 2001; Gadgil et al 2003, 2004) have shown
the association of ISM with the external forcing (ESNO, IOD, EQUINOO (Equatorial Indian Ocean
Oscillation, the atmospheric component of IOD), recent studies (Hsu and Yang 2015; Sarkar et al. 2017,
2018) have brought out the importance of internal atmospheric dynamics in terms of kinetic and
potential energy associated with boreal summer ISOs (BSISOs). Krishnamurti et al. (2013) has used the
Lorenz (1965) box energetics to understand the generation of available potential energy from convective
heating and the conversion of available potential energy to kinetic energy during evolution of monsoon
depression. Lau and Lau (1992) showed that condensation heating associated with cumulus convection
is the primary energy source for the tropical disturbances over the Indian region. They have also
demonstrated that there is kinetic energy conversion from the time-mean flow to the transient fluctuation.
Recent study by Sarkar et al. (2021) have shown that the MKE is stronger during the transition of low to
depression cases and it is to the south of the system centre. They have also shown that there is a positive
energy conversion from low frequency background state and the intraseasonal scale to the high
frequency synoptic scale eddy during the low to depression transition. To understand the more synoptic
activity during Aug-2020 from energy conversion perspective, we have calculated Mean Kinetic Energy
(MKE), Synoptic Eddy Kinetic Energy (SYN-EKE) and ISO scale Kinetic Energy (ISO-EKE) following Sarkar
et al. (2017, 2018).

Thus, the primary objectives of the manuscript are to investigate (a) the mechanism behind the observed
anomalous LPS activity which caused heavy rainfall in August 2020 and (b) to what extent the
operational short range weather forecast model (GFST1534) was able to capture the observed rainfall
distribution and its mechanism.

2 Data, Model And Methodology
2.1 Observation and Model data
The National Center for Environmental Prediction (NCEP) Global Forecast System (GFS) version 14.1.0
with spectral resolution of T1534 (~12.5 km) having 64 hybrid sigma-pressure levels (top layer 0.27 hPa)
is used for short range operational weather forecast over the ISM region. The present version of the
model is operational since 2018 summer monsoon season (Mukhopadhyay et al. 2019). The dynamical
core of the GFS model is based on a two-level semi-implicit Semi-Lagrangian (SL) discretization
approach (Sela 2010). The high-resolution NCEP GFS uses simplified Arakawa-Schubert (SAS) deep
                                                  Page 4/31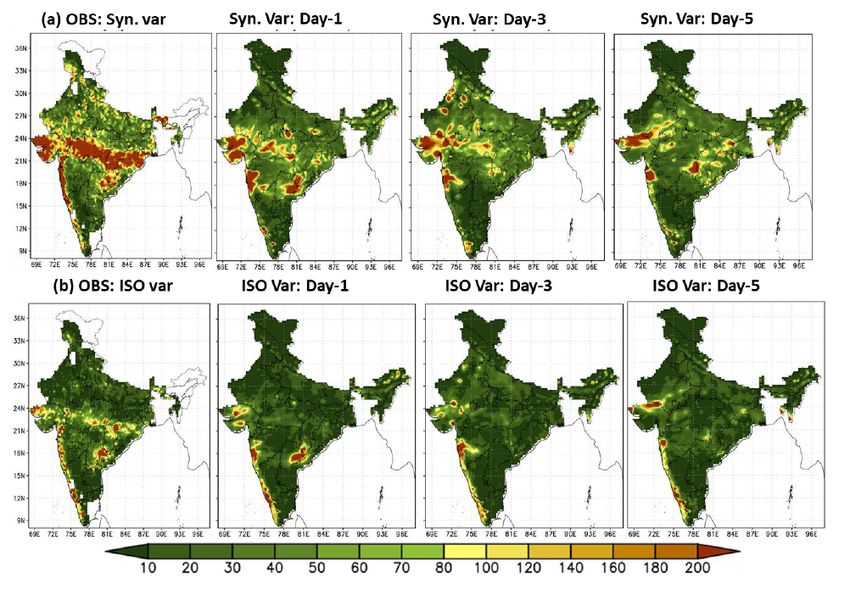
convection scheme (Pan and Wu 1995; Han and Pan 2011; Han et al. 2017) and mass flux based SAS
shallow convection (Han and Pan 2011) with Arakawa and Wu (2013) scale-aware parameterization. The
deterministic GFS also incorporates Zhao and Carr (1997) cloud microphysics scheme. Further, it has
shortwave and longwave radiation based on Rapid Radiative Transfer Model (RRTM) (Iacono et al., 2000;
Clough et al., 2005) with Monte Carlo Independent Column Approximation (McICA). Additional details
about the model physics can be found in Mukhopadhyay et al. (2019) and Ganai et al. (2021). Similar to
the above two studies, the model forecast is run daily for 10 days and the output is saved at every 3 hour
interval. In the present manuscript, Day-1 to Day-5 forecast of the month of August of 2020 is utilized
from GFS T1534 output. The model forecast runs are carried out at the Ministry of Earth Sciences high
performance computing facility “Pratyush” at the Indian Institute of Tropical Meteorology, Pune, India.
The initial condition for the model runs are generated by NCMRWF through the ensemble-based Kalman
filter (EnKF) data assimilation. Further detail about the data assimilation system is documented by
Prasad et al. (2016).

Several observational and reanalyses based data sets are utilized to validate the model forecast. To
evaluate the long term climatology of August rainfall, the daily rainfall data at 25 km resolution is used
for the year of 1961-2019 from IMD (Pai et al. 2014). Further, the gridded rainfall for the month of August
2020 is taken from merged product of rain gauge observations and Global Precipitation Measurement
(GPM) satellite-estimated rainfall data over the ISM region (Mitra et al., 2009). In addition to rainfall, the
fifth generation of ECMWF atmospheric reanalyses (ERA5) data (Hersbach and Dee 2016) is used at 25
km horizontal resolution for the year of 1999-2020 for the month of August. Similar to Mukhopadhyay et
al. (2019) and Ganai et al. (2021), the daily (24 hour) rainfall accumulation is calculated from 3 hourly
(03 UTC of previous day to 03 UTC of forecast valid day) GFS T1534 forecast data over the Indian region.
In order to calculate model climatological precipitation, the GFST1534 model hindcast for the period of
1999-2018 is used following Johny and Prasad (2020). The rainfall bias, correlation coefficient,
probability distribution function (PDF) and anomaly are calculated for both model and observation for
various lead time.

The standalone Geophysical Fluid Dynamical Laboratory (GFDL) vortex tracker is generally used to
provide an estimate of the vortex center position and track of the storm for the forecast duration. The
main variables used for tracking the vortex position are horizontal wind fields at 10m, mean sea level
pressure, vorticity at 850hPa and 700hPa, horizontal wind fields at 850hPa and 700hPa as well as
geopotential height at 850 hPa and 700hPa. It can be downloaded from https://dtcenter.org/community-
code/gfdl-vortex-tracker/download

The GFDL vortex tracker used in the present study is modified to track the low pressure area systems.
These modifications are in the threshold of 1) mean sea level pressure, 2) minimum azimuthally
averaged 850hPa tangential wind speed and 3) the distance between the center estimated from the mslp
field and the center calculated from the 850 hpa wind fields. The detailed information about running the
tracker is available in user’s guide available at https://dtcenter.org/sites/default/files/community-
code/gfdl/standalone_tracker_UG_v3.9a.pdf .
                                                   Page 5/31
2.2 Energetics Analysis
We have used mean kinetic energy budget (Hsu and Yang 2015; Sarkar et al. 2017) equation to
understand the energy conversion processes during Aug-2020. Also, we have analyzed GFS model fidelity
in capturing the energy conversion processes.

                                                        − −
The time-mean momentum equation is multiplied by u , v (following(OORT 1964)) and using both
                                                                          −     −2     −2
continuity and hydrostatic equations, mean kinetic energy [defined as K = ( u + v )/2] budget equation
can be written as-

                                                                                  ----------------------------- (1)

Over-bar is represented by the seasonal mean and the deviation from seasonal-mean is denoted by prime.
Horizontal velocity vector is represented by V, Horizontal gradient operator is denoted by ∇, ω is the
vertical pressure velocity, T is the temperature, P is the pressure, R is the gas constant for dry air and ϕ is
geo-potential.

CKm represents the eddy kinetic energy (EKE) to mean kinetic energy (MKE) conversion due to interaction
between time mean flow and high-frequency disturbance. EKE represents all the scale that are less than
the seasonal mean flow. CAm represents mean available potential energy (MAPE) to MKE conversion.
Eddy advections and local MKE changes are represented by BKm terms. Boundary flux of mean geo-
potential effect on MKE is represented by BGm . MKE changes due to sub-grid scale processes and
frictional dissipation are denoted by D m . The conversion from EKE and MAPE generate/dissipate the
local MKE and the other terms represent the redistribution of MKE. We have not considered the
dissipation and sub-grid scale processes in the present study. Synoptic-scale EKE is represented by [(u''2 +
v''2)/2] where double prime denoted the synoptic scale component (less than 10 days). ISO scale EKE is
represented by [(ũ2 + ṽ 2)/2] where tilde represents the ISO scale component (10-90 days). The energetics
terms are calculated from ERA5 data as well as GFS model data.

3 Results And Discussion
3.1 Anomalous rainfall activity in August 2020
The spatial distribution of rainfall over Indian subcontinent based on the IMD climatological long period
average (LPA) rainfall data for the month of August, IMD GPM merged data for the year of 2020, and the
anomalous rainfall for the month of August of 2020 are displayed in Figure 2(a-c). The climatological
mean rainfall for the month of August indicates moderate to heavier rainfall over central India (CI),
Western Ghats (WG) and northeast Indian region (Figure 2a). On the other hand, the rainfall during August
                                                   Page 6/31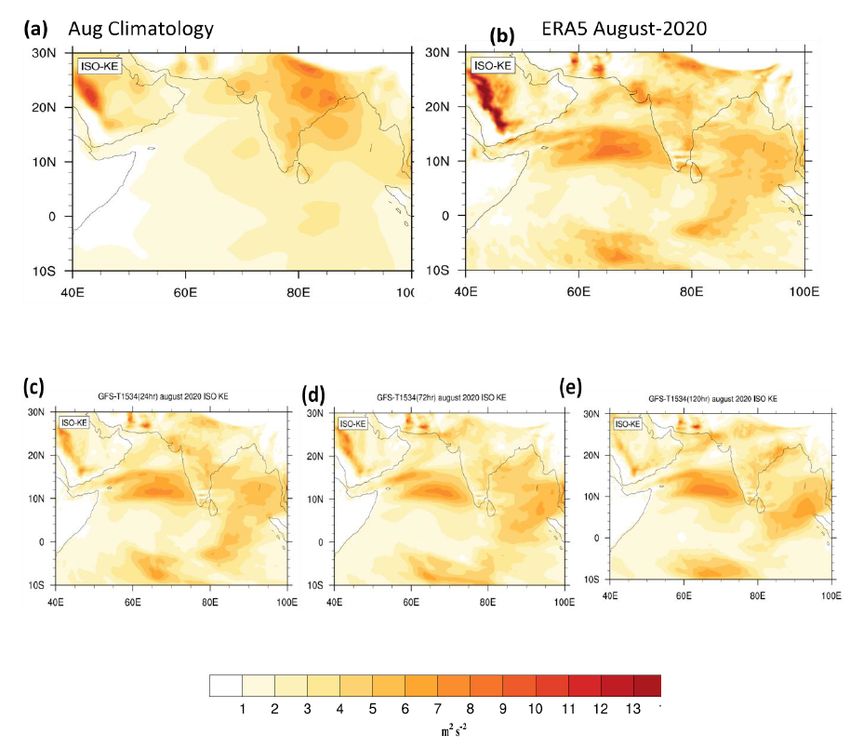
of 2020 shows anomalously high heavy rainfall over CI region extending from coastal Orissa to central
part of Chhattisgarh, Madhya Pradesh and western coast of Gujarat (Figure 2b and 2c). Additionally, the
southern Indian state of Telangana also receives exceptionally high rainfall during August of 2020. Unlike
climatological mean August rainfall, the northeast India experiences anomalously low rainfall during
August-2020 (Figure 2c). In terms of magnitude, all India rainfall is found to be 2.16 mm/day more than
the climatological mean. The excess rainfall over the CI region is actually contributed by the 5 LPS
systems moving across over the region (Figure 1). Interestingly, the heavy rainfall regions are confined to
the southwestern sector of the LPSs which is consistent with the study by Godbole (1977); Krishnamurthi
and Ajayamohan (2010). In order to assess the model fidelity in forecasting the rainfall for the month of
August 2020, Figure 2(d-f) demonstrated the anomalous precipitation for day-1, day-3 and day-5 lead
times respectively. GFS T1534 with day-1 lead time (Figure 2d) shows that the model is able to forecast
the spatial pattern of observed rainfall (Figure 2c) reasonably well. However, the magnitude of the rainfall
is slightly overestimated over the CI region. The model forecast for day-3 and day-5 indicates that the
spatial distribution of rainfall shifted towards northern India unlike observation (Figure 2e and 2f). Similar
to observed LPS tracks (Figure 1, solid lines), the model appears to predict the LPSs track reasonably well
(Figure 1, dashed lines). However, for some LPSs (19-26th Aug and 24Aug-2nd Sept), it appears that the
tracks are shifted slightly northward in the model forecast.

To evaluate the contribution of different categories of rainfall to the total rainfall, the rainfall PDFs are
shown in Figure 3a and 3b for both model and observation over Indian subcontinent and central India
respectively during August of 2020. The observed rainfall PDF shows that Indian subcontinent receives
higher contribution of heavier to extreme category rainfall (black bar) as compared to long term
climatology (red bar) (Figure 3a). Similar signature can also be seen over central India region (Figure 3b).
On contrary, model forecast depicts underestimation of heavier category and overestimation of lighter to
moderate category rainfall over Indian landmass region for all the lead time (Figure 3a and 3b). Similar
model (GFS T1534) deficiency in forecasting heavier category rainfall is shown by Mukhopadhyay et al.
(2019) and Ganai et al. (2021) over the Indian region. It is important to note that the model considerably
underestimates the observed climatological mean heavier category rainfall for all the lead time. It
indicates that efforts need to be taken to improve the above systematic bias in the model.

In order to find out the day to day rainfall variation in August-2020, the time series of rainfall is shown in
Figure 3 over Indian subcontinent. It is evident that most of the days in August the observed rainfall
(black line) are above the climatological precipitation (red line in Figure 3b). The GFST1534 forecast is
able to capture the daily rainfall variation even with day-5 lead time. The temporal correlation is found to
be high (>0.6) for day-1 to day-3 forecast. The model forecast further shows overestimation of rainfall for
day-1 to day-3 lead time (Figure 3c). It is interesting to note that all the rainfall days in August lies below
the observed one standard deviation (SD) line (black dashed line). As the observed heavy rainfall is
confined over the CI region (Figure 2c), the area averaged time series over the region shows more than 1
SD rainfall over many days (Figure 3d). The high resolution model forecast is able to predict the rainfall
peak in August for day-1 to day-3 lead time. This is further established from the temporal correlation

                                                    Page 7/31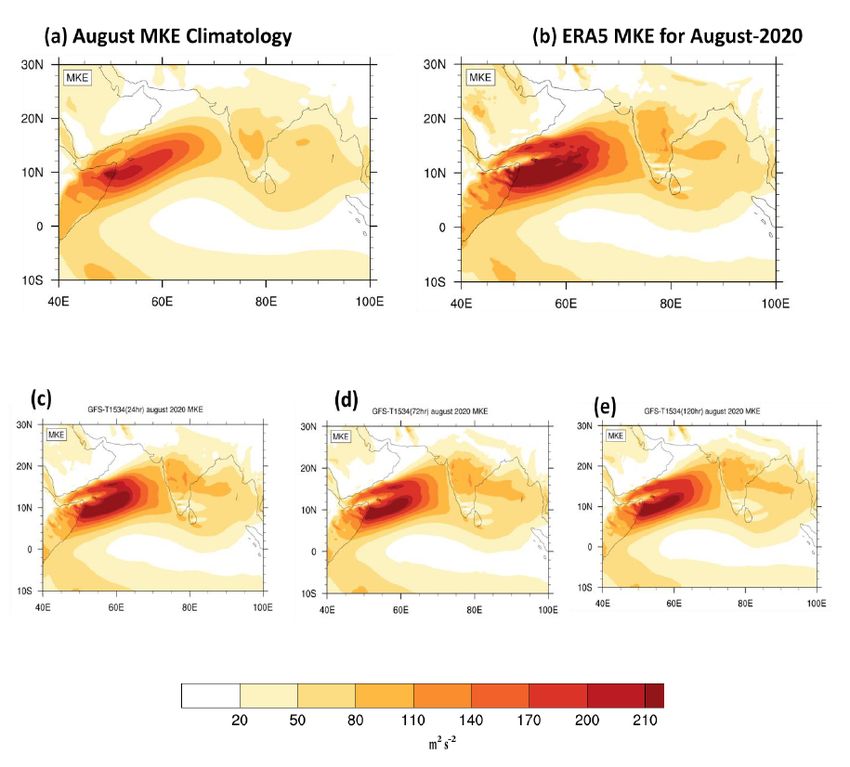
values as depicted in Figure 3d. The different observed rainfall peaks in August is due to the rainfall
associated with the LPS systems which is shown in Figure 1.

In order to investigate the northward propagation of the rainfall band during August of the year 2020, the
area averaged (70°E-90°E) hovmoller (latitude vs. time) diagram is shown in Figure 4. The observed
hovmoller plot (Figure 4a) indicates rainfall propagation associated with the different LPSs which formed
over BoB and then propagates over the Indian landmass region. The observed distinct rainfall bands are
associated with the LPS systems which are shown in Figure 1. The model forecast shows that it
reasonably predicts the propagation of the rainfall band associated with the LPSs with day-1 to day-3
lead time (Figure 4b and 4c). However, the magnitude of the rainfall band differs from the observation.
Interestingly, even with day-5 lead time, the model forecast shows some indication of rainfall band
propagation over the Indian landmass region.

3.2 Synoptic and ISO rainfall variance in August 2020
It is seen from earlier analyses that the anomalous high rainfall during August of the year 2020 is mainly
contributed by the west-northwestward propagating synoptic LPSs over CI region. To further establish the
above fact, the rainfall anomaly is divided into its synoptic and slowly varying large-scale components
due to ISOs. This will bring out the relative contribution of the two components associated with
anomalous August rainfall. By introducing Lanczos 2-10 and 10-90 day bandpass filters (Duchon 1979),
the synoptic and large-scale ISO components are separated out, respectively. Figure 5 depicts the
synoptic and ISO variance during August-2020. The observed high frequency synoptic rainfall variance
shows high variability extending from coastal Orissa to Chhattisgarh, Madhya Pradesh and western
coast of Gujarat (Figure 5a) including Telangana (Figure 5a). It indicates that the above regions receive
excess rainfall from synoptic LPSs as shown in Figure 2c. On the other hand, the model forecast shows
enhanced synoptic variance over the above regions for day-1 to day-3 lead time. However, model
prediction considerably underestimates the magnitude of the synoptic variance over the region and the
organized extended rainfall variance is missing in the model forecast though the heavy rainfall over the
west coast and in around Mumbai region is well captured. Similar underestimation of synoptic variance
is reported in coupled climate models by Goswami et al. 2014; Abhik et al. 2015. Further, the observed low
frequency large-scale ISO variance (Figure 5b) is considerably less over the anomalously high rainfall
region as seen in Figure 2c. However, the anomalously high west coast rain is captured by the model even
with day-5 lead. It implies that the contribution of rainfall from the large-scale ISO is quite less as
compared to synoptic component during August of the year of 2020. The model forecast appears to
underestimate the ISO variance for all the lead time particularly over the central Indian region. However, it
predicts the low frequency rainfall variance over the Telangana region for day-1 lead time. The above
analyses bring out the fact that the anomalously high rainfall over CI region is mainly due to the synoptic
LPSs which generated over BoB, moved towards the Indian landmass region and caused abundant
rainfall.

To further establish the above findings, the low-/high-pass-filtered precipitation from IMD-GPM and model
forecasts for scales >200 km (synoptic scales) and scales
August of the year 2020 in Figure 6. In order to compute the rainfall contribution from the synoptic scale (
i.e., >200 km), a Lanczos low-pass filter is applied on the rainfall data in the latitudinal and longitudinal
directions (Duchon 1979). The rainfall contribution from the smaller scales (spatial scale 200 km whereas the contribution from the mesoscale (200 km) rainfall reseanobly well with day-1 lead time (Figure
6b). However, for day-3 (Figure 6c) and day-5 (Figure 6d) leadtime, the synotic scale rainfall distribution is
shifted towards northern India which is consistent with the anomalous rainfall distribution as shown in
Figure 2e and 2f respectively. The above analyses (based on Figure 5 and 6) indicate that the August
2020 anomalous rainfall is indeed contributed by the synoptic scale LPSs.
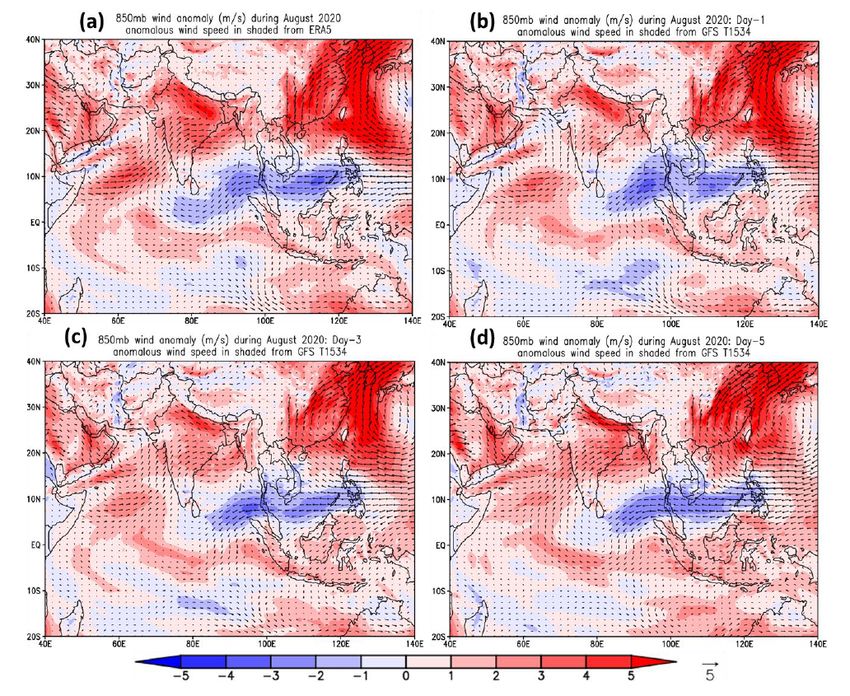
3.3 Anomalous wind circulation and evaluation of
dynamical processes
Roxy et al. (2017) and Mukhopadhyay et al. (2021) has demonstrated that the low-level (850hPa)
southwesterly jet plays a pivotal role in transporting large-scale moisture over the Indian landmass and
associated rainfall distribution during summer monsoon. Therefore, in the present section, the
anomalous low-level wind circulation is depicted in Figure 7 during August of the year of 2020. The ERA5
reanalyses based low-level wind circulation indicates presence of anomalously strong south-westerly jet
emanating from Arabian Sea towards the Indian landmass region (Figure 7a). Additionally, the jet crosses
the BoB and Indo-Gangetic plains establishing an anomalous cyclonic circulation over Gujarat and
adjacent region during August of 2020. The reanalyses based analyses further reveal that an anomalous
cyclonic circulation prevails over northern Arabian Sea (Figure 7a). The model forecast shows reasonable
large-scale low-level circulation with day-1 to day-5 lead time (Figure 7b-7c). However, the strength of the
anomalous jet is weaker than ERA5 for all the lead time during August.
In order to evaluate the dynamical and thermodynamical processes associated with the anomalously
high rainfall during August of the year 2020, the vertical profiles of various parameters are shown in
Figure 8 over CI region. The vertical velocity plays a crucial role in maintaining and sustaining convection
over a region. The ERA-5 based observation indicates strong ascending vertical motion throughout the
troposphere over CI region during August of the year of 2020 (Figure 8a). The strength of the vertical
motion during August, 2020 is more than the observed climatological profile. The GFS T1534 forecast is
able to predict the vertical velocity fairly well for day-1 to day-5 lead time over the CI region during August-
2020. However, slight overestimation of vertical velocity is evident in the middle troposphere for day-3
and day-5 lead time. During ISM, the synoptic LPSs are dominated by low-level moisture convergence and
upper-level divergence. During August, 2020, the anomalously high moisture convergence is noted upto
Page 9/31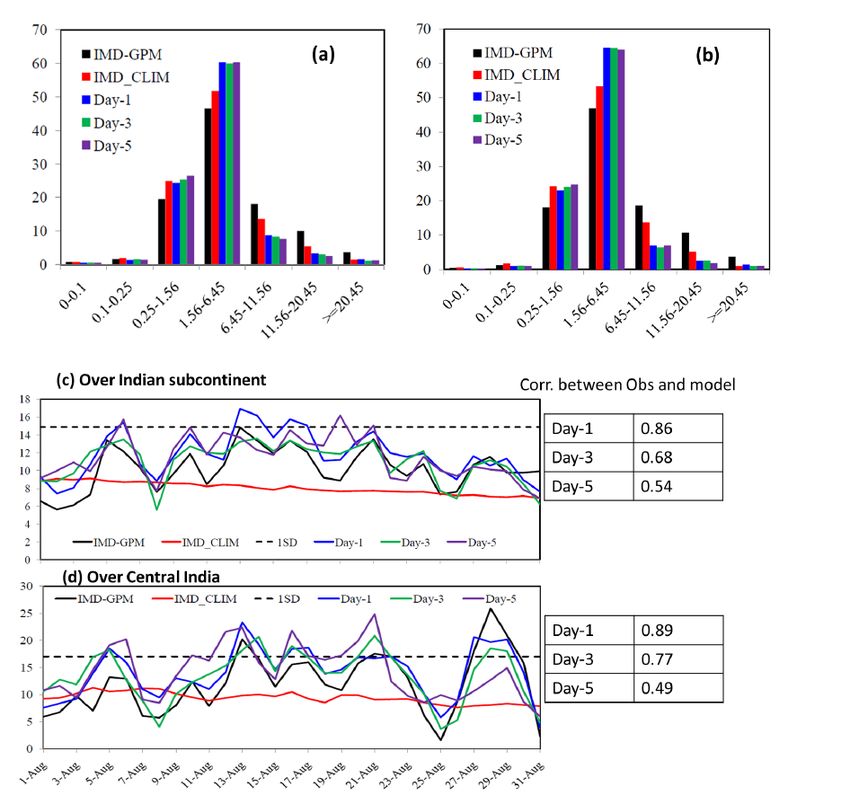
600 hPa in ERA-5 reanalyses (Figure 8b) indicating lower level moistening over the region. This is further
established from the vertical profile of divergence as shown in Figure 8c which depicts strong lower-level
convergence and upper-level divergence. The high-resolution model forecast is able to predict the
moisture convergence and divergence profile to a reasonable extent for day-1 to day-5 lead time. However,
closer analyses reveal that the model forecast appears to overestimate the near surface (within 900 hPa)
moisture convergence as shown in Figure 8b and 8c. As GFS T1534 operational model is able to predict
the large-scale circulation and vertical moisture distribution reasonably well over CI region, it is worth to
evaluate the large-scale heating distribution associated with the rainfall of August, 2020. The vertical
profile of apparent heat source (Q1) is computed following Yanai et al. (1973) and showed in Figure 8d.
Similar to anomalously strong large-scale wind circulation and moisture distribution, the ERA-5 based
heating profile indicates strong and deep convection throughout the troposphere during August, 2020.
The large-scale heating (Q1) (black line) is much stronger than the observed climatology (red line) over
the CI region. The GFS T1534 is able to predict the Q1 profile reasonably well for all the lead time (Figure
8d).

In order to further understand the precipitation and moist processes associated with the anomalously
high rainfall during August 2020, the vertical distribution of relative humidity as a function of rain rate (in
logarithmic scale) is analyzed over the CI region as depicted in Figure 9. The observed (IMD rainfall and
ERA-5 relative humidity) distribution indicate similar pattern for both August climatology (Figure 9a) and
August 2020 (Figure 9b). The relative humidity of the troposphere increases gradually with increasing
rain rate and heavier rainfall occurs when the atmosphere becomes adequately moist (Figure 9a and 9b).
Further, both the above figures indicate drier mid-troposphere and moist lower troposphere for lighter
rainfall (
August MKE climatology (Figure 10b). It is consistent with Figure 7, which shows the wind is stronger
during August 2020. Thus, it indicates that the mean state is stronger during August 2020. GFS T1534
model captures the MKE structure and magnitude reasonably well up to day-5 lead while the amplitude is
slightly under-estimated with the increased lead time. The MKE analysis suggests that the model has
good fidelity in capturing the mean state during August-2020.
Previous studies (Sarkar et al. 2017) have suggested that the stronger MKE helps to transfer the energy
efficiently to the eddy scale. To further understand that, we have shown the MKE to EKE conversion
processes at 850 hPa in Figure 11. The negative (positive) value indicates that the conversion from MKE
(EKE) to EKE (MKE). The ERA-5 based observation shows strong MKE to EKE conversion over the Indian
region (Figure 11b). The strong negative conversion suggests that the energy conversion from MKE to
EKE over the Indian region except for the western ghats. The MKE to EKE conversion is even more during
August 2020 than the observed August climatological conversion (Figure 11a). It suggests the strong
MKE to EKE conversion over the Indian region helps the synoptic scale to gain energy during August 2020
as compared to climatological conversion. GFS T1534 model has good fidelity in capturing the MKE to
EKE conversion at day-1 lead over the Indian region, but the magnitude is under-estimated with increasing
lead time.
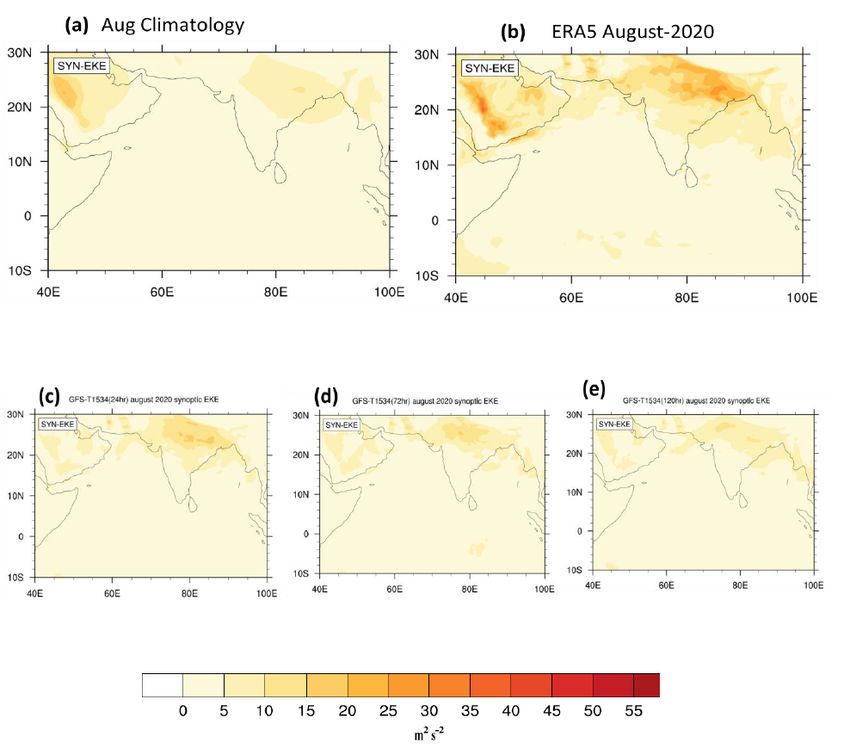
As the GFS T1534 model is able to predict the MKE to EKE conversion reasonably well over the Indian
region, it is worth evaluating the total synoptic EKE. The total synoptic EKE at 850 hPa based on ERA and
GFS T1534 model is shown in Figure 12. Climatologically, maximum synoptic EKE during the month of
August (Figure 12a) is seen towards the northeastern part of India where the LPS activity is more. During
August 2020 (Figure 12b), the synoptic EKE is more than the climatological value. GFS T1534 model has
good fidelity in capturing the synoptic EKE at day-1 lead time (Figure 12c) but the amplitude is under-
estimated in longer lead time. As we have seen a conversion from MKE to EKE, the synoptic EKE is
naturally higher, and the model has some fidelity in capturing the synoptic EKE during August 2020.
To further understand the energy conversion processes, we have shown the ISO scale kinetic energy
based on ERA5 and GFS model in Figure 13. Climatologically during the month of August, ISO scale
kinetic energy is higher over the Indian region as seen from Figure 13a. In August 2020 (Figure 13b), the
ISO scale kinetic energy was less than the climatological ISO scale kinetic energy. It implies that the ISO
scale was less active than the synoptic-scale and it is consistent with the fact that the ISO scale variance
is less than the synoptic-scale variance (Figure 5). It is also found that the ISO scale kinetic energy was
more over the Arabian sea and Bay of Bengal region during August 2020 as compared to the August
climatological value (Figure 13b). GFS T1534 model is able to capture the structure of the ISO scale
kinetic energy reasonably well up in day-1 forecast but the magnitude is slightly underestimated with
increased lead time. Thus, the ISO scale kinetic energy was less during August 2020 while the synoptic-
scale kinetic energy was more and the model has good fidelity in capturing the ISO scale kinetic energy
and synoptic-scale kinetic energy but the magnitude is slightly underestimated with increased lead time.
Page 11/31The question that may be asked is from which source the MKE is gaining energy as the conversion of
MKE to EKE (Figure 11) may decrease MKE. But, Figure 10 shows that the MKE is also high during August
2020 as compared to climatological August MKE. To find the answer to this question, the MAPE to MKE
conversion is diagnosed. It is found that the MAPE to MKE conversion over central India is generally less
during the month of August (Figure 14a), but during August 2020, the above conversion is found to be
more (Figure 14b) than the climatological conversion. MAPE to MKE conversion is generally positive in
the region of convective heating. The increased MAPE to MKE conversion helps to maintain the MKE and
as a result of that, the MKE is stronger during August 2020 (Figure 10b). GFS T1534 model overestimates
the MAPE to MKE conversion during Day-1 lead (Figure 14c) but the overestimation decreases with
increased lead time.
4 Summary And Conclusions
In the present manuscript, an attempt is made to investigate the mechanism behind the anomalously
high rainfall activity during August 2020 over Indian subcontinent region and the performance of the
present operational short range weather forecast model (GFS T1534) in predicting the above rainfall
distribution. As per the IMD, the country receives 27% above normal rainfall in the month of August 2020.
It is found that the anomalous high rainfall is mainly contributed by the 5 low pressure systems formed
over North BoB and moved west-northwestwards across CI up to Western Madhya Pradesh/Rajasthan
during August. The observed anomalous high rainfall during August of the year 2020 is distributed over
CI region extending from coastal Orissa to central part of Chhattisgarh, Madhya Pradesh and western
coast of Gujarat. The operational GFS T1534 is able to forecast the anomalous high rainfall distribution
reasonably with day-1 lead time. However, the rainfall distribution shifted northward with day-3 and day-5
lead time. The analyses further reveals that the observed heavy August rainfall is mainly contributed by
the synoptic component whereas the contribution of the large-scale ISO is quite less. This is consistent
with the fact that the anomalous high rainfall over CI region is due to the synoptic LPSs as discussed
above. The GFS T1534 forecast showed indication of the enhanced synoptic activity but it considerably
underestimates the magnitude of the synoptic variance.
The abundant August-2020 rainfall is also supported by the large-scale dynamical and thermodynamical
processes. The low-level (850 hPa) wind circulation indicates anomalously strong south-westerly jet
emanating from Arabian Sea towards Indian landmass region and finally establishing a cyclonic
circulation over Gujarat and adjacent region. The operational model (GFS T1534) is able to predict the
enhanced low-level circulation up to day-5 lead time. However, the model underestimates the magnitude
of the low-level jet for day-1 to day-5 lead time. The dynamical and thermodynamical parameters further
indicate anomalously strong vertical motion resulted from lower and middle level moisture convergence
leading to enhanced moisture detrainment from the upper troposphere which might have led to increased
large-scale heating distribution over the CI region during August. The convective-moisture relationship
further suggests anomalously high moisture in the lower to mid troposphere for the moderate to high
category rainfall and this abundant moisture associated with the LPSs brings out anomalously high
rainfall during August 2020.
Page 12/31From the energetics analysis, it is found that the MKE is higher during August 2020 as compared to the
climatological MKE during the month of August. As the MKE is higher, it transfers energy efficiently to the
synoptic scale. The MKE to EKE conversion is more during August 2020 as compared to its climatological
conversion during the month of August, and it helps the synoptic scale to gain energy. Along with that, the
ISO scale kinetic energy over the central India region was less than the climatological value. The
increased ISO scale kinetic energy is seen over the Arabian Sea and Bay of Bengal region during August
2020. GFS model has some fidelity in capturing the ISO scale and synoptic-scale kinetic energy but the
amplitude is under-estimated with the increased lead time. MKE to EKE conversion is generally positive in
the region of convective heating, and the MAPE to MKE conversion helps to maintain the high MKE during
August. The MAPE to MKE conversion during August 2020 is more than the climatological August
conversion. Thus, the above analyses suggest that the MAPE to MKE helps to maintain the stronger MKE
and the strong MKE efficiently transfers the energy to the synoptic scale, and hence the synoptic EKE is
higher. Along with that, the ISO scale kinetic energy is less compared to the climatological value. GFS
T1534 model has some fidelity in capturing the energy conversion processes, but the model has some
difficulty in capturing the magnitude with increased lead time.
The present manuscript clearly brings out the major systematic biases in the present GFST1534 model
namely the underestimation of moderate to heavier category rainfall and overestimation of lighter
category rainfall. Additionally, the model considerably underestimates the observed synoptic variability
and it also fails to predict proper convective-moisture relationship in the atmosphere. Therefore, further
attempts are needed to resolve the existing model biases through impoving model physical processes
and it will be carried out in future study.
Declarations
Acknowledgement
The Indian Institute of Tropical Meteorology (Pune, India) is fully funded by the Ministry of Earth
Sciences, Government of India, NewDelhi. We would like to thank ECMWF for providing ERA5 data set
(https://www.ecmwf.int/en/forecasts/datasets/reanalysis-datasets/era5). We ackonwledge IMD for
providing the IMD-GPM merged data. GFS T1534 model runs are carried out on Pratyush High
Performance Computing (HPC) system at Indian Institute of Tropical Meteorology (IITM), Pune, India.
Authors thank Director, IITM, Pune for motivation and encouragement in the study.
References
1. Abhik S, Krishna RPM, Mahakur M, Ganai M, Mukhopadhyay P, Dudhia J (2017) Revised cloud
processes to improve the mean and intraseasonal variability of Indian summer monsoon in climate
forecast system: Part 1. J Adv Model Earth Syst 9:1002–1029.
https://doi.org/10.1002/2016MS000819
Page 13/312. Abhik S, Mukhopadhyay P, Goswami BN (2015) Evaluation of mean and intraseasonal variability of
Indian summer monsoon simulation in ECHAM5: Identification of possible source of bias. Clim Dyn
43(1–2):389–406. https://doi.org/10.1007/s00382‐013‐1824‐7
3. Ajayamohan RS, Merryfield WJ, Kharin VV (2010) Increasing trend of synoptic activity and its
relationship with extreme rain events over central india. J Clim 23(4):1004–1013
4. Arakawa A, Wu C-M (2013) A unified representation of deep moist convection in numerical modeling
of the atmosphere. Part I. J Atmos Sci 70:1977–1992. https://doi.org/10.1175/JAS-D-12-0330.1
5. Ashok K, Guan Z, Yamagata T (2001) Impact of Indian Ocean Dipole on the relationship between the
Indian monsoon rainfall and ENSO. Geophys Res Lett 28:4499–4502
6. Behera SK, Krishnan R, Yamagata T (1999) Unusual Ocean-atmosphere conditions in the tropical
Indian Ocean during 1994. Geophys Res Lett 26:3001–3004
7. Bush SJ, Turner AG, Woolnough SJ, Martin GM, Klingaman NP (2015) The effect of increased
convective entrainment on Asian monsoon biases in the MetUM general circulation model. Q J R
Meteorol Soc 141(686):311–326
8. Clough SA, Shephard MW, Mlawer EJ, Delamere JS, Iacono MJ, Cady-Pereira K et al (2005)
Atmospheric radiative transfer modeling: a summary of the AER codes. J Quant Spectrosc Radiat
Trans 91(2):233–244. https://doi.org/10.1016/j.jqsrt.2004.05.058
9. Dash SK, Kumar JR, Shekhar MS (2004) On the decreasing frequency of monsoon depressions over
the Indian region. Curr Sci Bangalore 86(10):1404–1410
10. Dhar O, Nandargi S (1995) On some characteristics of severe rainstorms of India. Theor Appl
Climatol 50(3–4):205–212
11. Duchon CE (1979) Lanczos filtering in one and two dimensions. J Appl Meteor 18:1016–1022.
https://doi.org/10.1175/1520-0450(1979)018,1016:LFIOAT.2.0.CO;2
12. Gadgil S, Vinayachandran PN, Francis PA (2003) Droughts of Indian summer monsoon: Role of
clouds over Indian Ocean. Curr Sci 85:1713–1719
13. Gadgil S, Vinayachandran PN, Francis PA, Gadgil S (2004) Extremes of the Indian summer monsoon
rainfall, ENSO and Equatorial Indian Ocean Oscillation. Geophys Res Lett. doi:
10.1029/2004GL019733
14. Ganai M, Krishna RPM, Mukhopadhyay P, Mahakur M (2016) The impact of revised simplified
Arakawa-Schubert scheme on the simulation of mean and diurnal variability associated with active
and break phases of Indian Summer Monsoon using CFSv2. J Geophys Res Atmos 121:9301–9323.
https://doi.org/10.1002/2016JD025393
15. Ganai M, Krishna RPM, Tirkey Snehlata, Mukhopadhyay P, Mahakur M, Han J-Y (2019) The impact of
modified fractional cloud condensate to precipitation conversion parameter in revised simplified
Arakawa-Schubert convection parameterization scheme on the simulation of Indian summer
monsoon and its forecast application on an extreme rainfall event over Mumbai. J Geophys Res
Atmos 124:5379–5399. https://doi.org/10.1029/2019JD030278
Page 14/3116. Ganai M, Tirkey S, Krishna RPM, Mukhopadhyay P (2021) The impact of modified rate of
precipitation conversion parameter in the convective parameterization scheme of operational
weather forecast model (GFS T1534) over Indian summer monsoon region. Atmos Res 248:105185.
https://doi.org/10.1016/j.atmosres.2020.105185
17. Godbole RV (1977) The composite structure of the monsoon depression.Tellus 29. 25–40.
https://doi.org/10.3402/tellusa.v29i1.11327. 1
18. Goswami BB, Deshpande MS, Mukhopadhyay P, Saha SK, Rao SA, Murthugudde R, Goswami BN
(2014) Simulation of monsoon intraseasonal variability in NCEP CFSv2 and its role on systematic
bias. Clim Dyn 43(9–10):2725–2745. https://doi.org/10.1007/s00382‐014‐2089‐5
19. Goswami BN (2005) South Asian summer monsoon. In: Lau WK-M, Waliser DE (eds) Intraseasonal
Variability of the Atmosphere Ocean Climate System. Springer, Berlin, pp 19–61.
https://doi.org/10.1007/3‐540‐27250‐X_2
20. Goswami BN, Ajayamohan RS (2001) Intraseasonal oscillation and interannual variability of the
Indian summer monsoon. Journal of Climate 14(6): 1180–1198. https://doi.org/10.1175/1520‐
0442(2001)0142.0.CO;2
21. Goswami BN, Venugopal V, Sengupta D, Madhusoodanan MS, Xavier PK (2006) Increasing trend of
extreme rain events over India in a warming environment. Science 314(5804):1442–1445.
https://doi.org/10.1126/science.1132027
22. Han J, Pan H-L (2011) Revision of convection and vertical diffusion schemes in the NCEP global
forecast system. Weather Forecast 26(4):520–533. https://doi.org/10.1175/WAF-D-10-05038.1
23. Han J, Wang W, Kwon YC, Hong S-Y, Tallapragada V, Yang F (2017) Updates in the NCEP GFS
cumulus convection schemes with scale and aerosol awareness. Weather Forecast 32(5):2005–
2017. https://doi.org/10.1175/WAF-D-17-0046.1
24. Hersbach H, Dee D (2016) ERA5 reanalysis is in production. In: ECMWF Newsletter No. 147, pp. 7
25. Hsu P-C, Yang Y (2015) Contribution of atmospheric internal processes to the interannual variability
of the South Asian summer monsoon. Int J Climatol 36:2927–2930. doi: 10.1002/joc.4528
26. Iacono MJ, Mlawer EJ, Clough SA, Morcrette J-J (2000) Impact of an improved longwave radiation
model, RRTM, on the energy budget and thermodynamic properties of the NCAR Community Climate
Model CCM3. J Geophys Res 105(D11):14873–14890. https://doi.org/10.1029/2000JD900091
27. JOHNY CJ, PRASAD VS (2020) Application of hind cast in identifying extreme events over India. J
Earth Syst Sci 129:163. https://doi.org/10.1007/s12040-020-01435-8
28. Klingaman NP, Woolnough SJ (2014) Using a case-study approach to improve the Madden–Julian
oscillation in the Hadley Centre model. Q J R Meteorol Soc 140:2491–2505.
https://doi.org/10.1002/qj.2314
29. Kripalani RH, Kulkarni A, Sabade SS, Revadekar JV, Patwardhan SK, Kulkarni JR (2004) Intra-
seasonal oscillations during monsoon 2002 and 2003. Curr Sci 87:327–331
30. Krishnamurthy V, Ajayamohan RS (2010) Composite structure of monsoon low pressure systems
and its relation to Indian rainfall. J Clim 23(16):4285–4305.
Page 15/31https://doi.org/10.1175/2010JCLI2953.1
31. Krishnamurti TN, Martin A, Krishnamurti R et al (2013) Impacts of enhanced CCN on the organization
of convection and recent reduced counts of monsoon depressions. Clim Dyn 41:117–134. doi:
10.1007/s00382-012-1638-z
32. Kumar TSVV, Krishnamurti TN (2006) High resolution numerical weather prediction over the Indian
subcontinent. J Earth Syst Sci 115(5):529–555
33. Lau K-H, Lau N-C (1992) The Energetics and Propagation Dynamics of Tropical Summertime
Synoptic-Scale Disturbances. Mon Weather Rev 120:2523–2539
34. Lorenz EN (1965) Energetics of atmospheric circulation.Int. Dict. Geophys.1–9
35. Mass CF, Ovens D, Westrick K, Colle BA (2002) Does increasing horizontal resolution produce more
skillful forecasts? Bull Am Meteorol Soc 83:407–430
36. Mitra AK, Bohra AK, Rajeevan MN, Krishnamurti TN (2009) Daily Indian precipitation analysis formed
from a merge of rain-gauge data with the TRMM TMPA satellite-derived rainfall estimates. J
Meteorol Soc Japan Ser II 87:265–279
37. Mukhopadhyay P et al (2019) Performance of a very high-resolution global forecast system model
(GFS T1534) at 12.5 km over the Indian region during the 2016–2017 monsoon seasons. J Earth
Syst Sci 128:1–18. https://doi.org/10.1007/s12040-019-1186-6
38. Mukhopadhyay P et al. (2021) Unraveling the Mechanism of Extreme (More than 30 Sigma)
Precipitation during August 2018 and 2019 over Kerala, India. Weather and Forecasting 36: 1253-
1273. https://doi.org/10.1175/WAF-D-20-0162.1
39. OORT AH (1964) ON ESTIMATES OF THE ATMOSPHERIC ENERGY CYCLE. Mon Weather Rev
92:483–493. doi: 10.1175/1520-0493(1964)0922.3.CO;2
40. Pai DS, Sridhar L, Rajeevan M, Sreejith OP, Satbhai NS, Mukhopadhyay B (2014) Development of a
new high spatial resolution(0.25° × 0.25°) long period (1901-2010) daily gridded rainfall data set over
the region. Mausam 65:1–18
41. Pan HL, Wu WS (1995) Implementing a mass flux convective parameterization package for the NMC
medium-range forecast model. In:NMC Office Note. 409, (40 pp.).
42. Prasad VS, Johny CJ, Sodhi JS (2016) Impact of 3D Var GSI-ENKF hybrid data assimilation system.
J Earth Syst Sci 125(8):1509–1521
43. Rajeevan M, Bhate J, Jaswal AK (2008) Analysis of variability and trends of extreme rainfall events
over India using 104 years of gridded daily rainfall data. Geophys Res Lett 35:L18707.
https://doi.org/10.1029/2008GL035143
44. Roxy MK, Ghosh S, Pathak A, Athulya R, Mujumdar M, Murtugudde R et al (2017) A threefold rise in
widespread extreme rain events over Central India. Nat Commun 8(1):708.
https://doi.org/10.1038/s41467-017-00744-9
45. Saha SK, Pokhrel S, Chaudhari HS, Dhakate A, Shewale S, Sabeerali CT et al (2013) Improved
simulation of Indian summer monsoon in latest NCEP climate forecast system free run. Int J Clim
Page 16/3134(5):1628–1641. https://doi.org/10.1002/joc.3791
46. Saji NH, Goswami BN, Vinayachandran PN, Yamagata T (1999) A dipole mode in the tropical Indian
ocean. Nature 401:360–363
47. Sarkar S, Mukhopadhyay P, Dutta S (2017) Atmospheric dynamics and internal processes during
organization and intensification of Boreal Summer Intraseasonal Oscillation (BSISO) based on
TRMM and reanalyses data. Int J Climatol. doi: 10.1002/joc.5017
48. Sarkar S, Mukhopadhyay P, Phani Murali Krishna R, Dutta S (2018) Coupled model fidelity in
capturing atmospheric internal processes during organization and intensification of boreal summer
intra-seasonal oscillation. Int J Climatol 38:5339–5353. doi: 10.1002/joc.5736
49. Sarkar S, Mukhopadhyay P, Dutta S et al (2021) GFS model fidelity in capturing the transition of
lowpressure area to monsoon depression. Q J R Meteorol Soc 147(738):2625–2637. doi:
10.1002/qj.4024
50. Sarkar S, Mukhopadhyay P, Dutta S (2021) Energy conversion processes associated with the
transition of low-pressure area to monsoon depression during Indian summer monsoon: a study to
evaluate GFS model fidelity. Meteorol Atmos Phys 134, 1 (2022). https://doi.org/10.1007/s00703-
021-00838-6
51. Sela J (2010) The derivation of sigma pressure hybrid coordinate semi-Lagrangian model equations
for the GFS. In:NCEP Office Note462, (31 pp.).
52. Sharma K, Ashrit R, Ebert E, Mitra A, Bhatla R, Iyengar G, Rajagopal EN (2019) Assessment of met
Office unified model (UM) quantitative precipitation forecasts during the Indian summer monsoon:
contiguous rain area (CRA) approach. Journal of Earth System Science 128(4): 1–17.
https://doi.org/10.1007/s12040-018-1023-3.
53. Wu R, Kirtman BP (2004) Impacts of the Indian Ocean on the Indian summer monsoon–ENSO
relationship. J Clim 17:3037–3054. https://doi.org/10.1175/1520-
0442(2004)0172.0.CO;2
54. Yanai M, Esbensen S, Chu J-H (1973) Determination of bulk properties of tropical cloud clusters from
large‐scale heat and moisture budgets. Journal of the Atmospheric Sciences 30: 611–627.
https://doi.org/10.1175/15200469(1973)0302.0.CO;2
55. Zhao Q, Carr FH (1997) A prognostic cloud scheme for operational NWP models. Mon. Weather Rev.
125 (8): 1931–1953. https://doi.org/10.1175/1520-0493(1997)1252.0.CO;2.
Figures
Page 17/31Figure 1
Tracks of low pressure systems (LPS) during August of 2020 from observation and GFS T1534 for day-1
lead time.
Page 18/31Figure 2
Observed August rainfall (mmday-1) (a) climatology based on 1961-2019 IMD data, (b) mean rainfall of
the year 2020, (c) rainfall anomaly of the year 2020. (d-f) represent GFST1534 model forecasted rainfall
anomaly (mmday-1) for day-1, day-3 and day-5 lead time respectively.
Page 19/31Figure 3
(a) All India rainfall PDF (%) vs. rain rate (cmday-1) categories during August 2020 from IMD-GPM, IMD
climatology and GFS T1534 model forecast for day-1, day-3 and day-5 lead time. (b) same as figure (a)
but over Central India region. (c) and (d) indicate time series of rainfall (mmday-1) during August 2020
over Indian subcontinent and over Central Indian region respectively. Dashed line in (c) and (d) represent
one standard deviation line.
Page 20/31Figure 4
Latitude vs. time diagram of rainfall (mmday-1) during August of the year 2020 averaged over 70οE-90οE
from (a) Observation, GFS T1534 model forecast for (b) day-1, (c) day-3 and (d) day-5 lead time. LPS-1 to
LPS-5 is indicated as per ascending order of days in August as in Figure 1.
Page 21/31Figure 5
(a) Synoptic (2-10 day mode) rainfall (mm2day-2) variance during August 2020 from Observation and
GFS T1534 with day-1, day-3 and day-5 lead time. (b) as in a but for ISO (10-90 day mode) rainfall
variance.
Page 22/31Figure 6 Spatial-filtered rainfall (mmday-1) distribution during August 2020: (first row) mean rainfall, (middle row) rainfall from the synoptic scale (>200 km), and (bottom row) rainfall from the smaller scale (
Figure 7

Anomalous low-level (850hPa) wind (vector; ms-1) and speed (shaded; ms-1) during August of the year
2020 from (a) ERA5 reanalyses and GFS T1534 model forecast with (b) day-1, (c) day-3 and (d) day-5
lead time.

                                              Page 24/31
Figure 8
Vertical profile of (a) vertical velocity (hPas-1), (b) moisture convergence (gm/kgs-1), (c) divergence (s-1)
and (d) apparent heat source (Q1) (Kday-1) for ERA5 reanalyses (black line), ERA5 climatology (red line)
and GFS T1534 model forecast for day-1 (blue line), day-3 (green line) and day-5 (purple line) lead time
over central India region during August of the year 2020.
Page 25/31Figure 9
Vertical profile of relative humidity (shaded in %, along the y-axis) as a function of rain rate (mmday-1 in
log10 scale along the x-axis) form observation (ERA5 vs. IMD-GPM merged data) based (a) August
climatology and (b) August 2020. (c-e) represent model forecasted bias during August 2020 for (c) day-1,
(d) day-3 and (e) day-5 lead time over Central Indian landmass region.
Page 26/31Figure 10
Mean kinetic energy at 850hPa based on (a) August Climatology (b) August 2020 from ERA5 reanalyses.
(c-d) represent GFS T1534 model forecast during August 2020 with (c) day-1, (d) day-3 and (e) day-5 lead
time.
Page 27/31Figure 11
Mean kinetic energy to eddy kinetic energy conversion at 850 hPa level based on (a) August Climatology
(b) August 2020 from ERA5 reanalyses. (c-d) represent GFS T1534 model forecast during August 2020
with (c) day-1, (d) day-3 and (e) day-5 lead time.
Page 28/31Figure 12
Synoptic scale eddy kinetic energy conversion at 850 hPa level based on (a) August Climatology (b)
August 2020 from ERA5 reanalyses. (c-d) represent GFS T1534 model forecast during August 2020 with
(c) day-1, (d) day-3 and (e) day-5 lead time.
Page 29/31Figure 13
ISO scale kinetic energy conversion at 850 hPa level based on (a) August Climatology (b) August 2020
from ERA5 reanalyses. (c-d) represent GFS T1534 model forecast during August 2020 with (c) day-1, (d)
day-3 and (e) day-5 lead time.
Page 30/31Figure 14
Mean available potential energy to mean kinetic energy conversion at 850 hPa level based on (a) August
Climatology (b) August 2020 from ERA5 reanalyses. (c-d) represent GFS T1534 model forecast during
August 2020 with (c) day-1, (d) day-3 and (e) day-5 lead time.
Page 31/31You can also read