PORT HEDLAND SOLAR FARM - Reflective Glare Assessment Prepared for: ALINTA Energy Development Pty Ltd Level 18, Raine Square 300 Murray Street ...
←
→
Page content transcription
If your browser does not render page correctly, please read the page content below
PORT HEDLAND SOLAR FARM
                                    Reflective Glare Assessment

                                                      Prepared for:
                                 ALINTA Energy Development Pty Ltd
                                             Level 18, Raine Square
                                                 300 Murray Street
                                                  PERTH WA 6000

SLR Ref: 610.30511-R01
Version No: -v2.1
January 2022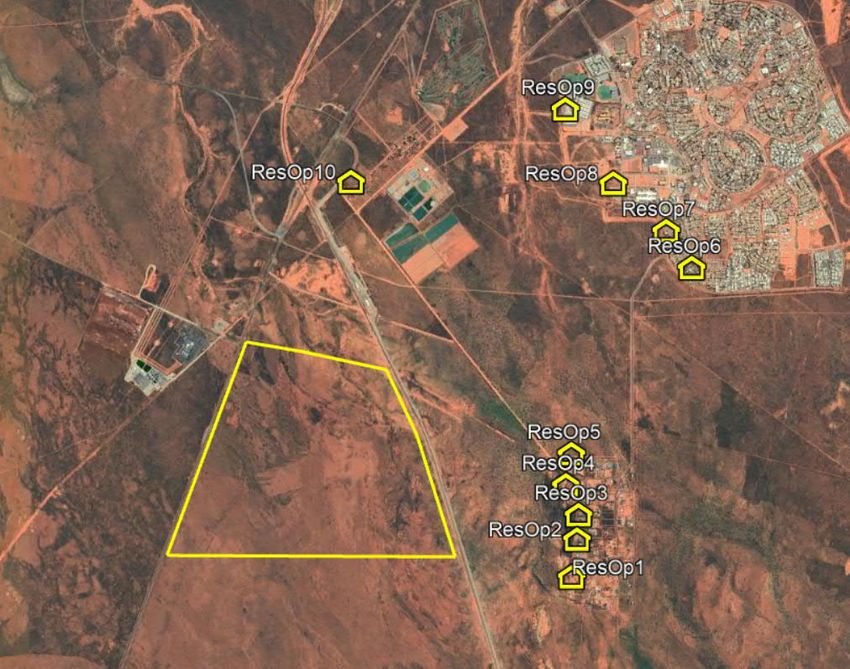
ALINTA Energy Development Pty Ltd                                                   SLR Ref No: 610.30511-R01-v2.1 REFLECTIVE GLARE.docx
Port Hedland Solar Farm                                                                                                     January 2022
Reflective Glare Assessment

PREPARED BY
                                              SLR Consulting Australia Pty Ltd
                                              ABN 29 001 584 612
                                              Tenancy 202 Submarine School, Sub Base Platypus, 120 High Street
                                              North Sydney NSW 2060 Australia

                                              T: +61 2 9427 8100
                                              E: sydney@slrconsulting.com www.slrconsulting.com

BASIS OF REPORT
                                              This report has been prepared by SLR Consulting Australia Pty Ltd with all reasonable skill,
                                              care and diligence, and taking account of the timescale and resources allocated to it by
                                              agreement with ALINTA Energy Development Pty Ltd (the Client). Information reported
                                              herein is based on the interpretation of data collected, which has been accepted in good
                                              faith as being accurate and valid.

                                              This report is for the exclusive use of the Client. No warranties or guarantees are
                                              expressed or should be inferred by any third parties. This report may not be relied upon
                                              by other parties without written consent from SLR

                                              SLR disclaims any responsibility to the Client and others in respect of any matters outside
                                              the agreed scope of the work.

DOCUMENT CONTROL
 Reference                  Date                       Prepared                    Checked                     Authorised
 610.30511-R01-v2.1         25 January 2022            Peter Hayman                Dr Peter Georgiou           Dr Neihad Al-Khalidy
 610.30511-R01-v2.0         16 December 2021           Peter Hayman                Dr Peter Georgiou           Dr Neihad Al-Khalidy
 610.30511-R01-v1.0         8 November 2021            Peter Hayman                Dr Peter Georgiou           Dr Neihad Al-Khalidy

                                                                 Page 2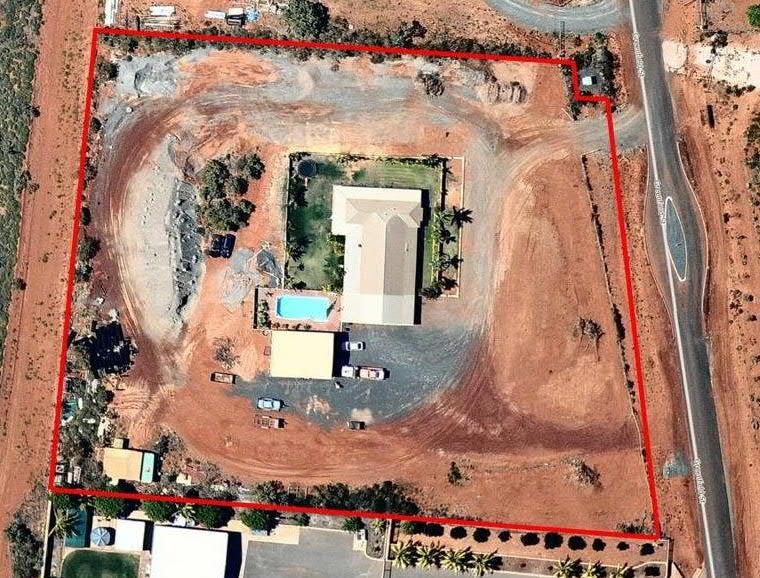
ALINTA Energy Development Pty Ltd                                          SLR Ref No: 610.30511-R01-v2.1 REFLECTIVE GLARE.docx
 Port Hedland Solar Farm                                                                                            January 2022
 Reflective Glare Assessment

EXECUTIVE SUMMARY

SLR Consulting Australia Pty Ltd (SLR) has been engaged by Alinta Energy Development Pty Ltd (Alinta) to carry
out a Reflective Glare assessment of the proposed 90 MWac Port Hedland Solar Farm (the “Project”). The
Project is located on Unallocated Crown Land near the existing Port Hedland Power Station (PHPS), comprising:
     ·   Three 30 MWac blocks configured as a single facility, with approximately 220,000 solar panels on a fixed
         tilt support system - refer Figure 1.

The Project NE corner is located approximately 8 km from Port Hedland International Airport (PHIA) Runway
14/32, just over 4 km from the township centre of South Hedland and 1.5 km from the nearest residences at
Boodarie to the east – refer Figure 8.

The report has modelled a more extensive “maximal theoretical” project in terms of potential site footprint than
the final design that will be constructed and has hence adopted a conservative approach to glare prediction.
Section 3.5 details the significant difference between the “maximal theoretical” footprint modelled in this study
and likely final design footprint – refer Figure 7.

The following potential glare conditions have been considered:
     ·   Daytime           Reflective glare (and glint) arising from the solar PV panels within the facility:
                           . Aviation Sector Reflective Glare;
                           . Motorist “Disability” Reflective Glare;
                           . Rail Operator “Disability” Reflective Glare;
                           . Industrial Machinery Operator “Disability” Reflective Glare; and
                           . Residential “Nuisance” Glare
     ·   Night-time        Illumination glare for 24/7 operational security lighting within the Project.

Aviation-Related Potential Glare

     Quantitative analysis was made using the FAA-SGHAT (Solar Glare Hazard Analysis Tool) software tool –
     refer Section 4.2 for details of the tool. The analysis has shown that there will be nil glare from the Project
     at Port Hedland International Airport (all runways) under ANY Fixed Tilt panel support mode ranging from
     5° to 25° with the panels “facing” due north. The proposed solar farm will also comply with SGHAT
     requirements in a Fixed Tilt panel mode of around 15° if the perpendicular “pointing” axis of the panels
     (ie the direction they are facing) is allowed to vary from due north by ±10°.

     The above result is due to the distance of the proposed solar farm from PHIA and the difference in line of
     sight of pilots on final approach for the airport’s runways.

     Recommendation: NIL

                                                            Page 3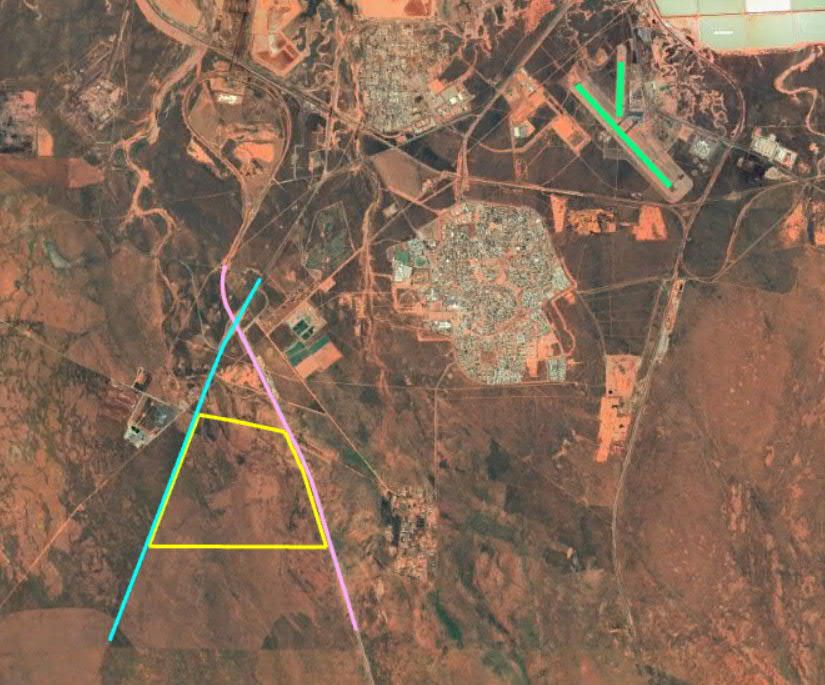
ALINTA Energy Development Pty Ltd                                      SLR Ref No: 610.30511-R01-v2.1 REFLECTIVE GLARE.docx
 Port Hedland Solar Farm                                                                                        January 2022
 Reflective Glare Assessment

EXECUTIVE SUMMARY
Motorist and Rail Traffic “Disability” Glare

     Quantitative analysis was made using the SLR’s TI (Threshold Increment) Value Calculation tool - refer
     Section 5.2 for definition of the TI Value. The proposed solar farm will comply with the recommended TI
     Value criteria for both road and rail under ANY Fixed Tilt panel mode with an upwards tilt of at least 10°.

     For a typical FIXED TILT position (say in the range 15°-20°), allowing the array to have a slight eastwards
     orientation (eg facing 10° east) increases the potential visibility of reflections to the adjacent FMG East
     Turner Rail Line, but still within the recommended TI Value criteria. Allowing the array to have a slight
     westwards orientation (eg facing 350° west) increases the potential visibility of reflections to Boodarie
     Station Access Road traffic, again still within the recommended TI Value criteria.

     Recommendation: While not a glare issue per se, in order to minimise the visibility of reflections from the
                     proposed facility, it is recommended that the orientation of the panels be aligned as
                     close to North as possible, regardless of the FIXED TILT angles of the panels.

Residential Nuisance Glare

     The TI Value calculations assessing residential nuisance glare were based on a receiver looking directly
     towards the proposed facility. The calculations conservatively assumed NO intervening “blocking”
     topography (eg from small, elevated earth mounding) and NO vegetation or any other physical barriers,
     such as perimeter fencing, etc.

     These “idealised” calculations showed that there is potential for the visibility of reflections from the facility
     at some surrounding receivers – receivers #3, #4 & #5 for Boodarie and receivers, #6, #7 & #8 for South
     Hedland.

     However, when taking into account (i) the low level of potential TI Values made with the above “idealised”
     calculations, (ii) the landscaping and fencing around all residences of interest, and (iii) the intervening areas
     of elevated mounding between the proposed facility and receivers of interest, it was concluded that there
     will be NIL residential glare from the proposed facility.

     Recommendation: NIL

Industrial Machinery Disability Glare

     There are currently no industrial operations in the immediate vicinity of the Project (eg mining operations,
     quarrying, etc) with the kind of machinery where the relevant operators have the potential to experience
     reflective glare from the Project, eg elevated cabins in draglines, etc.

     Boodarie Strategic Industrial Area (SIA) is located to the west of the site – refer Figure 16. The proposed
     solar farm falls within the SIA buffer zone. SIA is being managed by the NT’s JTSI (Department of Jobs,
     Tourism, Science and Innovation). No current operations within SIA or currently planned operations (as far
     as is known) involve elevated (industrial machinery) receivers.

                                                        Page 4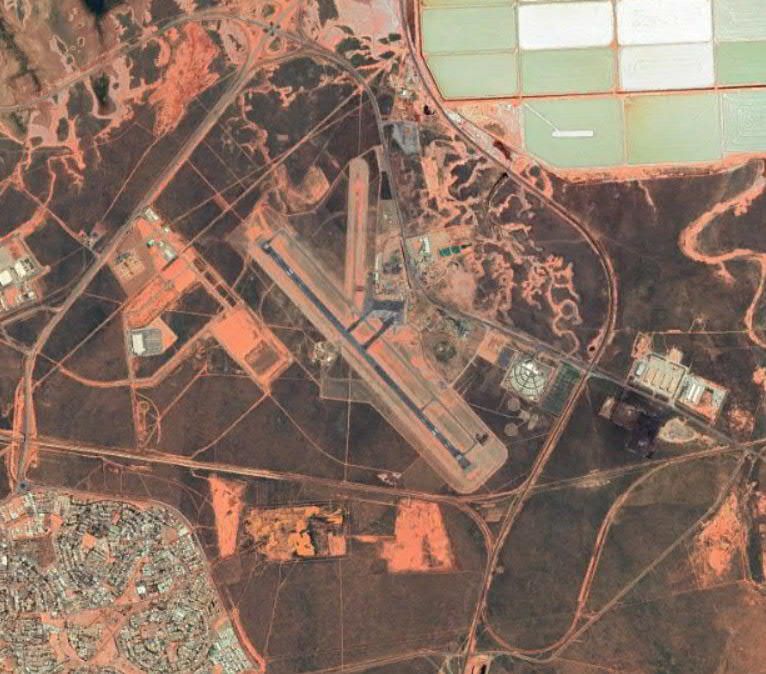
ALINTA Energy Development Pty Ltd                                         SLR Ref No: 610.30511-R01-v2.1 REFLECTIVE GLARE.docx
 Port Hedland Solar Farm                                                                                           January 2022
 Reflective Glare Assessment

EXECUTIVE SUMMARY
     Recommendation: In terms of future Boodarie SIA developments, the orientation of the panels should be
                     aligned as close to North as possible, regardless of the FIXED TILT angles of the panels.
                     Moreover, the present analysis could be revisited to confirm the absence of solar farm
                     glare, IF it understood that such development will involve elevated machinery
                     operators with a clear line of sight to the solar farm.
                               Finally, it is noted that, any future potential issue associated with solar farm glare in
                               relation to Boodarie SIA, could be straightforwardly addressed by adding a perimeter
                               screen along the western boundary of the proposed solar farm, eg vegetation, fencing,
                               etc, of sufficient height to block westbound reflections from the facility.

Night-Time Illumination Glare
     Consideration has been given to the future potential for night-time lighting at the Project site related to
     equipment and/or buildings, fire access routes and egress, personnel safety, etc.

     Recommendation: If 24/7 lighting is required in the future at the site for operational purposes, there
                     should be negligible impact, assuming the lighting design is in accordance with
                     AS 4282-2019 Control of the Obtrusive Effect of Outdoor Lighting. This would also
                     address any potential adverse eco-lighting issues in relation to nocturnal fauna within
                     and surrounding the site.

Recommendation for Detailed Design Stage

     When key Project decisions are finalised during detailed design (eg final panel selection, mounting details,
     etc), the present analysis should be re-visited to confirm the conclusions set out above, IF key assumptions
     made in the present analysis change significantly.

Finally, as noted above, the present study has assessed the potential impact of a far more extensive project than
is likely to be constructed – refer Section 3.5. The final design will be a much-reduced subset of the “maximal
theoretical” footprint design modelled herein.

                                                            Page 5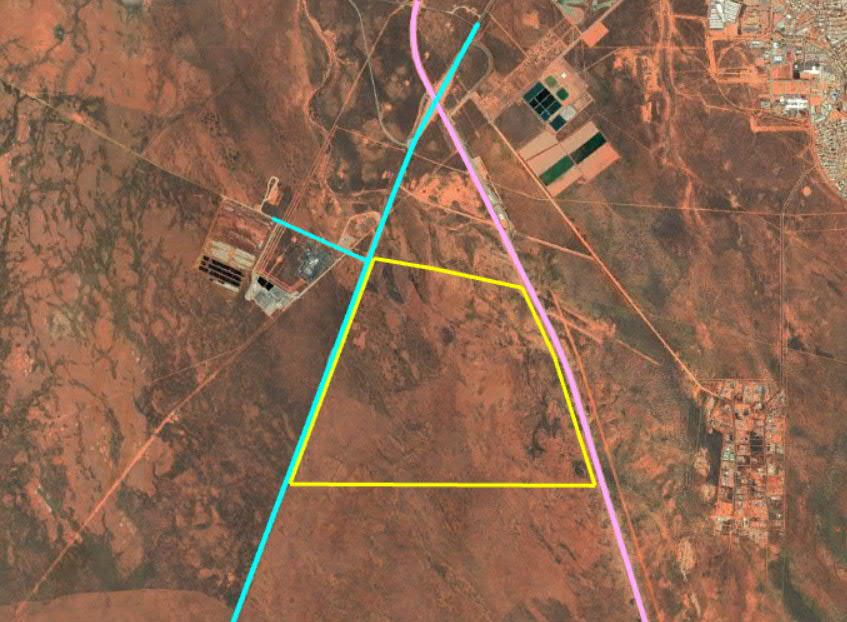
ALINTA Energy Development Pty Ltd                                                             SLR Ref No: 610.30511-R01-v2.1 REFLECTIVE GLARE.docx
Port Hedland Solar Farm                                                                                                               January 2022
Reflective Glare Assessment

      CONTENTS

      1             INTRODUCTION ........................................................................................................... 9
      1.1           Structure of Report ...................................................................................................... 9

      2             PROPOSED PORT HEDLAND SOLAR FARM PROJECT .................................................. 10
      2.1           Site Location .............................................................................................................. 10
      2.2           Site Description and Key Project Components ............................................................ 11

      3             GLARE IMPACT ASSESSMENT - INPUTS ...................................................................... 13
      3.1           Project Site Solar Angles – Annual Variations.............................................................. 13
      3.2           Project Solar Reflections ............................................................................................ 13
      3.3           Solar Panel Reflectivity............................................................................................... 15
      3.4           Modelling Real-World Tracking Axis Operational Modes ............................................ 16
      3.5           Project Ultimate Footprint ......................................................................................... 17

      4             GLARE IMPACT – AVIATION GLARE............................................................................ 19
      4.1           Nearest Aerodrome(s)................................................................................................ 19
      4.2           Aviation Sector Reflective Glare – Analysis Tool and Criteria ...................................... 20
      4.3           SGHAT Analysis .......................................................................................................... 23
      4.4           SGHAT Results............................................................................................................ 23

      5             GLARE IMPACT – ROAD AND RAIL DISABILITY GLARE ................................................ 25
      5.1           Surrounding Road and Rail Network ........................................................................... 25
      5.2           Motorist and Rail Operator “Disability” Glare – Analysis Tool and Criteria .................. 26
      5.3           TI Value Analysis and Results...................................................................................... 27

      6             GLARE IMPACT – RESIDENTIAL NUISANCE GLARE ...................................................... 29
      6.1           Surrounding Representative Residences..................................................................... 29
      6.2           Residential “Nuisance” Glare – Analysis Tool and Criteria ........................................... 30
      6.3           TI Value Analysis and Results...................................................................................... 30

      7             GLARE IMPACT – INDUSTRIAL MACHINERY DISABILITY GLARE .................................. 34
      7.1           Surrounding Industrial Operations ............................................................................. 34
      7.2           Industrial Machinery Operator Disability Glare – Analysis Tool and Criteria ................ 35
      7.3           Industrial Machinery Operator Disability Glare – Analysis and Results ........................ 35

      8             NIGHT-TIME ILLUMINATION GLARE ........................................................................... 36
      8.1           Night-Time Illumination Glare – Criteria ..................................................................... 36
      8.2           Night-Time Illumination Glare – Assessment and Mitigation....................................... 38

      9             CONCLUSION ............................................................................................................. 39

                                                                        Page 6
ALINTA Energy Development Pty Ltd                                                             SLR Ref No: 610.30511-R01-v2.1 REFLECTIVE GLARE.docx
Port Hedland Solar Farm                                                                                                               January 2022
Reflective Glare Assessment

      CONTENTS

      DOCUMENT REFERENCES
      TABLES
      Table 1         Key Annual Solar Angle Characteristics for Project Site ............................................ 13
      Table 2         SGHAT Analysis Results – FIXED TILT Scenarios ........................................................ 24
      Table 3         TI Value Results –Results for All Panel Support Scenarios ......................................... 28
      Table 4         TI Value Results –Results for ALL Panel Scenarios..................................................... 30
      Table 5         Typical Illuminance Levels for Various Scenarios ...................................................... 36
      Table 6         Recommended Maximum Values of Light Technical Parameters (AS4282-2019) ...... 37

      FIGURES
      Figure 1        Port Hedland Solar Farm - Location Map .................................................................. 10
      Figure 2        Port Hedland Solar Farm Site Layout of “Maximal Footprint” Array .......................... 12
      Figure 3        Project Site Incoming Solar Angle Variations ............................................................ 14
      Figure 4        Representative Solar PV Panel Reflection Angles from the Project (around
                      equinox) .................................................................................................................. 14
      Figure 5        Typical Reflectivity Curves as a Function of Incidence Angle ..................................... 15
      Figure 6        SGHAT Panel Mode Simulation Options ................................................................... 16
      Figure 7        December 2021 Likely Footprint of the Project ........................................................ 17
      Figure 8        Nearest Aerodrome(s) to Project Site ...................................................................... 19
      Figure 9        Example Solar Glare Ocular Hazard Plot (SGHAT Software Output) .......................... 21
      Figure 10       Example Solar Glare Output Plots (SGHAT Software Output) .................................... 22
      Figure 11       Surrounding Road and Rail Network ........................................................................ 25
      Figure 12       Nearest Representative Residential Receivers.......................................................... 29
      Figure 13       Representative Boodarie Residential Receivers........................................................ 31
      Figure 14       Representative South Hedland Receivers ................................................................. 32
      Figure 15       Representative Elevation Profiles Between Proposed Facility and Some Nearest
                      Residences............................................................................................................... 33
      Figure 16       Boodarie Strategic Industrial Area Site Plan ............................................................. 34
      Figure 17       Luminaire Design Features that Minimise Light Spill................................................. 38

                                                                        Page 7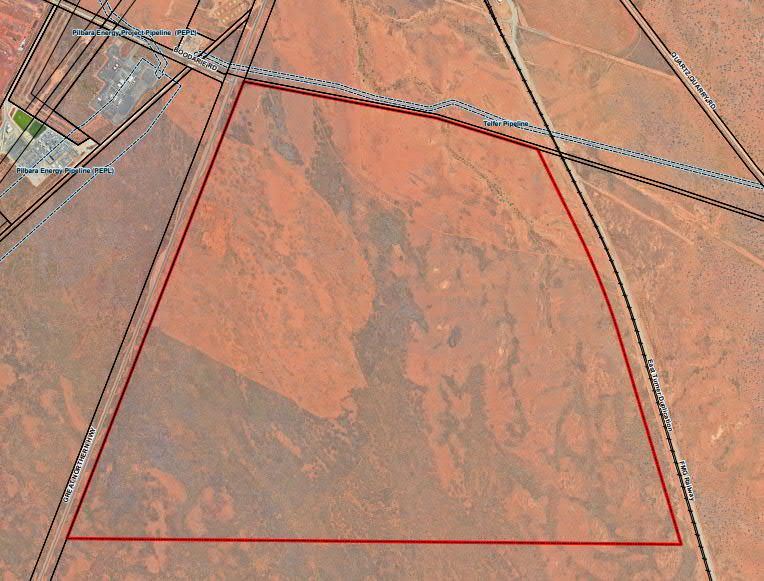
ALINTA Energy Development Pty Ltd                                                    SLR Ref No: 610.30511-R01-v2.1 REFLECTIVE GLARE.docx
Port Hedland Solar Farm                                                                                                      January 2022
Reflective Glare Assessment

Abbreviations and Definitions
 Terms relevant to Daytime Reflective Glare
 PV Panel          Photovoltaic (PV) panels are designed to absorb solar energy and retain as much of the solar spectrum as possible
                   in order to produce electricity.
 Glare             Glare refers to the reflections of the sun off any reflective surface, experienced as a source of excessive brightness
                   relative to the surrounding diffused lighting. Glare covers reflections:
                    . Which can be experienced by both stationary and moving observers (the latter referred to as “glint”).
                    . Which are either specular or diffuse.
 Specular          A reflection which is essentially mirror-like – there is virtually no loss of intensity or angle
                   dispersion between the incoming solar ray and outgoing reflection.

 Diffuse           A reflection in which the outgoing reflected rays are dispersed over a wide (“diffuse”)
                   range of angle compared to the incoming (parallel) solar rays, typical of “rougher”
                   surfaces.

 KVP               Key View Points (KVPs) are offsite locations where receivers of interest have the potential to experience adverse
                   reflective glare.

 Terms relevant to Night-Time Illumination
 Luminous intensity            The concentration of luminous flux emitted in a specific direction. Unit: candela (Cd).
 Luminance                     This is the physical quantity corresponding to the brightness of a surface (eg a lamp, luminaire or
 AS 1158.2:2020                reflecting material such as façade glazing) when viewed from a specified direction. Unit: Cd/m2
 Illuminance                   This is the physical measure of illumination. It is the luminous flux arriving at a surface divided by the
 AS 1158.2:2020                area of the illuminated surface – the unit is lux (lx) … 1 lx = 1 lm/m2
                               The term covers both “Horizontal Illuminance” (the value of illuminance on a designated horizontal
                               plane at ground level) and “Vertical Illuminance” (the value of illuminance on a designated vertical
                               plane at a height of 1.5m above ground level).
 Glare                         Condition of vision in which there is a discomfort or a reduction in the ability to see, or both, caused
 AS 1158.2:2020                by an unsuitable distribution or range of luminance, or to extreme contrast in the field of vision.
                               Glare can include:
                                 (a) Disability Glare – glare that impairs the visibility of objects without necessarily causing
                                       discomfort.
                                 (b) Discomfort Glare – glare that causes discomfort without necessarily impairing the visibility of
                                       objects.
 Threshold Increment (TI)      TI is the measure of disability glare expressed as the percentage increase in contrast required
 AS 4282:2019                  between an object and its background for it to be seen equally well with a source of glare present.
                               Higher TI values correspond to greater disability glare.

                                                                  Page 8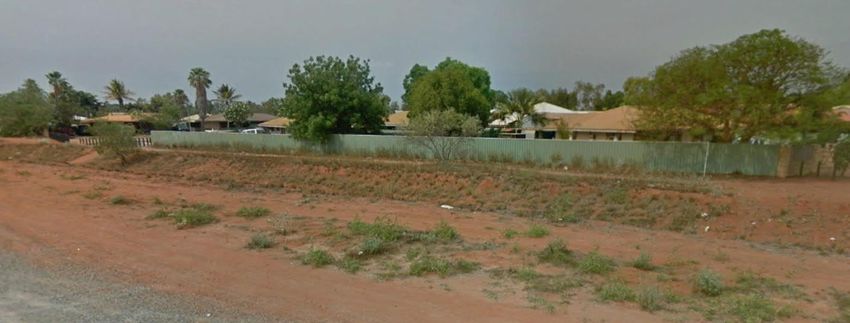
ALINTA Energy Development Pty Ltd                                          SLR Ref No: 610.30511-R01-v2.1 REFLECTIVE GLARE.docx
    Port Hedland Solar Farm                                                                                            January 2022
    Reflective Glare Assessment

1               INTRODUCTION
SLR Consulting Australia Pty Ltd (SLR) has been engaged by Alinta Energy Development Pty Ltd
(Alinta) to carry out a Reflective Glare assessment of the proposed 90 MWac Port Hedland
Solar Farm (the “Project”).
The Project is located on Unallocated Crown Land near the existing Port Hedland Power Station (PHPS), and will
comprise:
           ·   Three 30 MWac blocks configured as a single facility, with approximately 220,000 solar panels on a fixed
               tilt support system.

The following potential glare conditions have been considered:
       ·       Daytime            Reflective glare (and glint) arising from the solar PV panels within the facility
       ·       Night-time         Illumination glare from 24/7 operational security lighting within the facility

1.1             Structure of Report

The remainder of this report is structured as follows:
·          Section 2     describes the Project and surrounding environment;
·          Section 3     describes the input parameters needed to carry out the glare analysis;
·          Section 4     presents the analysis and results covering aviation glare;
·          Section 5     presents the analysis and results covering road and rail disability glare;
·          Section 6     presents the analysis and results covering industrial machinery disability glare;
·          Section 7     presents the analysis and results covering residential nuisance glare;
·          Section 8     presents the analysis and results covering night-time illumination glare;
·          Section 9     presents the conclusions of the study.

                                                                Page 9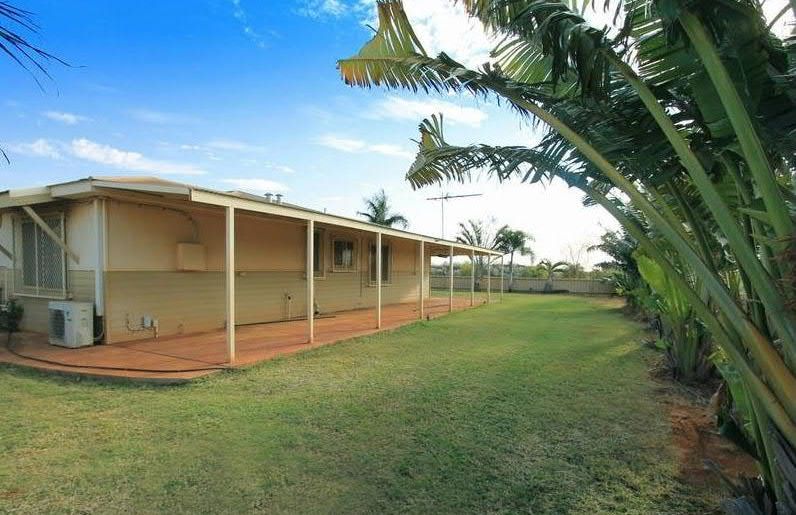
ALINTA Energy Development Pty Ltd                                           SLR Ref No: 610.30511-R01-v2.1 REFLECTIVE GLARE.docx
 Port Hedland Solar Farm                                                                                             January 2022
 Reflective Glare Assessment

2          PROPOSED PORT HEDLAND SOLAR FARM PROJECT
2.1        Site Location

The Project is seeking approval for a 90 MWac photovoltaic (PV) solar plant as shown in Figure 1.
      ·   The Project NE corner is located approximately 8 km from PHIA Runway 14/32.
      ·   The Project lies just over 4 km from the township centre of South Hedland and 1.5 km from the nearest
          residences at Boodarie to the east.

In terms of the relative heights of the Project and surrounds:
      ·   Ground elevations (ASL) at the Port Hedland Solar Farm range from 16 m to 18 m.
      ·   Ground elevations (ASL) in the surrounds, extending out to Port Hedland airport to the northeast are
          similar or range down to 12 m.

From the above, it can be seen that the terrain in the vicinity of the Project site in all directions of interest is
reasonably flat, with surrounding nearest receivers (aviation, motorists, rail, residences, etc) at similar elevations
compared to the solar farm.

Figure 1     Port Hedland Solar Farm - Location Map

                                                          Runway 18/36

                                                      Runway 14/32

                                                            Port Hedland
                                                        International Airport

                                                                                              South Hedland
                Greater
               Northern
               Highway
                                                                       FMG’s East Turner
                                                                        Rail Duplication

                                                                                 Boodarie

                                                                     Proposed
                                                                  PV Solar Facility

                                                        Page 10
ALINTA Energy Development Pty Ltd SLR Ref No: 610.30511-R01-v2.1 REFLECTIVE GLARE.docx
Port Hedland Solar Farm January 2022
Reflective Glare Assessment
2.2 Site Description and Key Project Components
From a Reflective Glare point of view, the key components of the Project are:
· the photovoltaic (PV) modules in relation to their daytime reflective glare potential; and
· the facility’s security/emergency lighting design in relation to potential night-time illumination glare
issues, if such 24/7 lighting is incorporated into the Project – note: none is currently planned.
Array Footprint: Likely Final Design versus Assessed Array
The land required for the Project has been subject to ongoing constraints identification through various site
investigations, eg native vegetation, areas of cultural or heritage significance, etc, which will help define the final
array boundary.
The footprint of the Project has been refined as these site investigations have been completed and the
assessment of any constraints and their impact, including issues surrounding glare.
Accordingly, this report has modelled a far more extensive “maximal” footprint project than is likely to be
constructed. The final design will be a subset of the design modelled herein – refer Section 3.5.
“Maximal Footprint” Solar Panel Mounted Array – refer Figure 2
The maximal footprint array assessed int this study is shown in Figure 2(a) and would consist of fixed mounting
supports oriented in an east-west direction, each supporting solar panels tilted northwards (220,000 panels in
total);
· The panel support system is a FIXED TILT system – currently assumed to be facing north with a likely tilt
of close to 20° - refer Figure 2(b);
· The fixed tilt panel support system is oriented east-west;
· Individual panels (2.256 m x 1.133 m) will have a minimum ground clearance of 0.5 m at their fixed tilt
position.
Page 11ALINTA Energy Development Pty Ltd SLR Ref No: 610.30511-R01-v2.1 REFLECTIVE GLARE.docx
Port Hedland Solar Farm January 2022
Reflective Glare Assessment
Figure 2 Port Hedland Solar Farm Site Layout of “Maximal Footprint” Array
(a) Indicative “Maximal Footprint” Site Layout
Access to Great
Northern Highway
Solar PV Panels
Fixed Tilt Supports
Facing North
(b) Panel Mounting System ( 10° to 20° Slope to the North )
Tilt Angle: close to
20° from Horizontal
Panel Supports
Oriented East-West
Page 12ALINTA Energy Development Pty Ltd SLR Ref No: 610.30511-R01-v2.1 REFLECTIVE GLARE.docx
Port Hedland Solar Farm January 2022
Reflective Glare Assessment
3 GLARE IMPACT ASSESSMENT - INPUTS
The following potential glare conditions have been considered:
· Daytime Reflective glare (and glint) arising from the solar PV panels
· Night-time Illumination glare if any 24/7 operational security lighting is located within the site
3.1 Project Site Solar Angles – Annual Variations
One of the challenging issues encountered with daytime solar panel glare is the varying nature of the reflections,
whose duration will vary with time of day and day of the year as the sun’s rays follow variable incoming angles
between the two extremes of:
· summer solstice - sunrise incoming rays from just south of east, maximum angle altitude rays at midday,
sunset incoming rays from just south of west
· winter solstice - sunrise incoming rays from the northeast, minimum angle altitude rays at midday,
sunset incoming rays from the northwest
Any solar glare analysis must take into account the complete cycle of annual reflection variations noted above.
The potential range of incoming solar angles at the Project site relevant to daytime glare is shown in Figure 3
with relevant critical angles summarised in Table 1.
Table 1 Key Annual Solar Angle Characteristics for Project Site
Day of Year Sunrise Sunset Azimuth Range (sunrise-sunset) Max Altitude
Summer Solstice 5:31 am 6:45 pm ±115.1° East & West of North 86.5°
Equinox 6:12 am 6:13 pm ±90.6° East & West of North 69.9°
Winter Solstice 6:41 am 5:27 pm ±64.9° East & West of North 46.0°
3.2 Project Solar Reflections
The project will use fixed tilt panels (mounted on an east-west axis, ie facing north) as described in Section 2.2.
In “plan” view, reflections from the Project’s panels will be directed as shown in Figure 4 for a representative
area of panels, with the direction of reflected rays shown for the typical equinox day. For this example, the
sunrise and sunset angles of incoming solar rays are due east and due west respectively.
Page 13ALINTA Energy Development Pty Ltd SLR Ref No: 610.30511-R01-v2.1 REFLECTIVE GLARE.docx
Port Hedland Solar Farm January 2022
Reflective Glare Assessment
Figure 3 Project Site Incoming Solar Angle Variations
90
Altitude, deg ( 0 = Horizon , 90 = Vertical )
21-Dec
80 Port Hedland
21-Sep
70 Solar Farm
21-Jun
60
50
40
30
20
10
0
3 6 9 12 15 18 21
Time of Day ( "12" = Noon )
120
Azimuth, deg ( -90 = E , 0 = N , 90 = W )
21-Dec
90
21-Sep
60
21-Jun
30
0
-30
-60 Port Hedland
-90 Solar Farm
-120
3 6 9 12 15 18 21
Time of Day ( "12" = Noon )
Figure 4 Representative Solar PV Panel Reflection Angles from the Project (around equinox)
Midday
Mid-morning equinox reflections Mid-afternoon
equinox reflections equinox reflections
Early morning Late afternoon
equinox reflection equinox reflections
Page 14ALINTA Energy Development Pty Ltd SLR Ref No: 610.30511-R01-v2.1 REFLECTIVE GLARE.docx
Port Hedland Solar Farm January 2022
Reflective Glare Assessment
3.3 Solar Panel Reflectivity
Solar PV panels are designed to capture (absorb) the maximum possible amount of light within the layers below
the front (external) surface. Consequently, solar PV panels are designed to minimise reflections off the surface
of each panel. Reflections are a function of:
· the angle at which the light is incident onto the panel (which will vary depending on the specific location,
time of day and day of the year), and
· the index of refraction of the front surface of the panel and associated degree of diffuse (non-
directional) versus specular (directional or mirror-like) reflection which is a function of surface texture
of the front module (reflecting) surface.
Some typical reflectivity values (given in terms of the “n” refractive index value) are:
· Snow (fresh, flaky) n = 1.98
· Standard Window Glass n = 1.52
· Plexiglass, Perspex n = 1.50
· Solar Glass n = 1.33
· Solar Glass with AR Coating n = 1.25
] Standard PV Solar Panels
Representative reflectivity curves are shown in Figure 5.
Figure 5 Typical Reflectivity Curves as a Function of Incidence Angle
Light striking Light striking
perpendicular almost parallel
to surface to surface
Page 15ALINTA Energy Development Pty Ltd SLR Ref No: 610.30511-R01-v2.1 REFLECTIVE GLARE.docx
Port Hedland Solar Farm January 2022
Reflective Glare Assessment
Figure 5 shows that:
· When an oncoming solar ray strikes the surface of a solar PV panel close to perpendicular to the panel
surface (ie low “incident” angle), reflectivity is minimal, less than 5% for all solar panel surface types.
· It is only when an incoming solar ray strikes the panel at large “incidence” angles, ie closer to parallel to
the panel, that reflectivity values increase. When this happens, reflections become noticeable and
potentially at “glare” level for all solar panel surface types.
· However, for very high incidence angle, it would almost always be the case that the observer (motorist,
train driver, resident, etc) would perceive reflections coming from virtually the same direction as the
incoming solar rays themselves. Such a condition would not constitute a glare situation as the intensity
of the incoming solar ray itself would dominate the field of vision perceived by the observer.
3.4 Modelling Real-World Tracking Axis Operational Modes
Commercially available software tools, eg SGHAT for Aviation Glare, are typically capable of modelling solar farm
panel positions in one of three modes – as shown in Figure 6.
· Fixed Tilt Mode: in this mode, all panels are assumed to remain at a user-defined fixed angle all day
long, eg horizontal, 5°North, 25°North, 10°East, 10°West, etc – refer Figure 6-A;
· Normal Tracking Mode: in this mode, panels move between maximum tilt angles once the sun reaches
the relevant altitude angle (eg an altitude angle of 30° for ±60° single-axis trackers). They remain at the
maximum tilt angles at all other times, switching over from west to east at midnight – refer Figure 6-B;
· Normal Tracking Mode / Fixed Tilt Stowed: in this mode, panels move during the day in “normal
tracking” mode, but can then move (essentially instantaneously) to any user-defined fixed tilt angle at
all other times – refer Figure 6-C, where in this case the panels move to a horizontal position (ie 0°)
outside of “normal tracking” hours.
Figure 6 SGHAT Panel Mode Simulation Options
SGHAT - Fixed Tilt Mode: 15°East SGHAT - Normal Tracking Mode: ±60°
( 0° is horizontal; -ve to East; +ve to West )
( 0° is horizontal; -ve to East; +ve to West )
90 90
75 75
Panel Tilt Position in Degrees
Panel Tilt Position in Degrees
60 60
Noon
45
30
A 45
30
15
Sunrise Sunset 15
0 0 Sunset
-15 -15
Sunrise
-30
-45
-30
-45
B
-60 Noon -60
-75 -75
-90 -90
12:00:00
15:00:00
18:00:00
21:00:00
12:00:00
15:00:00
18:00:00
21:00:00
0:00:00
3:00:00
6:00:00
9:00:00
0:00:00
0:00:00
3:00:00
6:00:00
9:00:00
0:00:00
Time of Day Time of Day
SGHAT - Normal Tracking Mode ±60° / Fixed Tilt 0°
( 0° is horizontal; -ve to East; +ve to West )
90
75
Panel Tilt Position in Degrees
60
Noon
45
30
C
15
0
-15
-30
-45
-60 Sunrise Sunset
-75
-90
12:00:00
15:00:00
18:00:00
21:00:00
0:00:00
3:00:00
6:00:00
9:00:00
0:00:00
Time of Day
Page 16ALINTA Energy Development Pty Ltd SLR Ref No: 610.30511-R01-v2.1 REFLECTIVE GLARE.docx
Port Hedland Solar Farm January 2022
Reflective Glare Assessment
3.5 Project Ultimate Footprint
As previously stated, the land required for the Project has been subject to ongoing constraints identification
through various site investigations, eg native vegetation, areas of cultural or heritage significance, etc, which
will help define the final array boundary.
The footprint of the Project has been refined as these site investigations have been completed and the
assessment of any constraints and their impact, including issues surrounding glare.
At the commencement of this study in mid-2021, the overall “maximal” footprint of the Project was as shown
in Figure 1 and Figure 2. Accordingly, as a conservative approach, the analysis undertaken in this report adopted
this “maximal” footprint.
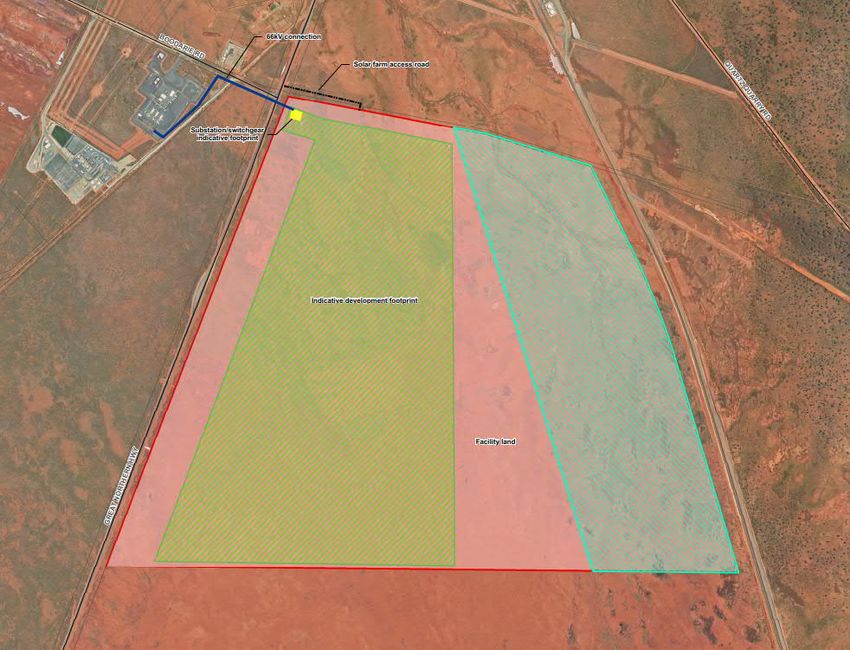
As of December 2021, the most recent likely Project footprint is shown in Figure 7.
Figure 7 December 2021 Likely Footprint of the Project
Page 17ALINTA Energy Development Pty Ltd SLR Ref No: 610.30511-R01-v2.1 REFLECTIVE GLARE.docx
Port Hedland Solar Farm January 2022
Reflective Glare Assessment
Comparison of “Maximal” Footprint Modelled in this Study with Latest December 2021 Design Footprint
A comparison between Figure 2 and Figure 7 shows that the most recent December 2021 design footprint is a
substantially-reduced subset of the “maximal” analysis footprint used in this study.
In particular the December 2021 design footprint of the proposed facility has:
· Eliminated almost the entire eastern half of the “maximal footprint” array;
· Eliminated a significant section of the “maximal footprint” array’s southern section;
· Stepped back from the Great Western Highway; and
· Stepped back from the site’s northern perimeter.
Page 18ALINTA Energy Development Pty Ltd SLR Ref No: 610.30511-R01-v2.1 REFLECTIVE GLARE.docx
Port Hedland Solar Farm January 2022
Reflective Glare Assessment
4 GLARE IMPACT – AVIATION GLARE
4.1 Nearest Aerodrome(s)
Port Hedland International Airport (IATA: PHE; ICAO: YPPD) is located to the northeast of the Project site.
Figure 8 shows (landing) flight paths of interest.
· The aerodrome’s main 2,500 m chipseal runway is Runway 14/32, oriented roughly northwest-
southeast. The runway lies just over 8.1 km from the nearest Project boundary.
· In relation to aircraft approaching Runway 14 or Runway 32, the Project would be almost perpendicular
to the line of sight of pilots during landing.
· The aerodrome’s secondary 1,000 m chipseal runway is Runway 18/36, oriented roughly north-south.
The runway’s southern threshold lies just over 8.3 km from the nearest Project boundary.
· Aircraft approaching Runway 36 would have the Project “behind” their line of sight, whereas aircraft
approaching Runway 18 would have the Project in their field of view, albeit with an angle difference of
roughly 45° to the direct line of sight of pilots during landing.
· The aerodrome’s air traffic control tower is located just to the west of Runway 14/32’s midpoint and
approximately 7.8 km from the nearest Project boundary.
On the basis of the above, it was concluded that a quantitative analysis should be carried out to assess the
potential for aviation glare from the Project.
Figure 8 Nearest Aerodrome(s) to Project Site
Runway 18
Runway 14 Port Hedland
International Airport
Air Traffic
Control Tower
Runway 36 Runway 32
Port Hedland
Solar Farm
Page 19ALINTA Energy Development Pty Ltd SLR Ref No: 610.30511-R01-v2.1 REFLECTIVE GLARE.docx
Port Hedland Solar Farm January 2022
Reflective Glare Assessment
4.2 Aviation Sector Reflective Glare – Analysis Tool and Criteria
The impact of solar PV systems on aviation activity is something that solar developers today are addressing more
and more often, given the (global) proliferation of solar projects, in particular those located either within or
around airport precincts.
US FAA - SGHAT
In relation to the potential impact of solar PV systems on aviation activity, guidance is available from the US FAA
which regulates and oversees all aspects of American civil aviation. The FAA issued a Technical Guidance Policy
in 2010 and a subsequent (over-riding) Interim Policy in 2013. The Technical Guidance Policy was updated in
2018.
· FAA, “Technical Guidance for Evaluating Selected Solar Technologies on Airports”, Federal Aviation
Administration, Washington, D.C., November 2010.
· FAA, “Interim Policy, FAA Review of Solar Energy System Projects on Federally Obligated Airports”,
Federal Register, Oct. 23, 2013.
· FAA, “Technical Guidance for Evaluating Selected Solar Technologies on Airports”, Federal Aviation
Administration, Washington, D.C., Version 1.1, April 2018.
In support of the above, the FAA contracted Sandia Labs to develop their Solar Glare Hazard Analysis Tool
(SGHAT) software as the standard tool for measuring the potential ocular impact of any proposed solar facility
on a federally obligated airport. SGHAT utilises the Solar Glare Ocular Hazard Plot to determine and assess the
potential for glare. SGHAT is described in the following references:
· Ho, C.K., Ghanbari, C.M. and Diver, R.B., “Methodology to Assess Potential Glint and Glare Hazards from
Concentrating Solar Power Plants: Analytical Models and Experimental Validation”, J. Solar Engineering,
August 2011, Vol.133, 031021-1 to 031021-9.
· Ho, C.K. & Sims, C., “Solar Glare Hazard Analysis Tool (SGHAT) User’s Manual v2.0”, Sandia National
Laboratories, Albuquerque, NM. August 2013.
Australia’s CASA (Civil Aviation Safety Authority) recommends SGHAT for aviation glare assessments related to
solar facilities located near aerodromes.
A sample Solar Glare Ocular Hazard Plot is shown in Figure 9.
The analysis contained in this plot is derived from solar simulations that extend over the ENTIRE CALENDAR YEAR
in 1-MINUTE intervals, sunrise to sunset.
The SGHAT criteria state that a proposed solar facility should satisfy the following:
· Airport Traffic Control Tower (ATCT) cab: NO Glare
· Final approach paths for landing aircraft: Glare to NOT exceed “Low Potential for After-Image”
· SGHAT assessments should take into account planned (ie future) ATCTs and runways in glare studies.
Page 20ALINTA Energy Development Pty Ltd SLR Ref No: 610.30511-R01-v2.1 REFLECTIVE GLARE.docx
Port Hedland Solar Farm January 2022
Reflective Glare Assessment
Figure 9 Example Solar Glare Ocular Hazard Plot (SGHAT Software Output)
In Figure 9, the following is noted:
· SGHAT ocular impact is a function of both the “retinal irradiance” (ie the light seen by the eye) and
“subtended source angle” (ie how wide an arc of view the light appears to be arriving from).
· SGHAT ocular impact falls into three categories:
. GREEN: low potential to cause “after-image”
. YELLOW: potential to cause temporary “after-image”
. RED: potential to cause retinal burn (permanent eye damage)
· “After Image” is the term applied to a common retinal phenomenon that most people have experienced
at some point or other, such as the effect that occurs when a photo with flash is taken in front of a
person who then sees spots in front of their eyes for a few seconds. A more extreme example of “after-
image” occurs when staring at the sun. “After-image” (also known as “photo bleaching”) occurs because
of the de-activation of the cells at the back of the eye’s retina when subjected to a very bright light.
· The SGHAT plot provides an indication of the relative intensity of both the incoming reflection and the
sources of light itself (ie the sun).
. The occurrence of glare is shown in the plot as a series of orange circles,
one circle for each minute that a reflection is visible.
. A reference point is also shown in each SGHAT plot, the yellow circle with the green outline,
representing the hazard level of viewing the sun without filtering, ie staring at the sun.
· In Figure 9, it can be seen that the reflection visible by the receiver is roughly 1,000 times less intense
than the light from the sun.
· Finally, in relation to PV Solar facilities, it is important to note that the third SGHAT Ocular Plot “RED”
category is not possible, since PV modules DO NOT FOCUS reflected sunlight.
Page 21ALINTA Energy Development Pty Ltd SLR Ref No: 610.30511-R01-v2.1 REFLECTIVE GLARE.docx
Port Hedland Solar Farm January 2022
Reflective Glare Assessment
Additional Information Available with the SGHAT Analysis Tool
In addition to the above “assessment” output, the SGHAT software package also produces information which
reveals the extent of visibility of reflections at any chosen receiver position, regardless of whether the reflections
constitute a glare condition or not – an example is shown in Figure 10.
· Figure 10-A: shows the am/pm time periods when reflections occur at a specific position throughout the
year, in this case typically between around 3:30 pm and 4:00 pm.
· Figure 10-B: shows the months during the year and the minutes per day when reflections occur at a
specific position, in this case from early-May to the start of August, for periods ranging up to 13 minutes
per day.
· As noted above, this information is made possible because the SGHAT analysis covers the entire solar
annual cycle in 1-minute intervals to ascertain any potential impacts on surrounding receivers.
· Finally, Figure 10-C shows WHERE within the solar farm panel array the reflection rays of interest are
emanating from, in this case from panels near the southwest corner.
Figure 10 Example Solar Glare Output Plots (SGHAT Software Output)
4:00pm
B.
3:00pm
A. Early Start
May August
Panel
Array
Location within
solar panel array
generating reflections
C.
Page 22ALINTA Energy Development Pty Ltd SLR Ref No: 610.30511-R01-v2.1 REFLECTIVE GLARE.docx
Port Hedland Solar Farm January 2022
Reflective Glare Assessment
4.3 SGHAT Analysis
On the basis of the proximity of Port Hedland Airport to the Project, a quantitative analysis was carried out using
the SGHAT software tool to examine the potential for adverse glare (and glint) from the Project.
· Aircraft flight paths examined are landing scenarios (worst-case with the pilot looking downwards) –
these are shown in Figure 8.
SGHAT Modelling Assumptions:
· All runway approaches shown in Figure 8 were examined.
· Landing flight paths are aligned with their respective runways.
· All aircraft landing flight paths are 2 miles in length, on a 3° glide
angle (standard SGHAT protocol).
· Aircraft are assumed to be at a height of 5 m above ground elevation
as they pass over the respective runway threshold.
· SGHAT was also used to analyse potential impacts on the
aerodrome’s Air Traffic Control Tower.
· The SGHAT analysis examines ALL possible solar angles throughout
the year – in 1-minute intervals.
· The reflectivity of the PV panels was assumed to be the same as that
shown in the standard solar glass shown in Figure 5.
A number of panel scenarios were assessed:
· “Fixed Tilt NORTH”: panels tilted upwards 5°, 10°, 15°, 20° and 25°
– panels support system running east-west
– panels therefore “face north”
· “15° Fixed Tilt 10° Bias”: panels tilted upwards 15°
– panels support system rotated clockwise 10°
– panels therefore face slightly east of north
· “15° Fixed Tilt 350° Bias”: panels tilted upwards 15°
– panels support system rotated anti-clockwise 10°
– panels therefore face slightly west of north
4.4 SGHAT Results
The SGHAT Ocular Plot results for all scenarios and all flight paths shown in Figure 8 are presented in Table 2,
along with the results for the Air Traffic Control Tower (ATCT). The results are presented in term of the total
number of minutes in a year that solar panel reflections would be potentially visible within any relevant SGHAT
“zone” (refer Figure 9).
It will be recalled that solar panel reflections (glint and glare) are acceptable according to the FAA-SGHAT
protocol if there are no “Yellow” zone or “Red” zone results for aircraft flight landing paths and no “Green” zone,
“Yellow” zone or “Red” zone results for the ATCT.
Page 23ALINTA Energy Development Pty Ltd SLR Ref No: 610.30511-R01-v2.1 REFLECTIVE GLARE.docx
Port Hedland Solar Farm January 2022
Reflective Glare Assessment
Table 2 SGHAT Analysis Results – FIXED TILT Scenarios
SGHAT Results ( minutes that reflections are in each zone per year )
Panel
Support Runway 14 Runway 32 Runway 18 Runway 36 ATCT
Mode “Green” “Yellow “Green” “Yellow “Green” “Yellow “Green” “Yellow “Green” “Yellow
Zone ” Zone Zone ” Zone Zone ” Zone Zone ” Zone Zone ” Zone
5° / North 0 0 0 0 0 0 0 0 0 0
10° / North 0 0 0 0 0 0 0 0 0 0
15° / 10° 0 0 0 0 0 0 0 0 0 0
15° / North 0 0 0 0 0 0 0 0 0 0
15° / 350° 0 0 0 0 0 0 0 0 0 0
20° / North 0 0 0 0 0 0 0 0 0 0
25° / North 0 0 0 0 0 0 0 0 0 0
Table 2 shows that:
· The proposed solar farm will comply with SGHAT requirements for ANY Fixed Tilt panel mode involving
an upward tilt ranging from 5° to 25° with the panels “facing” due north.
· The proposed solar farm will also comply with SGHAT requirements for a Fixed Tilt panel mode of around
15° if the orientation of the panels (ie the perpendicular “pointing” axis of the panels) is allowed to vary
from due north by ±10°.
The primary reasons for the above results are:
· The distance of the proposed solar farm from Port Hedland International Airport; and
· The difference in line of sight of pilots on final approach for the airport’s runways.
Page 24ALINTA Energy Development Pty Ltd SLR Ref No: 610.30511-R01-v2.1 REFLECTIVE GLARE.docx
Port Hedland Solar Farm January 2022
Reflective Glare Assessment
5 GLARE IMPACT – ROAD AND RAIL DISABILITY GLARE
5.1 Surrounding Road and Rail Network
The “major” and “minor” road thoroughfares in the immediate vicinity of the Project as well as nearby rail lines
are shown in Figure 11:
· Great Northern Highway – northbound and southbound “major”
· Boodarie Station Access Road – eastbound and westbound “minor”
· FMG’s East Turner Duplication – northbound and southbound
Figure 11 Surrounding Road and Rail Network
FMG’s East Turner
Duplication
Boodarie Station
Access Road
Great Northern
Highway
Port Hedland
Solar Farm
Page 25ALINTA Energy Development Pty Ltd SLR Ref No: 610.30511-R01-v2.1 REFLECTIVE GLARE.docx
Port Hedland Solar Farm January 2022
Reflective Glare Assessment
5.2 Motorist and Rail Operator “Disability” Glare – Analysis Tool and Criteria
The criteria commonly used by Australian Local Government Authorities to assess the acceptability or otherwise
of potential adverse reflections from glazed façade systems onto surrounding roadways and pedestrian
crossings utilise the so-called Threshold Increment (TI) Value of the reflection condition.
TI Value Definition
AS/NZS 4282:2019 and CIE 140-2019 define the Threshold Increment (TI) as:
"the measure of disability glare expressed as the percentage increase in contrast required between an
object and its background for it to be seen equally well with a source of glare present. Note: Higher values
of TI correspond to greater disability glare."
The TI Value is calculated as the ratio of “veiling” luminance (eg from a reflection) to the overall average
background (“adaptation”) luminance, with the necessary constant and exponent parameters shown below …
TI % = 65 . 0.05 < L < 5.0
TI % = 95 . L > 5.0
where:
· Lv = veiling luminance from a source of interest ( eg reflection ) – Cd/m2
· Lad = so-called “adaptation” luminance ( total background ) – Cd/m2
· The motorist eye height is taken to be 1.5 m above the road surface; their line of sight is taken to be 1°
down relative to the plane of the road surface and the windshield (windscreen) cut-off angle can be
assumed to be 20° above the horizontal.
TI Value Acceptability Criteria
The acceptability criteria adopted by Australian Local Government Authorities to assess the acceptability or
otherwise of potential adverse reflections on roadways and pedestrian crossings utilise the above TI Value of
the reflection condition (refer above for calculation equations).
For (Motorist) Traffic Disability Glare, the TI Value should remain:
· Below 10% for major roads
· Below 20% for minor roads
For Pedestrian Discomfort Glare, the TI Value should remain:
· Below 2% at critical locations such as pedestrian crossings
· Below 3% for other locations
Note: for the present study, Pedestrian Discomfort Glare provides a useful benchmarking tool for the
assessment of potential nuisance glare at surrounding residential receivers.
Page 26ALINTA Energy Development Pty Ltd SLR Ref No: 610.30511-R01-v2.1 REFLECTIVE GLARE.docx
Port Hedland Solar Farm January 2022
Reflective Glare Assessment
Almost all Australian Rail Authorities have guidelines covering glare in general (ie not specific to solar PV panel
glare) aimed at avoiding discomfort/distraction to train operators and obscuring train signals. Most guidelines
refer either to Table 2.10 of AS 1158.3.1 for the TI Value criterion and/or Table 3.2 of AS 1158.4 for the Cd
(Candela) criterion associated with the control of glare.
For Rail Traffic Disability Glare, the relevant criteria are:
· The TI Value should remain below 20% ( this is the same as per “minor” roads )
· The Cd Value at 70˚ incidence should remain below 6,000.
5.3 TI Value Analysis and Results
Important factors influencing the potential for road and rail disability glare include:
· Any difference in elevation between the motorist or rail operator and the solar panel array;
· The potential for solar reflections of concern to be obstructed by intervening terrain and topography as
well as dense vegetation; and
· The difference between the line of sight of a driver (ie in the direction of the road or rail line) and the
line of sight relative to incoming reflections. Significant TI values can only occur when this difference is
modest. In some cases, eg when traffic is moving away from the line of incoming reflections, such
reflections become essentially invisible – this would apply for example to traffic on Boodarie Station
Access Road travelling westwards after turning off the Great Northern Highway.
SLR has undertaken TI Value calculations for the roadways and rail lines shown in Figure 11. Calculation
locations were varied along the relevant carriageways, focussing on positions where the difference between the
line of sight of drivers and the angle of potential incoming solar reflected rays was at a minimum.
TI Value Results
Table 3 shows the results of the TI Value calculations for all panel support scenarios.
· Great Northern Highway: Reflections will be visible for a few minutes in May and August (two weeks
each month) very early in the morning just for the 5° tilt north facing mode, with TI Values just reaching
the recommended criteria. This occurs for section of the highway very close to the proposed solar farm,
ie well to the south of the intersection of the highway and FMG’s East Turner Duplication. TI Values are
NIL for all other fixed tilt modes.
· Boodarie Station Access Road: Reflections will NOT be visible for WESTbound traffic for ANY FIXED TILT
panel scenario. Reflections may be “visible” but below the relevant limiting TI Value for EASTbound
traffic with TI Values increasing with an increase in panel tilt position. The highest TI Values were
registered when the northerly orientation of the panels was allowed to shift westwards by 10° (the Fixed
Tilt 15° / Orientation 350° scenario).
· FMG East Turner Duplication: Reflections will be visible for a few minutes in April and August (three
weeks each month) very late in the afternoon for the 5° tilt north facing mode and for the 15° tilt mode
which has a 10° east orientation bias. On these occasions, TI Values will be within the recommended
criteria. TI Values are nil for all other fixed tilt modes.
Page 27ALINTA Energy Development Pty Ltd SLR Ref No: 610.30511-R01-v2.1 REFLECTIVE GLARE.docx
Port Hedland Solar Farm January 2022
Reflective Glare Assessment
Table 3 TI Value Results –Results for All Panel Support Scenarios
Carriageway TILT TI Occurrence
Direction Scenario Value Months Hour of Day Ave Min / Day
5° / North TI ~ 10 May & Aug ~6:30am 2 min
10° / North nil na na na
15° / 10° nil na na na
Great Northern Highway 15° / North nil na na na
15° / 350° nil na na na
20° / North nil na na na
25° / North nil na na na
5° / North TI ~ 7 Oct-Feb 5:30-6:00am 3 min
10° / North TI ~ 9 Oct-Feb 5:45-6:15am 6 min
15° / 10° TI ~ 5 Sep-Feb 6:15-6:30am 5 min
Boodarie Station
15° / North TI ~ 11 Sep-Feb 6:00-6:30am 10 min
Access Road
15° / 350° TI ~ 17 Sep-Mar 6:15-6:45am 12 min
20° / North TI ~ 13 Sep-Mar 6:15-6:45am 12 min
25° / North TI ~ 15 Sep-Mar 6:30-7:00am 15 min
5° / North TI ~ 11 Apr & Aug ~6:00pm 3 min
10° / North nil na na na
15° / 10° TI ~ 11 Apr & Aug 6:00pm 3 min
FMG East Turner
15° / North nil na na na
Duplication
15° / 350° nil na na na
20° / North nil na na na
25° / North nil na na na
Recommendations:
· The proposed solar farm will comply with the recommended TI Value criteria for both road and rail under
any Fixed Tilt panel mode with an upwards tilt of at least 10°.
· For a typical FIXED TILT position (say in the range 15°-20°), allowing the array to have a slight eastwards
orientation (eg facing 10° east) increases the potential visibility of reflections to the adjacent FMG East
Turner Rail Line. Allowing the array to have a slight westwards orientation (eg facing 350° west)
increases the potential visibility of reflections to Boodarie Station Access Road traffic. It is
recommended therefore that the orientation of the panels be aligned as close to North as possible,
regardless of the FIXED TILT angles of the panels.
Page 28ALINTA Energy Development Pty Ltd SLR Ref No: 610.30511-R01-v2.1 REFLECTIVE GLARE.docx
Port Hedland Solar Farm January 2022
Reflective Glare Assessment
6 GLARE IMPACT – RESIDENTIAL NUISANCE GLARE
6.1 Surrounding Representative Residences
Figure 12 shows a group of nearest representative residential receivers surrounding the Project site. 10 such
receivers were selected, mostly running along the western perimeter of Boodarie and southwestern perimeter
of South Hedland. They are located to the east and northeast of the Project site.
Figure 12 Nearest Representative Residential Receivers
Port Hedland
Solar Farm
Page 29You can also read