Pilot Test of a Methodology for an Observation Survey of Motorcycle Personal Protective Equipment - DOT HS 813 062 May 2021
←
→
Page content transcription
If your browser does not render page correctly, please read the page content below
DOT HS 813 062 May 2021

Pilot Test of a Methodology for an
Observation Survey of Motorcycle
Personal Protective Equipment
DISCLAIMER

 This publication is distributed by the U.S. Department of Transportation, National
 Highway Traffic Safety Administration, in the interest of information exchange.
 The opinions, findings, and conclusions expressed in this publication are those of
 the authors and not necessarily those of the Department of Transportation or the
 National Highway Traffic Safety Administration. The United States Government
 assumes no liability for its contents or use thereof. If trade names, manufacturers’
 names, or specific products are mentioned, it is because they are considered
 essential to the object of the publication and should not be construed as an
 endorsement. The United States Government does not endorse products or
 manufacturers.

Suggested APA Format Citation:

Benedick, A., De Leonardis, D., Green, J., & Petraglia, E. (2021, May). Pilot test of a
methodology for an observation survey of motorcycle personal protective equipment (Report No.
DOT HS 813 062). National Highway Traffic Safety Administration.
Technical Report Documentation Page
 1. Report No. 2. Government Accession No. 3. Recipient’s Catalog No.
 DOT HS 813 062
 4. Title and Subtitle 5. Report Date
 Pilot Test of a Methodology for an Observation Survey of Motorcycle May 2021
 Personal Protective Equipment

 7. Authors 8. Performing Organization Report No.
 Benedick, A., De Leonardis, D., Green, J., & Petraglia, E.

 9. Performing Organization Name and Address 10. Work Unit No. (TRAIS)
 Westat, Inc. 11. Contract or Grant No
 1600 Research Boulevard DTNH22-11-D000222L/0007
 Rockville, MD 20850
 12. Sponsoring Agency Name and Address 13. Type of Report and Period Covered
 National Highway Traffic Safety Administration Final Report, 9/28/2016 – 12/28/2018
 Office of Behavioral Safety Research 14. Sponsoring Agency Code
 1200 New Jersey Avenue SE
 Washington, DC 20590
 15. Supplementary Notes
 Kathryn Wochinger was the project manager for this study.

 16. Abstract
 Motorcycle personal protective equipment (PPE), an important traffic safety countermeasure, can include a
 safety-certified helmet, impact- and skid-resistant jackets and pants, motorcycle gloves, and sturdy, over-ankle
 boots. NHTSA, State highway safety offices (SHSO), and motorcycle safety groups conduct programs to
 encourage motorcyclists to use protective gear, especially helmets, but the impact of these programs is not well
 understood. Compared to observation surveys of seat belt use, observation surveys of motorcycle PPE use are not
 common, and the methodology for such surveys is not well established.

 This study sought to develop a methodology for an observation survey of motorcycle PPE that would be
 resource-efficient, valid, and adaptable to any jurisdiction. The design was implemented in Florida, with two
 rounds of data collection. The survey used a probability-based sample of road segments stratified by four State
 regions and road types, including roads classified as motorcycle “Best Rides.” The sample selected road segments
 per probability proportional to size (PPS), with the length of road segment as the measure of size. The first round
 resulted in 841 motorcyclists observed, with a 43% mean use rate of USDOT-certified helmets, and a standard
 error of 17%. The second round of data collection adjusted the sampling by using an equal probability sample of
 road segments, not PPS. The second-round results resulted in 873 motorcyclists observed, with a 61% mean use
 rate of USDOT-certified helmets, and a reduced standard error of 7.7%.

 The results suggest that it is crucial to oversample road segments that are likely to have higher rates of
 motorcycle traffic, such as the “Best Rides” stratum. In addition, oversampling arterial road segments may
 increase sample yields. Results also showed that selecting road segments per probability proportional to size
 (PPS) - when the measure of size is road segment length - was not efficient for motorcycle observations. A more
 efficient measure of size for motorcycle traffic is likely to be motorcycle volume at the road segment level.
 Otherwise, selecting road segments per equal probability, as opposed to PPS, may increase sample yield.

 17. Key Words 18. Distribution Statement
 Motorcycle, safety gear, observation survey, helmet, The document is available to the public through the
 motorcycle personal protective equipment National Technical Information Service, www.ntis.gov.
 19. Security Classification of this report 20. Security Classification of this page 21. No. of Pages 22. Price
 Unclassified Unclassified 57
Form DOT F 1700.7 (8-72) Reproduction of completed page authorized

 i
Acronyms

ART arterials
AVMT annual vehicle miles traveled
CI controlled intersection
CUTR Center for Urban Transportation Research
CV coefficient of variation
DVMT daily vehicle miles traveled
FARS Fatality Analysis Reporting System
FMVSS Federal Motor Vehicle Safety Standard
GIS geographic information systems
LAH limited access highway
LCI lower confidence interval
UCI upper confidence interval
LOC local roads
MOS measure of size
MSA Metropolitan Statistical Area
MT moving traffic
NCSA National Center for Statistics and Analysis
NOPUS National Occupant Protection Use Survey
NTSS-III National Travel Speed Survey III
NSUBS National Survey of the Use of Booster Seats
PPE personal protective equipment
PPS probability proportional to size
Region region of the State
RPA rural principle arterial
RSE relative standard error
SRS simple random sampling
STE standard error
TIGER Topologically Integrated Geographic Encoding and Referencing
UMA urban minor arterial
UPA urban principal arterial

 ii
Table of Contents

Executive Summary ...................................................................................................................... v
 Study Purpose ........................................................................................................................... v
 Design Considerations and Challenges ..................................................................................... v
 Method ...................................................................................................................................... v
 First Round of Data Collection .......................................................................................... vi
 Second Round of Data Collection..................................................................................... vii
 Results .................................................................................................................................... viii
Introduction ................................................................................................................................... 1
 Background ............................................................................................................................... 1
 Study Objectives ....................................................................................................................... 1
 Study Design ............................................................................................................................. 1
Round One of Data Collection ..................................................................................................... 3
 Methodology ............................................................................................................................. 3
 Sample Design and Scheduling .......................................................................................... 3
 Data Collection ................................................................................................................. 10
 Field Staff Recruitment and Hiring................................................................................... 10
 Analysis................................................................................................................................... 19
 Weighting.......................................................................................................................... 19
 Round One Findings ......................................................................................................... 21
 PPE Use ............................................................................................................................ 23
 Round One Performance and Limitations............................................................................... 23
Round Two of Data Collection................................................................................................... 24
 Methodology ........................................................................................................................... 24
 Sample Design and Scheduling ........................................................................................ 24
 Data Collection ................................................................................................................. 27
 Analysis................................................................................................................................... 27
 Weighting.......................................................................................................................... 27
 Findings............................................................................................................................. 29
Discussion..................................................................................................................................... 39
 Potential Methodology for States............................................................................................ 39
 State Specific Surveys....................................................................................................... 40
 Sample............................................................................................................................... 41
 Data Collection ................................................................................................................. 41
 Imputation, Weighting, Point and Variance Estimation ................................................... 42
 National Survey of PPE Use ............................................................................................. 44
 Lessons Learned...................................................................................................................... 45
References .................................................................................................................................... 46
Tables
Table 1. Definitions of codes in the road segment file ................................................................... 4
Table 2. Expected allocation of road segment sample, using road segment length only ............... 6

 iii
Table 3. Optimized road segment sample allocation ...................................................................... 7
Table 4. Expected Phase I road segment sample sizes ................................................................... 7
Table 5. Round One, Phase I road segment sample road type variables ........................................ 8
Table 6. Round One, Phase II actual road segment sample size by road type................................ 8
Table 7. Expected precision ............................................................................................................ 9
Table 8. Descriptive statistics for Round One moving traffic study base weights ....................... 20
Table 9. Sample design characteristics and observation sample sizes.......................................... 21
Table 10. Actual precision ............................................................................................................ 22
Table 11. Round One moving traffic survey results ..................................................................... 22
Table 12. Round One controlled intersection survey results for operators................................... 23
Table 13. Optimized road segment sample allocation .................................................................. 25
Table 14. Expected Phase I road segment sample sizes ............................................................... 25
Table 15. Round Two Phase I road segment sample road type variables..................................... 26
Table 16. Round Two Phase II actual road segment sample sizes by road type .......................... 26
Table 17. Expected sample design characteristics and observation sample sizes ........................ 27
Table 18. Expected precision ........................................................................................................ 27
Table 19. Round Two moving traffic survey, descriptive statistics base weights ........................ 28
Table 20. Actual sample design characteristics ............................................................................ 29
Table 21. Actual precision ............................................................................................................ 29
Table 22. Rounds One and Two moving traffic survey results on helmet use, operators and
 passengers ..................................................................................................................... 30
Table 23. Rounds One and Two moving traffic survey results on helmet use, operators only .... 31
Table 24. Rounds One and Two controlled intersection survey results, operators and passengers
 ...................................................................................................................................... 33
Table 25. Rounds One and Two controlled intersection survey results, operators only .............. 34
Table 26. Rounds One and Two use rate of PPE besides helmets, operators only....................... 35
Table 27. Rounds One and Two use rate of boots among operators, by motorcycle type, and
 region ............................................................................................................................ 35
Table 28. Rounds One and Two use rate of gloves among operators, by motorcycle type, and
 region ............................................................................................................................ 36
Table 29. Rounds One and Two use rate of jackets among operators, by motorcycle type and
 region ............................................................................................................................ 36
Table 30. Rounds One and Two use rate of pants among operators, motorcycle type and region37
Table 31. Rounds One and Two helmet use rate of helmets among operators, by PPE type ....... 37
Table 32. Rounds One and Two controlled intersection survey results of use rate of PPE,
 operators only ............................................................................................................... 38
Table 33. Estimate of labor hours for a State-based survey of PPE use ....................................... 43
Figures
Figure 1. Training slides for classifying helmet type. .................................................................. 11
Figure 2. High-visibility gear examples........................................................................................ 12
Figure 3. Field guide on motorcycles for data collection. ............................................................ 14
Figure 4. Moving traffic data collection form. ............................................................................. 16
Figure 5. Collection form for stopped motorcycles. ..................................................................... 18

 iv
Executive Summary
Motorcycle personal protective equipment (PPE) is an important traffic safety countermeasure
for motorcyclists. Lacking the protective enclosure of a passenger vehicle, the different types of
PPE, including a safety-certified helmet, impact and skid resistant jacket and pants, gloves, and
sturdy over-the ankle footwear, protect the motorcyclist from flying road debris while riding, and
most important, in the event of a crash. Safety gear characterized by high-visibility or
retroreflective materials can also be considered a type of, or part of PPE. Motorcyclists use any
combination of PPE, and sometimes none. A motorcycle helmet that meets the U.S. Department
of Transportation safety standard 1 is the most important element of PPE, as USDOT-certified
helmets are proven to reduce head injuries and save lives. Other PPE can also mitigate injuries
and save lives.
The National Highway Traffic Safety Administration, State Highway Safety Offices (SHSO),
and motorcycle safety groups conduct programs to encourage the use of motorcycle PPE. These
programs support NHTSA’s mission to save lives and reduce injuries, but their effectiveness is
not determined, largely because data on the use of PPE are not readily available.

Study Purpose
The purpose of this study was to develop a methodology for measuring the use of motorcycle
PPE that would be valid, efficient, and feasible in any jurisdiction. NHTSA publishes uniform
guidelines for observation surveys of seat belt use, but there are no uniform guidelines for
observation surveys of motorcyclists’ use of safety gear. The present study developed and
implemented an observation survey of motorcyclist PPE use, with the goal of identifying factors
involved in survey efficiency and validity, and that would be adaptable to any jurisdiction.
The methodology included a sampling plan, selection of sites, hiring and training of field staff,
data collection, data entry, and analysis. The design provided a probability-based estimate of
PPE use among motorcyclists. The approach incorporated considerations used in NHTSA’s
Uniform Criteria for State Observational Surveys of Seat Belt Use (23 CFR, Part 1340), to define
the sampling frame and target population exclusions (see also NHTSA, 2000).

Design Considerations and Challenges
The population of inference was all motorcyclists 2 (operators and passengers) riding on public
roadways in Florida. The target population, which in survey design reflects practical restrictions
and in this way, differs from the population of inference, was restricted to motorcyclists riding
during daylight hours, due to the challenges of making reliable nighttime observations.

Method
The target population was all motorcyclists (operators and passengers) riding on public roadways
in Florida during daylight hours. Florida was selected as the pilot State because it does not have a
universal helmet law (resulting in a variable helmet use rate), is geographically large, with over
500,000 registered motorcycles. In addition, a substantial percentage of motorcyclists killed in

1
 Federal Motor Vehicle Safety Standard (FMVSS) 218, Motorcycle helmets.
2
 The motorcycle rider is the person operating the motorcycle; the passenger is a person seated on, but not operating,
 the motorcycle; the motorcyclist is a general term referring to either the rider or passenger.

 v
traffic crashes in Florida were unhelmeted. Of note as well is Florida’s long riding season, which
allowed for greater flexibility in scheduling data collection.
In general, the survey design followed considerations used in meeting precision requirements in
NHTSA’s Uniform Criteria for State Observational Surveys of Seat Belt Use, including the
following: identifying population of inference; sampling frame and target population exclusions;
sample allocation and optimization; and the expected road segment and observation sample sizes
and precision (23 CFR Part 1340 and NHTSA, 2000). The design also employed a Fatality
Analysis Reporting System (FARS) 3 criterion, which pointed to the inclusion of 27 counties that
had accounted for at least 85% of FARS motorcycle fatalities across a 5-year 4 period from 2011
to 2015. To increase efficiency in data collection, the counties were grouped into four regions,
based on their geographic distribution.
The U.S. Census Bureau’s Topologically Integrated Geographic Encoding and Referencing,
called “TIGER” data, were used as the primary source of the road segment sampling frame. The
road type included three levels: limited access highways (LAH), arterials (ART), and (non-rural)
local roads (LOC). Sampling exclusion rules were applied to improve the efficiency of the
observation period (sample yield) by allocating sample locations to places expected to have
higher yields of motorcycles. For example, rural local roads, as defined by criteria in the Census
Bureau’s Metropolitan Statistical Area, were excluded, as were non-public roads, unnamed
roads, unpaved roads, vehicular trails, access ramps, cul-de-sacs, traffic circles, and service
drives.
In addition, the sample included a “Best Rides” stratum consisting of road segments that
coincided with popular motorcycle routes. Prior to sample selection, the road segments were
stratified by into two levels (Best Rides, and all other road types combined) and sorted in the
following order: by region, county, detailed road type, and a geo-spatial sort.
There were two rounds of data collection. Round One was conducted in May 2017 and Round
Two was conducted in May 2018. The road segments were stratified by road type into four levels
(“Best Rides,” LAH, ART, LOC) and sorted by region, county, detailed road type, and a spatial
sort such that adjacent road segments on the same road were sequential in the list frame. In
Round One, road segments were selected per probability proportional to size, where the measure
of size was a function of road segment length. For Round Two, road segments were selected per
equal probability (not PPS).

First Round of Data Collection
Data were collected from 288 selected road segments, on both weekdays and weekends
throughout daylight hours when visibility was best. This included rush hour and non-rush hour
time periods. Weekday rush hours are defined as 7 a.m. to 9:30 a.m. and 3:30 p.m. to 6 p.m.,
while weekday non-rush hours comprise all other weekday data collection hours (9:30 a.m. to
3:30 p.m.). All weekend times are considered non-rush hours.

3
 The Fatality Analysis Reporting System (FARS) is a nationwide census of fatal injuries suffered in motor vehicle
 traffic crashes (NHTSA, 2014). See NHTSA’s brochure on FARS at https://crashstats.nhtsa.dot.gov/Api
 /Public/ViewPublication/811992).
4
 A 5-year period is used to smooth out the year-to-year variation in the numbers of this relatively rare event.

 vi
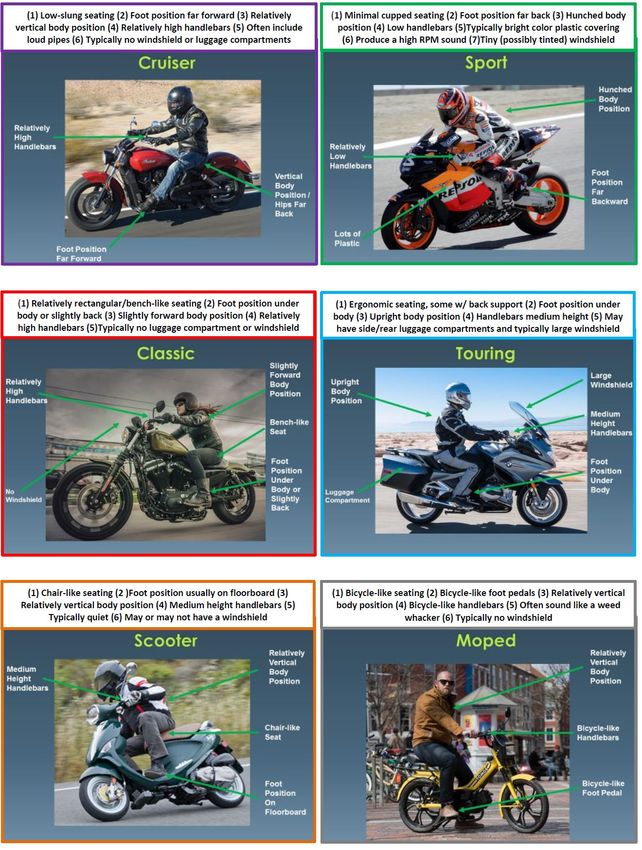
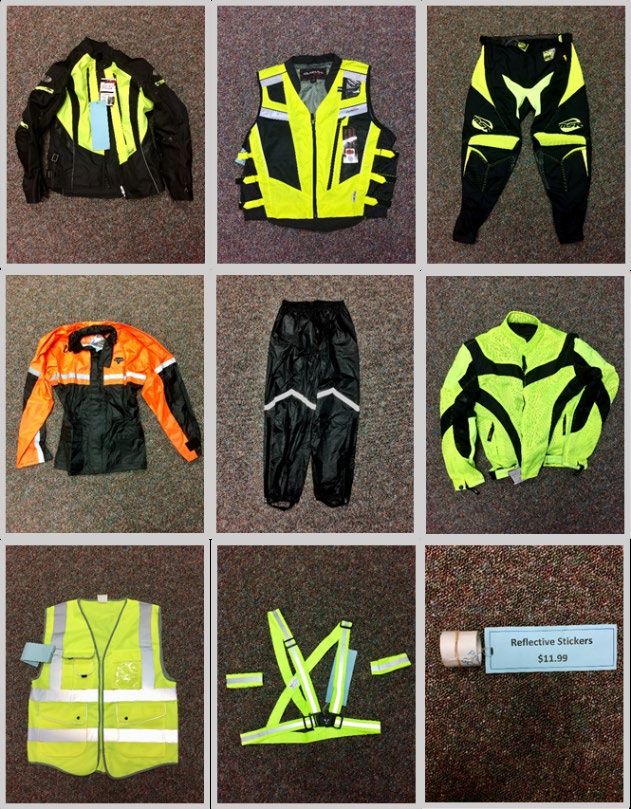
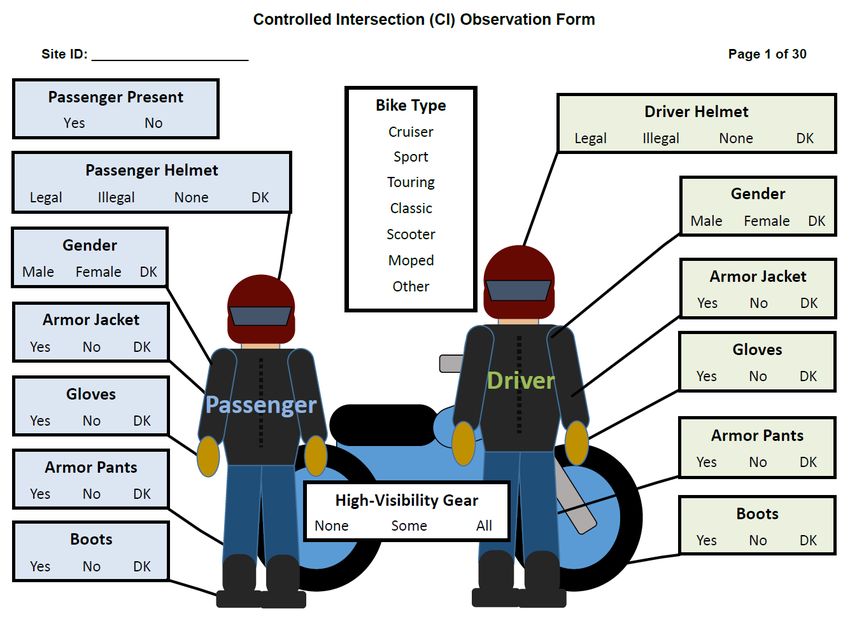
At each site, data collectors observed motorcyclist PPE use for both moving motorcyclists and
stopped motorcyclists. Observing stopped motorcycles enabled data collectors to record more
details related to PPE other than DOT-compliant helmet use, including the use of gloves, boots,
riding pants and jacket, and high-visibility characteristics. High-visibility gear is defined in this
report as clothing or equipment with highly reflective properties or colors that can be easily
distinguished from any background. The fabric must be bright colors, typically fluorescent or
neon yellow, green, or orange. High-visibility gear may also have retroreflective stripes or piping
which make the rider more visible to other road users. In addition, traffic counts were completed
at all sites as a means for obtaining roadway volume data needed to estimate weights and PPE
use. Data were cleaned and weighted to allow for unbiased estimation.
Round One captured 741 motorcycle observations and 841 motorcyclists (operators and
passengers combined) observations. The road segments which yielded the highest number of
observations were the “Best Rides” and the arterials. Overall, the DOT-compliant helmet use rate
was estimated to be 43.03% among all motorcyclists and 44.79% among operators. The 95%
confidence interval was 15.02% to 76.34%. The correlation between operator and passenger
DOT-compliant helmet use was 94.66% in Round One, indicating a helmeted operator was likely
to have a helmeted passenger; similarly, an unhelmeted operator was likely to have an
unhelmeted passenger. PPE use rates for other types of safety gear were low for operators;
protective boots were observed most frequently (worn by 7.17% of operators), followed by
gloves (worn by 6.34% of operators) and by armored jackets and pants (worn in 1% of
operators).
Round One results indicated the sample design and study protocol, in terms of the stratification
by region, road type (“Best Rides” and all other roads combined) were largely successful in
meeting survey goals with respect to the total number of observations, and number of
observations by road type). However, results also revealed a large variation in the standard error,
which was addressed in Round Two.

Second Round of Data Collection
The methodology for Round Two included design factors from Round One that were deemed
effective; these factors included the stratification by region and road types (consisting of
“Best Rides” and all other road types combined), but with adjustments to the way road segments
were selected. Road segments in Round Two were selected with an equal probability within
stratum, to increase the precision of the measures, whereas in Round One, segments were
selected per PPS.
Round Two resulted in 773 motorcycles observed, 873 motorcyclists (operators and passengers
combined) observed, and a mean helmet use rate of 60.90% with a confidence interval of 44.8%
to 74.9%. The change in design did not negatively affect the yield, and DOT-compliant helmet
use rate was observed to be 60.90% among all motorcyclists, and 60.55% among all operators.
The correlation between operators and passenger DOT-compliant helmet use was 92.27%. The
adjustment to the sampling approach decreased the standard error compared to Round One by 10
percentage points for all motorcyclists and operators only. Although the estimated use rates
appear higher for Round Two, there is no statistically significant difference between the Round
One and Round Two estimates, as the uncertainty in the Round One estimate is larger.

 vii
Results
The results from Rounds One and Two suggest the following proposed approach for observation
probability sample surveys of motorcycle PPE use. First, to record observations efficiently, it is
crucial to oversample road segments likely to have higher rates of motorcycle traffic (like the
“Best Rides” stratum). Second, oversampling arterial road segments helps increase yields.
Probability proportional to size sample designs may not be efficient for targeting this population,
unless the appropriate measures of size are available (like motorcycle volume at the road
segment level), in which case equal probability within stratum design should be considered.
Large increases in observations can probably only be achieved through large increases in road
segment sample sizes. Third, excluding local roads from the sample locations could dramatically
increase overall observation yields.

 viii
Introduction
Background
Motorcycle personal protective equipment, also known as safety gear, is an important traffic
safety countermeasure. Designed to protect a motorcyclist in a crash, and from flying road
debris, PPE includes a safety-certified helmet, impact and skid-resistant jacket and pants, safety
gloves, and over-the-ankle boots. Motorcyclists may use any combination of these, or none.
Helmets that meet the USDOT safety standard are the most effective type of PPE, as they are
proven to save lives. 5 NHTSA estimates in 2017 helmets saved the lives of 1,872 motorcyclists 6
and if all motorcyclists who had crashed had worn USDOT-certified helmets, 749 more lives
could have been saved (National Center for Statistics and Analysis, 2019a). NHTSA, SHSOs,
and motorcycle safety advocates sponsor or deploy programs to encourage motorcyclists to use
PPE every ride; these efforts are particularly relevant in States that do not have universal helmet
laws. However, the impact of these programs is not well understood, largely because data on the
extent of PPE use are not readily available.
The goal of this study was to develop and evaluate an observation survey of motorcycle PPE
would be reliable, efficient, and valid in any jurisdiction. Valuable data on PPE use from the
perspective of State motorcycle safety programs would be collected in State observation surveys.
This study sought to develop a survey design that would be feasible in any jurisdiction.

Study Objectives
The purpose of this study was to develop and implement an observation survey to generate a
probability-based estimate of PPE use by motorcyclists. The study produced a sampling plan,
data collection protocol and materials, training materials for data collectors, survey data, and this
report. The sampling and data collection methodology built upon data collection protocols used
in other State observation surveys and from the guidelines in NHTSA’s Uniform Criteria for
State Observational Surveys of Seat Belt Use.

Study Design
Florida was selected to pilot the survey due to its long riding season, large population of
registered motorcycles, and partial helmet law (which results in helmet use rates that likely vary
across the State). For example, in 2014 there were over 500,000 registered motorcycles in
Florida, and approximately 46% of the State’s motorcyclists’ fatalities were unhelmeted.
The study used two rounds of data collection, which provided the opportunity to adjust the
survey design from the first to the second rounds if necessary. The results were reviewed for
efficiency, validity, and feasibility in terms of the selection of sites, hiring and training of field
staff, data collection, and data entry and analysis.
Data collection occurred on weekdays and weekends during daylight hours and included rush
hour and non-rush hour time periods. Weekday rush hours are defined as 7 a.m. to 9:30 a.m. and

5
 Motorcycle helmets sold in the United States are required to meet Federal Motor Vehicle Safety Standard 218,
motorcycle helmets.
6
 The rider is the person operating the motorcycle; the passenger is a person seated on, but not operating, the
motorcycle; the term “motorcyclist” refers to a rider or passenger.

 1
3:30 p.m. to 6 p.m. All weekend times are considered non-rush hours. Data collection occurred
on surface streets and limited access highways when motorcycles were in motion or were
stopped at controlled intersections, either by a stop sign or stop light. There were two protocols
for data collection, one for the moving motorcycles on LAH, and one for the stopped
motorcycles at intersections. At each site, data were first collected by observing moving traffic,
followed by a traffic count, and then observations of stopped traffic at controlled intersections.
Observations were only made of motorcycles and motorcyclists (which includes drivers, who
operate the motorcycle, and passengers), whereas all vehicles (cars, truck, motorcycles, and
others) were counted during the traffic count. The function of the traffic count was to provide
roadway volume data for weighting and estimating purposes. Survey methodology is discussed
in more detail in the sections below.
In each region, all sites were mapped and clustered geographically. Regions were defined as
groups of counties that were in close geographic proximity to each other. Clusters of sites were
randomly assigned to days of the week with each cluster representing one day of work. Within a
cluster, sites were assigned to a data collection day in the same random manner to represent both
weekday and weekend travel. The last step involved randomly choosing the start time for the
sites on the assigned day of data collection.
The data collectors used paper forms to record observational data. Given this observation survey
is in its infancy and there was likely to be several revisions to the data collection instrument, it
was more efficient and cost effective to develop and revise paper instruments. Additionally, it
may be more economical for States to reproduce paper forms than it would be to develop
electronic data collection methods, such as computer tablets.
Data were collected by pairs of data collectors, with one serving as a spotter and the other as the
data recorder. All field staff attended a 2-day training session that provided an overview of the
survey methodology and training on data collection protocol; scheduling and rescheduling sites;
identifying site locations; completing the data collection form; submitting collected data; safety
and security procedures; administrative and timekeeping procedures; quality assurance
procedures; and field practice.
Data collectors were trained to identify and record DOT-compliant and novelty helmets, to
identify and record the presence of other PPE, and to indicate whether the riders were using
high-visibility gear. All data collectors were required to take a quiz to ensure they understood the
survey terminology, protocol, and reporting requirements.
Since the observational data of PPE use were obtained from a probability sample, data weighting
was required for unbiased estimation. The weights reflected the overall probability of selection,
variabilities in the probabilities of selection, adjustments for imputation and nonresponse, and
adjustments to population or frame totals. Estimates of PPE use for each round of data collection
were created by applying the final adjusted full sample weight to the relevant study variables.
The complete study design and methodology are discussed in the following chapter.

 2
Round One of Data Collection
Methodology
The following sections describe the sampling plan and data collection protocol. The sampling
plan and methodology followed similar considerations used for determining the precision
requirement in NHTSA’s Uniform Criteria for State Observational Surveys of Seat Belt Use.
These considerations were applied to the sample design characteristics: the population of
inference; sampling frame and target population exclusions; sample allocation and optimization;
and the expected road segment and observation sample sizes and precision.

Sample Design and Scheduling
Round One of the pilot study used a stratified, single stage, two-phase probability sample of road
segments. Road segments are the only stage of selection, and were selected within regions. The
division of the sample into regions was useful for managing and assigning the data collection
workload. However, region is not itself a stage of selection. The two phases refer to the review of
road segments for study eligibility and reclassification of road type, if necessary, for sample
selection. The road segments were selected with PPS, where the MOS was a function of road
segment length. The planned sample size included 288 road segments in 27 counties, and for a
yield of approximately 592 observations (i.e., motorcycles observed). The total number of
motorcyclists observed was expected to be slightly higher, since some motorcycles will have
both an operator and a passenger.

Population of Inference and Target Population
The population of inference is all motorcyclists (operators and passengers) riding on public
roadways in Florida. A motorcycle was defined as an on-road, two- or three-wheeled motor
vehicle designed to transport one or two people, including scooters, minibikes and mopeds. The
target population observed was restricted to motorcyclists riding during daylight hours. Public
roadways were defined as all LAH, ART and LOC in Florida, subject to the target population
exclusions listed in the section below.

Sampling Frame and Target Population Exclusions
Like the protocols for NHTSA’s NOPUS, national roadside surveys, and State observation
motorcycle surveys, all motorcycles traveling on a selected road segment during an assigned
observation period were observed. While some States may have alternative road databases, with
more detailed road type classifications, the goal of this work was to develop a plan that would be
accessible to all States, not just those with specialized frames. As such, the U.S. Census Bureau’s
TIGER data were the primary source of the road segment sampling frame, subject to some
exclusions, discussed below.
TIGER road segments are classified by the U.S .Census Bureau using the Master Address File
and TIGER. Using the MAF/TIGER Feature Classification Code (MTFCC), there are three
major road type classifications: (1) Primary Roads (or Limited Access Highway), (2) Secondary
Roads (or Arterials), and (3) Local Roads. Table 1 shows the codes and definitions for the road
segments used in the sampling plan.

 3
Table 1. Definitions of codes in the road segment file
 Code Name Definition
 Primary roads are generally divided, limited-access highways within the
 interstate highway system or under State management, and are
 S1100 Primary Road /LAH
 distinguished by the presence of interchanges. These highways are
 accessible by ramps and may include some toll highways.
 Secondary roads are main arteries, usually in the U.S. Highway, State
 Highway, or County Highway system. These roads have one or more
 S1200 Secondary Road/ART lanes of traffic in each direction, may or may not be divided, and usually
 have at-grade intersections with many other roads and driveways, and
 often have both a local name and a route number.

 Generally, these are paved non-arterial streets, roads, or byways that
 Local Neighborhood
 usually have a single lane of traffic in each direction. They may be
 S1400 Road, Rural Road,
 privately or publicly maintained. Scenic park roads would be included,
 City Street/LOC
 as would (depending on the region of the country) some unpaved roads.

The final road segment sampling frame included all eligible TIGER road segments, after
applying the following exclusion criteria:
 • Restricting the target population to a subset of counties that account for at least 85% of
 FARS motorcycle fatalities within the State across a 5-year 7 period (2011 to 2015). This
 exclusion improves the efficiency of observations. It involved the rank ordering of the
 counties in descending order of fatalities, and selecting the top counties that summed to
 more than 85% resulted in an initial list of 25 of Florida’s 67 counties. As allowed per the
 Final Rule for NHTSA’s Uniform Criteria for State Observational Surveys of Seat Belt
 Use, Marion County was exchanged for Okaloosa, Santa Rosa, and Walton counties, to
 maintain the ≥ 85% threshold and create four distinct regions for data collection within
 the State. Four distinct regions were preferable from an operations point of view. The
 result was a final list of 27 counties.
 • Excluding rural local roads in non-MSA counties, 8 based on the Census Bureau’s July
 2015 MSA definitions. This exclusion also makes the required observation study more
 efficient, by allocating the sample in places with higher expected yields.
 • Excluding non-public roads, unnamed roads, unpaved roads, vehicular trails, access
 ramps, cul-de-sacs, traffic circles, and service drives. This exclusion limits observations
 to motorcycles on public roads and routine passenger vehicle traffic.
The exclusions described above are identical to those permitted under NHTSA’s Final Rule for
the Uniform Criteria for State Observational Surveys of Seat Belt Use.
The TIGER road segment sample was then overlaid with a list of Florida’s popular motorcycle
riding routes 9 using Geographic Information System coordinates. Road segments appearing on
the popular riding routes list were flagged for oversampling. Road segments otherwise subject to

7
 A 5-year period is used to smooth out the year-to-year variation in the numbers of this relatively rare event.
8
 See www.census.gov/geographies/reference-files/time-series/demo/metro-micro/delineation-files.html.
9
 www.motorcycleroads.com/Routes/Florida_85.html, www.openroadjourney.com/rides-and-roads/florida, and
 www.motorcycleroads.us/states/fl.html.

 4
the road segment level exclusions listed above were nonetheless included if they appeared on
popular riding lists.

Cost and Precision
To plan for reasonable cost and precision of sampling, prior survey data were used to inform
sample size calculations including estimates of helmet use rate and the expected incidence of
motorcycles in the flow of motor vehicle traffic. A 2013 observation survey of motorcycle
helmet use in Florida found an overall use rate of 51% (no standard error or confidence intervals
were provided) (Lett, Lin, & Schultz, 2013). The 2013 survey used 12 observation sites, with
observation periods one hour long, in the “top 10” highest motorcycle fatality “hotspots”
counties, based on FARS data, plus two additional counties for historical comparison. A total of
486 observation sites were selected with ArcInfo types, urban principal arterial, urban minor
arterial, or rural principle arterial(UPA, UMA, and RPA), all of which appear to align with the
TIGER road classification of S1200/arterials, with 1-hour-long observation periods. Observation
days were on Friday, Saturday, and Sunday. Total observations were of 8,404 operators and
1,271 passengers. The 2013 Florida study is a relevant resource for making sample design
assumptions, such as overall helmet use rates, but given the time that has elapsed since 2013, and
differences in the survey coverage of geographic area, road types, and days of week observed,
comparisons between the 2013 Florida study and either round of this pilot study must be
considered with caution. Based on the 2013 survey results, the present study assumed a State
helmet use rate of 50%.
The rate of flow of motorcycles was another key unknown in planning a sample size necessary
for reasonable precision; it is important but difficult to estimate, given the relative rarity of
motorcycles in traffic. While the 2013 survey was limited to Fridays, Saturdays and Sundays,
when motorcycle traffic was expected to be higher, 10 the methodology for the present study did
not limit data collection by the day of week, so it sought a different rate estimate for planning
purposes.
A rough estimate of the rate of flow of motorcycles for this study was based instead on National
NOPUS data, pooling the 2014 and 2015 Moving Traffic study data. In 2014 the NOPUS
observed 684 motorcycles at 1,581 eligible sites, and in 2015 NOPUS observed 851 motorcycles
at 1,901 sites, meaning that approximately 0.44 motorcycles were observed at each site (Pickrell
& Li, 2016). Multiplying the rate of flow from the 2013 Florida report (0.288 motorcycles per
minute) by the planned 40-minute observation period 11 for the present study, implies 11.5
motorcycles per site, which is much higher. Because the design did not restrict data collection
sites to higher-volume days of the week or selected road types only, the true yield per site is
likely to be closer to the NOPUS-based estimate, than to the 2013 survey report-based estimate.
However, by tailoring the sample design to maximize yield, the present study could improve on
the NOPUS-based estimate, resulting in an expected average yield per site of 2.055 motorcycles.

Stratification and Stages of Selection
The FARS criterion pointed to inclusion of 27 Florida counties; given their geographic
distribution, it was operationally efficient to group the 27 counties into the four regions, and

10
 The rate of flow in this instance and from the report is 0.288 motorcycles per minute.
11
 A 40-minute period was selected as sufficient time for observing without incurring observer fatigue.

 5
assign one data collection team (consisting of two team members) to each region. Since the
included counties within each region were geographically close, it was decided that the sampling
of counties within region was unnecessary, and instead, a stratified, single stage sample of road
segments was used. The road segments were stratified by region and road type, and selected PPS
to length with specific target sample sizes by road type stratum. For Round One, prior to sample
selection, the road segments were stratified by into two levels: Best Rides, and all other road
types combined, and sorted by region, county, detailed road type, and a geo-spatial sort. The Best
Rides stratum included all road segments that coincided via a geo-spatial overlay with popular
motorcycle riding routes listed on motorcycle riding websites.
Helmet use rates, like seat belt use rates, vary by road type; therefore, stratification by road type
reduces the variance of use estimates. For example, in 2019, NOPUS reported a helmet use rate
of 69.3% on surface streets (local roads and arterials) versus a rate of 73.7% on limited access
highways. We also have evidence from NOPUS that helmet use rates are lower for traffic
moving less than 30 mph (64.1% in 2019) versus traffic moving faster than 50 mph (72.1% in
2019), roughly corresponding to differences in speed on many of the local and arterial roads
sampled.
Stratification also allows us to explicitly control the number of road segments of each road type
included in the sample. Because the most road segments in the population are local roads, simple
random sampling or non-stratified PPS sampling would result in a sample consisting of mostly
local roads. Our experience on NOPUS is that local roads tend to have lower traffic volume (and
thus carry fewer motorcycles) than arterial roads or limited access highways. Stratification is an
effective way to limit the number of local road sites, maximizing sample yield (and thus sample
efficiency) without negatively impacting variances. The allocation of road segments to strata and
optimization is described in the following section.

Road Segment MOS, Allocation, and Optimization
As with most recent road segment samples selected from TIGER, the initial consideration was to
use a very basic allocation: fixed 40-road segments allocated to the “Best Rides” stratum, and
strictly PPS to road segment length for all other strata. See Table 2 for the expected sample
distribution by road type under this allocation.

 Table 2. Expected allocation of road segment sample, using road segment length only

 Road type Road segment sample size

 “Best Rides” 40

 Limited Access Highway (LAH) 5

 Arterials (ART) 22

 Local Roads (LOC) 221

 Total 288

As can be seen in Table 2, a large share of the total road segment sample (221/288 road
segments) was assigned to local roads (Code S1400). This outcome was not acceptable from an
operational or a statistical point of view, given the low expected rates of flow of motorcycles on

 6
local roads. To optimize the sample allocation of 288 road segments across road type, a
mathematical programming approach was used to minimize the overall estimate variance while
restraining the overall cost to be less than or equal to a pre-set maximum. The total number of
“Best Rides” road segments was again fixed at 40. Table 3 presents the results of that allocation.

 Table 3. Optimized road segment sample allocation

 Road type Road segment sample size
 “Best Rides” 40

 Limited Access Highway (LAH) 25

 Arterials (ART) 79

 Local Roads (LOC) 144

 Total 288

Road Type Misclassification and Two-Phase Sampling
Recent experience using TIGER as a road segment sampling frame for NOPUS and the National
Travel Speed Survey III (NTSS-III; De Leonardis et al., 2018) suggests that TIGER’s road
coverage is very good, while its road type classification is at times inaccurate (Ariola et al.,
2017). A two-phase sampling approach was used to account for this limitation. In Phase I, a
somewhat larger than necessary sample was selected, and then manually reviewed to verify and
correct the road type classification when necessary. The Phase II sample was selected from the
revised Phase I road segments, so it was distributed as desired with respect to the revised road
type.
The required size of the Phase I sample and the Phase I road type stratum sampling rates were
estimated by consulting the TomTom database, and overlaying it with the TIGER road segment
sampling frame using GIS coordinates, producing a cross-classification (or misclassification)
table for the entire frame. A linear programming approach was used to solve the road type
stratum sampling rates, that when applied to the TIGER road type variable, would be expected to
give the desired road type distribution per the TomTom road type classifications. After these
sampling rates were obtained, the road segment measures of size (TIGER road segment length)
by road type were adjusted to produce the desired sample sizes, and an inflation factor of 10%
was applied to the overall sample size to protect against additional inaccuracies. The expected
Phase I sample sizes by TIGER road type strata are presented in Table 4.

 Table 4. Expected Phase I road segment sample sizes

 Road type Road segment sample size
 Best Rides 40

 Limited Access Highway (LAH) 26.4

 Arterials (ART) 132.5

 7
Road type Road segment sample size

 Local Roads (LOC) 117.84

 Total 316.74

Prior to sample selection, the road segments were stratified by road type (two levels: “Best
Rides” and all other road types combined (LAH, ART, LOC)) and sorted in the following order:
by region, county, detailed road type (LAH, ART, LOC), and a spatial sort such that adjacent
road segments on the same road were sequential in the list frame. Once the Phase I sample was
selected, the TIGER road type was reviewed and revised through an assessment using GIS
overlays with TomTom and OpenStreetMap, and their respective road type variables (see Table
5). The revised road type was used for stratification of the Phase II sample. A Phase II sample
was drawn from the Phase I road segments with equal probability, such that the sample sizes by
road type shown in Table 6 were achieved.

 Table 5. Round One, Phase I road segment sample road type variables

 “Best Rides” TIGER Road Type Revised Road Type Frequency Percent

 No S1100 (LAH) LAH 23 7.28

 No S1200 (ART) ART 125 39.56

 No S1200 (ART) LAH 14 4.43

 No S1200 (ART) LOC 1 0.32

 No S1400 (LOC) ART 14 4.43

 No S1400 (LOC) LOC 88 27.85

 No S1400 (LOC) NA 11 3.48

 Yes S1200 (ART) ART 35 11.08

 Yes S1400 (LOC) ART 5 1.58

 Table 6. Round One, Phase II actual road segment sample size by road type

 Road type Road segment sample size

 “Best Rides” 40

 Limited Access Highway (LAH) 33

 Arterials (ART) 131

 Local Roads (LOC) 84

 Total 288

 8
Prior to sample selection, the road segments were stratified by road type (two levels: “Best
Rides,” and all other road types (based on the Phase I improved road type) combined (LAH,
ART, LOC)) and sorted by region, county, Phase I revised detailed road type (LAH, ART,
LOC), and a spatial sort such that adjacent road segments on the same road were sequential in
the list frame.

Expected Overall Road Segment, Observation Sample Sizes, and Precision
Assuming approximately 2.055 observed motorcycles per site, the two-phase sample of 288 road
segments was expected to produce an estimated 592 observations, and assuming a mean helmet
use rate of 50%, a confidence interval of 46% to 54%, as seen in Table 7. Table 7 also provides
the expected variance, standard error, and relative standard error. Note that these estimates
assume simple random sampling; since this study is using a clustered design and PPS sampling,
we expect the true variances to be somewhat larger (and therefore wider confidence intervals as
well). These precision estimates are only for Round One in the MT survey. The precision of
estimates can be increased by either combining the data from the first and second rounds of data
collection, or by combining the moving traffic and controlled intersection data, or possibly both.

 Table 7. Expected precision

 P n Variance Standard Error RSE LCI UCI

 50.00% 592 0.00042 0.02055 4.11% 45.97% 54.03%

Note: Assumes SRS and 2.055 motorcycles per site observed.
 Where:
 P = the estimated helmet use rate
 n = the expected observation sample size
 Variance = the sampling variance on the estimate p of P
 Standard error = the standard error on the estimate p
 RSE = the relative standard error = Ste / p
 LCI = the lower confidence interval end point
 UCI = the upper confidence interval end point

Scheduling
Within each region, selected sites located within relatively close geographic proximity to each
other were assigned to data collection clusters and scheduled accordingly. The first site within
each cluster was assigned a random day and time for completion. All other sites within the
cluster were assigned to the same day to minimize travel costs. Daily start times for data
collection alternated from 7 a.m. to 8 a.m.. Additionally, sites were scheduled for weekdays and
weekend days to capture recreational motorcyclists and those who use the motorcycle as their
primary vehicle.
The schedules were transferred from a GIS database to a Microsoft Access database to allow for
printing of the daily data collection schedules. The schedule identified each site, the day and time

 9
of data collection, the type of study to be conducted (moving traffic or controlled intersection),
the flow (direction) of traffic, the ramps to use for a limited access highway site, and the
observed and intersecting roads. Data collectors were instructed to complete their observations of
motorcyclists at the controlled intersection immediately after they conducted the moving traffic
study and completed the traffic counts for the site. Each data collector received a schedule for
their assigned sites and the quality control monitor received schedules for all 288 sites. On
occasion, there was a need to reschedule data collection, in cases of bad weather, road
construction, or temporary road closures. Make-up data collection was made on the same type of
day (weekday or weekend) and time of day as the original assignment for the site.
In addition to the schedule, data collectors received computer-generated maps identifying the
locations of all their assigned data collection sites, and the QC monitor was supplied with a
complete set of maps for all four regions. The maps showed the sites by day of data collection. In
addition, Google Navigation links for each site were emailed to the data collectors. Using their
mobile phones or other navigation systems, data collectors could select their assigned sites on
their devices, which would then link to a navigation application and provide turn-by-turn
directions to the Observed Road and Intersecting Road.

Data Collection

Field Staff Recruitment and Hiring
There were eight data collectors who worked in teams of two, two back-up data collectors, and
one QC monitor hired. The field staff had participated successfully in previous NOPUS and
NSUBS studies; and therefore, were familiar with roadside observational studies and data
collection protocols.
The data collectors were screened to ensure they would be available for the training and data
collection periods, had a valid driver's license, access to reliable, insured transportation,
possessed the required employment qualifications, and passed an employment background
screening. All candidates were required to be able to read maps and navigate to unfamiliar
locations, work for up to 12 hours a day, and stand outdoors for up to 90 minutes at a time with
reasonable accommodations.

Training
Field staff (the data collectors, back-up data collectors, and QC monitor) were required to attend
2 full days of training in Orlando, Florida, on May 3 to 4, 2017. The training reviewed the
technical and administrative protocols required to complete the data collection tasks, and each
received a copy of the training manual with the training materials and briefing slides. The
following topics were covered during training and in the manual:
 • Overview and purpose of the survey;
 • Instructions on using the maps, Google Navigation and the site schedules;
 • Description of the procedures for observing motorcycles in moving traffic on
 surface streets and limited access highways;
 • Description of the procedures for the observing stopped motorcycles at controlled
 intersections on surface streets and LAH ramps;

 10
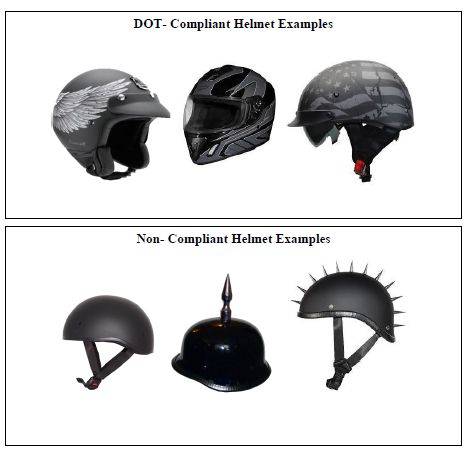
• Identifying the different motorcycle types and the other data collection variables;
 • Completing the data collection booklet;
 • Instructions for sending data to study headquarters; and
 • Administrative procedures.
In addition to classroom instruction, the staff participated in field training to practice identifying
the proper data collection locations and recording observations of motorcycle PPE use by
motorcycle operators and passengers. Given this was an observation study of moving traffic, data
collectors were trained to identify and record DOT-compliant and novelty helmets based on
differences in their physical characteristics. This training enabled data collectors to make
informed decisions without having the ability to inspect the helmets up close (or physically test
helmets against the DOT standards before they identified a helmet as DOT compliant).
Instructors outlined the physical characteristics of a DOT-compliant helmet; including coverage
that shields the motorcyclist’s head and ears, bulky appearance due to a thick inner lining,
substantial chin straps and strap anchors, and a visible DOT-compliant sticker. Conversely,
novelty helmets only cover the top of the rider’s head, do not shield the motorcyclist’s head or
ears, are less bulky due to a thin padding or lining, have flimsy chin straps and strap anchors, and
do not have a visible DOT-compliant sticker. When identifying the helmet type, data collectors
were instructed to rely more on the physical appearance of the helmet and not the presence of the
DOT-complaint sticker since these stickers can be fake. Data collectors were shown examples of
DOT-compliant and novelty helmets to learn how to distinguish between the two helmet types.
See Figure 1 for an example of the training slides on DOT-compliant and novelty helmets.

 Figure 1. Training slides for classifying helmet type.

 11
You can also read