Pilot Survey Report on Caribbean Students' and Researchers' Perceptions of the European Higher Education Area
←
→
Page content transcription
If your browser does not render page correctly, please read the page content below

Pilot Survey Report on Caribbean
Students’ and Researchers’ Perceptions
of the European Higher Education Area
Pilot Survey. Report on Caribbean Students’ and Researchers’ Perceptions of the
European Higher Education Area

Edited by Matteo Sgarzi (AlmaLaurea Consortium)

Index

1.   AIM OF THE SURVEY                                                                 2

2.   METHOD                                                                            2

2.1. Main features                                                                     2

2.3. Questionnaire design                                                              3

2.4. Survey administration                                                             3

2.5. Activities timeframe                                                              4

3.   RESULTS                                                                           5

3.1. Sample size and coverage                                                          5

3.2. Aggregate Results – Student Survey                                               12
   3.2.1 Student Survey – Focus on Jamaica, Dominican Republic, Trinidad and Tobago   23
   3.2.2. Student Survey – Focus on Parents’ Education level                          24

3.3. Aggregate results – Researcher Survey                                            26

4.   CONCLUSIONS                                                                      34

APPENDIX                                                                              35

                                                                                       1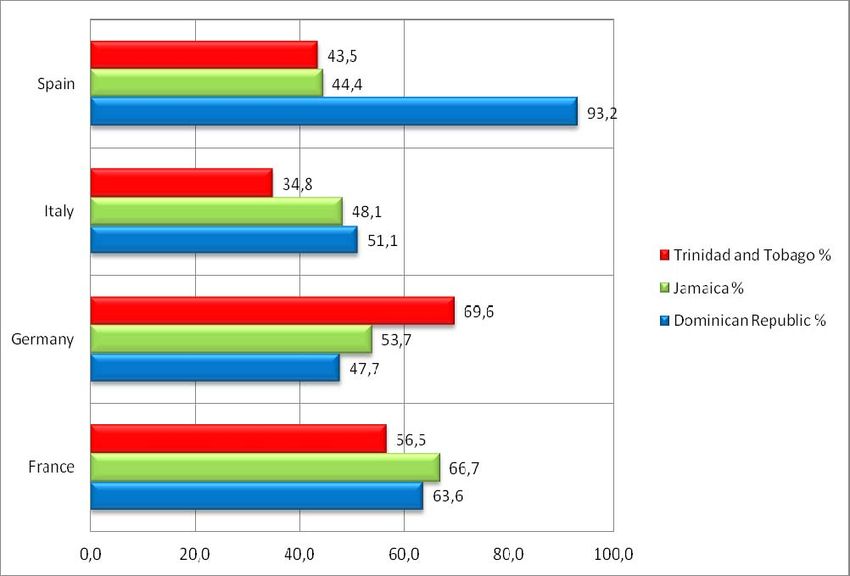
1. Aim of the Survey

This note aims at summing up the various activities carried out in order to realize the
CaribErasmus survey, focused on a group of students and researchers belonging to Caribbean
universities. The aim of the survey was to add value to the other project activities aiming to spread
EHEA awareness in the area (networking and events organization in the Caribbean, Web
communication and promotion) and provide a tangible information output. Partners agreed to
administer in their academic contexts two questionnaires that could have a positive impact on the
development of more attentiveness towards mobility and cooperation opportunities with Europe
and specifically towards the Erasmus Mundus programme.
Preparatory activities identified a Survey Model aiming to “evaluate” participants’ perceptions,
operational and organizational aspects through the involvement of students and researchers. The
choice of universities and target groups in the different countries has been left to local partners,
who adopted a “proximity approach”, namely informing their personal networks about the
initiative and sensitizing teachers and researchers in their own institutions.

   2. Method

2.1. Main features
AlmaLaurea coordinated the survey design task in cooperation with the Caribbean partners and
the project coordinator. Preliminary inputs were collected and discussed: the survey had to target
Caribbean students and researchers who had some interest in studying abroad; it had to track
their expectations and intentions regarding potential destination countries and areas of study.
Furthermore AlmaLaurea proposed to integrate the survey with questions of social relevance, like
family background and household composition.
Critical factors were identified, such as the heterogeneity of the Caribbean reference population,
as well as linguistic and geographic diversity in the region. In order to reach cases from each of the
three main linguistic areas, each partner was responsible for distributing the questionnaire in
given areas: UNIBE in the Dominican Republic, CKLN covered English‐speaking area, FORDES was
responsible for Cuba, MENON disseminated the initiative towards French‐ and Dutch‐speaking
areas.
Survey administration was web‐based. The hypothesis of introducing a sampling method was
envisaged, and to doing so AlmaLaurea requested partners to supply specific information (such as
a short description of HE systems) which would help to have an idea of the target population
(number of universities, no. of students, no. of researchers, gender distribution, main fields of
study) and structure the sample. Much information was collected in the Dominican Republic and
the English‐speaking Caribbean, while for other areas it was not possible to get much more in‐
depth data.
Nevertheless it was decided with the project coordinator to give to survey maximum visibility and
dissemination possible, opening participation to all students and researchers willing to give
information to the project consortium.
For these two reasons an open survey was implemented, without any specific sampling frame and
simply monitoring feedbacks in order to compare the achieved sample to of reference population
characteristics in order to check for gender balance and distribution of cases among macro‐areas.
                                                                                                    2
2.3. Questionnaire design
The survey was split into two different questionnaires: one for students and one for researchers.
The questionnaires were inspired by three main different sources: first, the project benefited from
previous Erasmus‐Mundus projects in which similar surveys were carried out (above all, the
ACCESS Project coordinated by MENON); second, AlmaLaurea introduced new items and reviewed
the entire set of questions on the basis of its experience in quantitative analysis in the field of
higher education studies; third, questionnaire contents and question phrasing were duly appraised
by Caribbean partners on the basis of local peculiarities and needs.
Contents and items were discussed among partners, and a final version of the two questionnaires
was achieved collectively. Questionnaire content can be summed up as follows:
    • perception of Europe
    • perception of European higher education
    • mobility perspectives and academic cooperation
    • general information on respondent (age, gender, highest education qualification, study
        domain, etc.)
    • family background of respondent
Both questionnaires were administered through a web platform developed for this specific
purpose. Each questionnaire comprised 30 questions and required 7‐10 minutes to be completed.
A closed question format was privileged in order to permit a quick and comprehensive analysis of
data.
Nevertheless some questions were given an open answer format in order to collect specific types
of information. These answers needed to be checked, harmonised and encoded in order to use the
results for analysis. The final balance between open and closed questions was respectively 15 and
85%.

2.4. Survey administration
The administration and diffusion of the survey was left totally to the Caribbean partners’ initiative.
In general the strategies adopted to spread awareness among students and researchers were:
    • Mailing actions when addresses were available and accessible
    • Involvement of faculty managers and teachers in order to obtain support for the
        sensitization of students
    • Questionnaire info postings on university web portals or intranet systems
    • Letters of invitation and explication of survey goals and project objectives

In addition to these actions directly carried out by Caribbean partners, the European partners
supported the initiative with the preparation of survey specific banners on the MastersPortal
website (Caribbean dedicated pages) and by directly linking the project website to the survey web
platform. Invitation to participate in the survey were reiterated at least twice by each partner by
sending reminders or involving new subjects in the initiative.

                                                                                                    3
2.5. Activities timeframe
ACTIVITY BEGINNING END WHO
Target group analysis – data collection 01/01/2011 15/02/2011 AL, UNIBE, CKLN,
Questionnaires - first draft release 01/01/2011 28/01/2011 AL
Questionnaire feedback from partners – first round 31/01/2011 MENON, UNIBE, CKLN, FORDES, SP
20/02/2011
Questionnaires – second draft release 20/02/2011 24/02/2011 AL
Questionnaire feedback from partners – second
25/02/2011 15/03/2011 MENON, UNIBE, CKLN, FORDES, SP
round
Questionnaire and web platform translation into
15/03/2011 31/03/2011 MENON, UNIBE
Spanish and further adaptations
Survey development
15/03/2011 07/04/2011 AL
(questionnaire web platform preparation)
First survey web platform release and tests 07/04/2011 24/04/2011 MENON, UNIBE, CKLN, FORDES, SP
Platform synchronization with CaribErasmus and
07/04/2011 24/04/2011 AL, MENON, SP
Study Portal web sites
Survey START 26/04/2011 09/05/2011 AL, MENON
Kingston dissemination event 09/05/2011 11/05/2011 AL
Feedbacks to partners on survey state of art and
11/05/2011 16/05/2011 AL, MENON, UNIBE, CKLN, FORDES
preparation of first reminders
AL, MENON, UNIBE, CKLN,
SKYPE flash meeting on survey state of art 16/05/2011 19/05/2011
FORDES, SP, EURASHE
Feedback to partners on survey state of art and
19/05/2011 24/05/2011 AL, MENON, UNIBE, CKLN, FORDES
preparation of second reminders
Feedback to partners on survey state of art and
24/05/2011 05/06/2011 AL, MENON, UNIBE, CKLN, FORDES
preparation of third reminders
Feedback to partners on survey state of art and
06/06/2011 29/06/2011 AL, MENON, UNIBE
preparation of fourth reminders
AL, MENON, UNIBE, CKLN,
Survey END 29/06/2011 01/07/2011
FORDES, SP, EURASHE
AL, MENON, UNIBE, CKLN,
Survey 1 month extension 01/07/2011 01/08/2011
FORDES, SP, EURASHE
Survey data analysis and reporting 20/09/2011 20/10/2011 AL
Santo Domingo dissemination event
19/03/2011 21/04/2011 AL
Presentation of results
Port of Spain dissemination event
28/11/2011 30/11/2011 AL
Presentation of results
43. Results
3.1. Sample size and coverage
At the end of the field phase (July 1st, 2011) the survey produced 587 completed questionnaires,
412 among students and 175 among researchers (Tab. 1). These results are far below the initial
expectations mainly due to a) the lack of Cuban student and researcher participation. The partner
FORDES, responsible for survey dissemination in Cuba, had to submit the action to higher Cuban
government hierarchy levels and did not obtain the necessary support (the survey dealt with
mobility, that in Cuba is a very sensitive issue); an extra month was planned in order to allow
Cuban partners to start survey diffusion, but unfortunately it was not enough to enable a positive
acceptance of the action; b) additional difficulties were met in attempting to reach a capillary
notice diffusion among stakeholders belonging to peripheral HEIs not represented in the project
consortium.
Nevertheless the number of collected questionnaires allows us to obtain a fairly comprehensive
image of target groups at the macro‐regional level and to break down results at least for the most
represented national groups.
Tab. 1. CaribErasmus Results at the Survey Deadline
Number of respondents Students Researchers
412 175
Source: AlmaLaurea – CaribErasmus
The balance between females and males in our analysis group reflects the distribution observed in
the general statistics on higher education examined during the survey preparation phase. Women
are prevalent in the student group, whereas gender distribution is more balanced in the
researcher group (Tab. 2). The majority of student respondents was attending an undergraduate
programme (Tab. 3). In the case of researchers the most interested survey participants proved to
be lecturers and associate or full professors (Tab. 4), the majority of which had attained a master’s
or PhD degree (Tab. 5).
Tab.2 Gender of Respondents *
Students Researchers
N % N %
Female 246 59,7 84 48,0
Male 165 40,0 87 49,7
Not responding 1 0,2 4 2,3
Total 412 100 175 100
Source: AlmaLaurea ‐ CaribErasmus
5Tab. 3. Students by Degree Programme Level
N %
Undergraduate 282 68,4
Postgraduate 130 31,6
Total 412 100
Source: AlmaLaurea – CaribErasmus
Tab. 4. Researchers by Current Academic Position
N %
Junior researchers 11 6,3
Senior researchers or research managers 15 8,6
Lecturers, assistants, associate professors 64 36,6
Full professors 50 28,6
Other 34 19,4
Not responding 1 0,6
Source: AlmaLaurea – CaribErasmus
Tab. 5. Researchers by Highest Degree Attained
N %
Bachelor’s‐level degree 11 6,3
Master’s‐level degree or equivalent 107 61,1
Ph.D or equivalent 56 32,0
Not responding 1 0,6
Total 175 100,0
Source: AlmaLaurea ‐ CaribErasmus
In terms of higher education institution coverage (Tab. 6 and Tab. 7), the results are strictly linked
to the capacity of the Caribbean partners to involve in the initiative their own academic networks
and spread the information towards available communication channels. It is not surprising that on
the top of the list we have the University of the West Indies (second position in case of
researchers), where a fruitful dissemination event took place in May 2011 (Mona Campus in
Kingston, Jamaica) just at the start of the survey field phase. Many stakeholders were sensitized
on that occasion thus helping spread awareness to other English‐speaking Caribbean countries
where UWI has campuses (Trinidad and Tobago, Barbados). Thanks to the Kingston meeting and
the parallel information campaign made by CKLN, it was also possible to reach other nearby HEIs,
such as the Northern Caribbean University and the University of Technology of Jamaica. On the
Spanish‐speaking side, UNIBE (a project partner) reached a significant number of Dominican
universities (UNNATEC, UASD, APEC, and others), being more successful in the involvement of
researchers than students. The involvement of other represented HEIs in the survey is probably
the results of a combination of factors like local partner commitment, availability of a Caribbean
information portal (developed by StudyPortal) with a direct link to the survey, dissemination
actions carried out by the MENON coordinator, etc. Unfortunately, Cuban HEI’s are very
underrepresented, significantly biasing Caribbean representation.
6Tab. 6. Students by University
N %
University of the West Indies (All Campuses*) 121 29,4
Northern Caribbean University, Jamaica 62 15,0
University of Technology, Jamaica 55 13,3
Universidad Iberoamericana de Santo Domingo (UNIBE), DR 28 6,8
Universidad Nacional Tecnologica (UNNATEC), DR 25 6,1
Universidad Autonoma de Santo Domingo (UASD), DR 22 5,3
Universidad APEC, DR 18 4,4
University of Trinidad and Tobago 11 2,7
Pontificia Universidad Catolica Madre y Maestra, DR 8 1,9
University College of the Caribbean (UCC), Jamaica 8 1,9
Instituto Tecnológico de Santo Domingo (INTEC), DR 6 1,5
St. George's University, Grenada 5 1,2
Instituto Superior Politécnico “J. A. Echeverría” La Habana, Cuba, DR 4 1,0
Universidad de la Habana, Cuba 4 1,0
City University of New York‐ Brooklyn College, USA 3 0,7
Sir Arthur Lewis Community College, Saint Lucia 3 0,7
Other 22 HEIs 22 5,3
Not currently at university 2 0,5
Not indicated 5 1,2
Total 412 100
*The University of West Indies is organized over three Campuses: Mona (Jamaica), St Augustine (Trinidad and
Tobago), Cave Hill (Barbados). Source: AlmaLaurea ‐ CaribErasmus
Tab. 7. Researchers by University
N %
Universidad Iberoamericana de Santo Domingo (UNIBE), DR 36 20,6
University of the West Indies (all Campuses*) 29 16,6
Universidad Autonoma de Santo Domingo (UASD), DR 14 8,0
Universidad APEC Santo Domingo, DR 11 6,3
Northern Caribbean University, Jamaica 10 5,7
Instituto Tecnológico de Santo Domingo (INTEC), DR 5 2,9
Pontificia Universidad Catolica Madre y Maestra, DR 5 2,9
Universidad Católica Nordestana, DR 6 3,4
Universidad Central del Este, DR 4 2,3
University of Technology, Jamaica 3 1,7
Universidad de la Habana, Cuba 3 1,7
Universidad Dominicana O&M, DR 3 1,7
Universidad Nacional Evangélica (UNEV), DR 3 1,7
Universidad Nacional “P. H. Ureña” (UNPHU), DR 3 1,7
Universidad Nacional Tecnologica (UNNATEC), DR 3 1,7
University College of the Caribbean, Jamaica 3 1,7
Instituto Superior Politécnico “J. A. Echeverría” La Habana, Cuba 2 1,1
Universidad Central "Marta Abreu" de Las Villas, Cuba 2 1,1
Universidad Federico Henriquez y Carvajal (UFHEC), DR 2 1,1
Other 12 HEIs 12 6,9
Other non‐University research Institute 8 4,6
Not currently employed in a Higher Education Institution 4 2,3
Not indicated 4 2,3
Total 175 100,0
*The University of the West Indies is organized over three campuses: Mona (Jamaica), St Augustine (Trinidad and
Tobago), Cave Hill (Barbados). Source: AlmaLaurea ‐ CaribErasmus
7The distribution of respondents by country of residence roughly reflects what we have seen for
HEIs: a good representation of Jamaican, Dominican and Trinidad residents and an extended
representation of other Caribbean countries, even if with smaller numbers. It is also interesting to
remark how the countries represented go beyond the Caribbean, extending toward the US,
Europe and Central America, as is to be expected in any evolved academic community.
Tab. 8. Students’ Usual Country of Residence
N %
Jamaica 190 46,1
Dominican Republic 115 27,9
Trinidad and Tobago 59 14,3
Cuba 11 2,7
Saint Lucia 8 1,9
Saint Vincent and the Grenadines 7 1,7
Grenada 4 1,0
Bahamas 3 0,7
Suriname 3 0,7
Antigua and Barbuda 2 0,5
Barbados 2 0,5
Guyana 2 0,5
USA 2 0,5
Aruba 1 0,2
Belize 1 0,2
Haiti 1 0,2
Mexico 1 0,2
Total 412 100,0
Source: AlmaLaurea ‐ CaribErasmus
Tab. 9. Researchers’ Original Country of Residence
N %
Dominican Republic 106 60,6
Jamaica 45 25,7
Cuba 11 6,3
Belize 2 1,1
Trinidad and Tobago 2 1,1
Bahamas 1 0,6
Curaçao 1 0,6
Haiti 1 0,6
Saint Lucia 1 0,6
Cameroon 1 0,6
Guatemala 1 0,6
Italy 1 0,6
Netherlands 1 0,6
Not responding 1 0,6
Total 175 100,0
Source: AlmaLaurea ‐ CaribErasmus
8The surveys equally involved public and private universities, with a prevalence of the former in
case of the student sample and of the latter in the researchers sample. Oddly, some interviewees
were not able to state the status of their institution.
Tab. 10. Type of University
Students Reserachers
N % N %
Public 226 54,9 58 33,1
Private 180 43,7 101 57,7
Other 1 0,2 14 8,0
Don’t know 6 1,2 2 1,1
Total 412 100,0 173 100
Source: AlmaLaurea ‐ CaribErasmus
A very interesting finding concerns surveys participants’ age. In case of students (Fig. 1) there is a
significant presence of “old” students, above the typical age for higher education attendance (18‐
25 years). The latest data on typical enrolment age1 suggests that 80% of tertiary education
students have an entry age below 25.3 years. It would be interesting to more thoroughly explore
this result, that can be probably linked to a widespread student‐worker condition or a return to
education of a large number of adults.
Fig. 1. Students’ Age (percentage values *)
*2 non‐respondents (0.5%). Source: AlmaLaurea ‐ CaribErasmus
1
OECD, Education at a Glance 2011, Paris. The data refers to the average for OECD (the world’s most developed)
countries.
9In case of the researcher sample (Fig. 2), as expected respondents were concentrated in the
younger sectors of the teaching body. To explain this results we can just make some assumptions:
the presence a teaching body younger than what we could expect in Europe or in alternative,
younger teachers are more willing to dedicate efforts to mobility and international cooperation
schemes (and also found the time to complete a web survey).
Fig. 2. Reserachers’ Age (percentage values*)
*4 non‐respondents (2.3%). Source: AlmaLaurea ‐ CaribErasmus
The distribution of survey participants by field of study/research (Fig. 3 and Fig. 4) displays a major
presence of Business and Administration students and researchers, followed by a fairly uniform
distribution among other fields. In the first positions we find both social studies/humanities
disciplines and scientific disciplines like Engineering and Computing. If we were to interpet (with a
certain degree of approximation) as more “internationalized” (in terms of academic cooperation
and mobility) those fields that are more widely represented in the sample we would commit an
error: the degree of participation in the survey is influenced by external factors like the ability of
project partners to involve an equal rate of students and researchers coming from all disciplines.
For instance, medicine and health faculties are not present in all universities that (in some way)
were invited to participate in the survey.
10Fig. 3. Students’ Fields of Study (percentage values)
Source: AlmaLaurea ‐ CaribErasmus
Fig. 4. Researchers’ Specialization (percentage values)
Source: AlmaLaurea ‐ CaribErasmus
113.2. Aggregate Results – Student Survey
In this second results section we report the response distributions for the full set of questions
included in the student questionnaire (questions are ordered according to the original web
questionnaire). Section A of the following table reports students’ perception of the European
Higher Education Area. Question 2 shows that the majority of students interviewed still perceive
Europe as a sum of its national components, even if the belief that a common set of standard rules
or guidelines is established is quite widespread.
Students were asked to list UK and continental Europe universities they consider “prestigious”. It is
no surprise that Oxford and Cambridge lead the UK group, while the Sorbonne in Paris leads the
contintental ranking, that is far more broad than the first group (several European countries are
well represented).
A. STUDENTS PERCEPTION OF EUROPEAN HE SYSTEM Total Total
N %
en 292 70.9
0. Questionnaire’s chosen
es 120 29.1
language
Totale 412 100.0
Institutions that follow guidelines established
by a unique and coherent political entity, 102 24.8
independent of the international context
Institutions that adhere to a common set of
2. In terms of higher education
standards for education in each country, 88 21.4
(colleges, universities, etc.)
regardless of the international context
which of the following phrases
Western European institutions 19 4.6
best describes your idea of the
Distinct institutions with cultures and practices
European Union?
primarily defined by the environment of their 136 33.0
home countries
I don’t know 67 16.3
Total 412 100.0
University of Oxford 168 50.1
University of Cambridge 100 29.9
University of London 7 2.1
3. List up to 3 universities in the European Business School London 5 1.5
United Kingdom you consider London School of Economics 5 1.5
prestigious University of Liverpool 5 1.5
(first choice*) University of Wales 5 1.5
Imperial College 3 0.9
London Business School 3 0.9
University of Bradford 3 0.9
University of Leeds 3 0.9
Middelsex university 2 0.6
*We consider for analysis only
University College of London 2 0.6
the first choice out of 3 (77
students didn’t reply) University of Edinburgh 2 0.6
University of Kent 2 0.6
University of Manchester 2 0.6
University of Warwick 2 0.6
12Other 16 Universities 16 4.8
Université de Paris‐Sorbonne 21 12.0
Ludwig Maximilian Universität Munchen 15 8.6
Universidad Complutense de Madrid 9 5.1
Alma Mater ‐ Università di Bologna 6 3.4
Universidad de Barcelona 6 3.4
Universidad de Salamanca 6 3.4
University College Dublin 5 2.9
Ecole Polytechnique 3 1.7
Freie Universität Berlin 3 1.7
Universidad de Granada 3 1.7
Universidsd Autonoma de Barcelona 3 1.7
4. List up to 3 universities in the Universität Hamburg 3 1.7
rest of Europe you consider Universität Zürich 3 1.7
prestigious (first choice*) Université de Géneve 3 1.7
University of Amsterdam 3 1.7
University of Oslo 3 1.7
Utrecht University 3 1.7
Aaachen Facocschule 2 1.1
Academy of European Law 2 1.1
Delft University of Technology 2 1.1
*We consider for analysis only
the first choice out of 3 (237 INSEAD 2 1.1
students didn’t reply) Katholieke Universiteit Leuven 2 1.1
Linköping University 2 1.1
Sciences Politiques Paris 2 1.1
Swiss Federal Institute of Technology Zurich 2 1.1
Universidad Autonoma de Madrid 2 1.1
Universität Heidelberg 2 1.1
Université de Bordeaux 2 1.1
Université Panthéon‐Assas 2 1.1
Université Pierre et Marie Curie Paris 2 1.1
University of Copenhagen 2 1.1
Wageningen University 2 1.1
Other 47 universities 47 26.9
13Fig. 5. Attributes That Best Describe the Idea of “Europe” According to Students*
organized, expensive, exciting
successfull, attractive,
Most
selected
far away, clean, traditional,
Adjectives modern, strong, hi‐tech,
(from 67% to
25% of liberal, conservative, old,
respondents) friendly
Less prejudiced, linguistically
selected
Adjectives challenging, tolerant,
(from 22% to
0% of
trustworthy, outgoing,
respondents) snobbish, young, aggressive,
affordable, boring, nearby,
chaotic, dirty, corrupt,
deteriorating, weak, ugly
*Positive attributed in blue, negative attributes in red, neutral attributes in black.
Another exercise we have proposed to Caribbean Students was to choose, among a list of
attributes, the ones that best describe their idea of Europe (the question was multiple choice). Fig.
5 reports the adjectives that have been selected by at least 1 quarter of the interviewees (in the
upper part of the figure) and the adjectives that were, vice versa, discarded by a wide majority of
them (i.e., selected at most by a small minority). In addition we have separated – by color coding –
positive, negative and neutral attributes. What emerges clearly is that students have in general a
positive idea of Europe: organized, exciting, attractive, etc., even if it is expensive. It is also
interesting to emphasize the coexistence of clear dichotomies like modern/traditional and
liberal/conservative, that well describe Europe, while the majority of respondents clearly consider
Europe as “Old” (the old continent?).
In Section B the questionnaire focuses on students’ mobility intentions for study reasons. An
overwhelming majority of students wish to undertake studies abroad (96.1%; question 5), the
reasons behind this decision are (in order of preference): it would allow to expand one’s
knowledge, it would provide a degree with international recognition, it would create better job
opportunities, it would allow to enroll in a degree programme not offered in the home country.
The less “practical” prestige reason is mentioned only by the 3.5% of students (question 6).
14B. STUDENTS’ MOBILITY INTENTIONS
N %
5. Do you consider undertaking Absolutely 259 62.9
postgraduate studies in a Perhaps 137 33.3
foreign university as necessary No 16 3.9
for your future career? Total 412 100.0
It would allow me to expand my knowledge 132 33.3
It would provide a degree with international
6. Why do you consider recognition 117 29.5
undertaking postgraduate It would create better job opportunities 85 21.5
studies in a foreign university It would allow me to enroll in a degree programme
necessary? that is not offered in my country 48 12.1
It is more prestigious 14 3.5
Total 396 100.0
United Kingdom 144 36.4
United States 121 30.6
7a. In which of the following Rest of Europe 110 27.8
regions would you prefer to Australia or New Zealand 10 2.5
enroll in a postgraduate Latin America 6 1.5
programme? Caribbean 3 0.8
Asia 2 0.5
Total 396 100.0
United States 121 30.6
United Kingdom 116 29.3
7b. And in which other region Rest of Europe 97 24.5
would you prefer to enroll in a Australia or New Zealand 26 6.6
postgraduate programme? Latin America 18 4.5
Caribbean 11 2.8
Asia 7 1.8
Total 396 100.0
The United States and the United Kingdom, immediately followed by continental Europe
(questions 7a and 7b), are the most attractive countries for Caribbean students. What emerges
clearly from data is how little students consider the prospect of intra‐Caribbean mobility (0.8% as
first choice; 2.8% as second choice). Academic integration of the Caribbean space should be more
convincingly promoted in the forthcoming years by regional authorities and supported by Europe
through specific cooperation policies towards the area2.
2
Of some interest is in this respect the intra ACP mobility program recently issued by European Union and ACP
Secretariat in the framework of EuropAid initiative. For more information:
http://eacea.ec.europa.eu/intra_acp_mobility/funding/2012/call_eacea_11_12_en.php
15N %
Spain 136 70,8
France 122 63,5
Germany 104 54,2
Italy 94 49,0
Netherlands 58 30,2
Sweden 51 26,6
Belgium 33 17,2
7c. In which of the following Denmark 28 14,6
[continental European] Portugal 25 13,0
countries would you consider Austria 20 10,4
enrolling in a postgraduate
Greece 18 9,4
programme? Select no more
Ireland 18 9,4
than five countries
Finland 10 5,2
Luxembourg 10 5,2
Czech Republic 8 4,2
Romania 4 2,1
Hungary 3 1,6
Malta 3 1,6
Poland 3 1,6
Bulgaria 1 0,5
Cyprus 1 0,5
Question 7c intended to identify the most suitable continental Europe countries. At the top of the
ranking there is Spain, always the first choice for Spanish speakers. Germany and Italy perform
well if one considers that German and Italian are not common languages in the Caribbean.
Of course one should distinguish the desire of students to engage in international study
experience and the actual ability to finance a stay abroad. Section C of the survey can tell us more
about this aspect (see below). Almost all students (98.5%) would require extra funding for any
plan to study abroad (question 9). The majority of them would opt for resources in their own
country of residence or from European governmental or international agencies (questions 9 and
10). As regards students’ prior conditions, 85.4% of them have never had study experiences
abroad (question 20), and 77.9 % intend to continue their studies at the next higher education
level (question 21). Most of them held full‐ or part‐time jobs during their studies (83%), and it is
likely that they would need to do the same in case of enrolment in higher level degree courses
(question 22). The need to work (together with the need for extra funding) is crucial for transform
a will to move abroad into a tangible choice. We’ll learn more on this aspect looking at the last
section of the questionnaire dedicated to social and family background.
16C. FUNDING MOBILITY N %
Absolutely 350 88.4
8. Would you require extra
Perhaps 40 10.1
funding (besides your personal
No 6 1.5
or family’s savings) to study
Total 396 100.0
abroad?
My country of residence 162 41.5
Other European country 97 24.9
United Kingdom 60 15.4
9. From which region are you The country in which I am currently studying (only if
most likely to obtain such extra different from that of residence) 46 11.8
funding? Latin America 10 2.6
Australia or New Zealand 9 2.3
Other Caribbean country 4 1.0
Asia 2 0.5
Total 390 100.0
Government agencies 127 32.6
International agencies: Europe (including UK) 117 30.0
Private sector 37 9.5
Other 34 8.7
10. What is the most likely 30 7.7
University
source of such extra funding?
International agencies: Other 21 5.4
International agencies: Caribbean 16 4.1
International agencies: United States 6 1.5
Not responding 2 0.5
Total 390 100.0
20. During your university No, never 352 85.4
studies have you ever spent a Yes, but with no credit recognition for my degree 32 7.8
period of study abroad (at least Yes, and with credit recognition for my degree 28 6.8
three weeks outside of the
Caribbean area)? Total 412 100.0
Definitely 321 77.9
Probably 75 18.2
21. Do you intend to continue
Probably not 13 3.2
your studies at the next level
Definitely not 2 0.5
Not responding 1 0.2
Total 412 100.0
17Yes, full‐time job(s) but for more than half the
duration of my university studies 132 32.0
Yes, seasonal or occasional job(s) 89 21.6
22. During your university Yes, part‐time job(s) 84 20.4
studies have you held a paid
No, never 68 16.5
job? Yes, full‐time job(s) but for less than half the duration
of my university studies 37 9.0
Not responding 2 0.5
Total 412 100.0
23. Does/did this job involve a Yes 201 58.4
field that is consistent with the No 142 41.3
subject matter of your degree Not responding 1 0.3
programme? Total 344 100.0
Section D of the survey is focused on the most suitable form of cooperation with European Union.
More than the half of the interviewed students declare that physical mobility is the most desirable
way to take advantage of a study experience abroad, followed by enrolment in joint degree
programs (that very likely involves the opportunity to study in at least a couple of countries). In
the opinion of students it clearly emerges that alternative ways – like distance education, foreign
universities branches at home, virtual mobility – are not considered so positively, perhaps because
they do not guarantee immersion in a new culture and country. When students are asked which
type of cooperation they are more likely to choose, results don’t change significantly. We could
have expected students to evaluate distance education or virtual mobility better in the light of
exogenous constraints (like financial resource availability, need to work during study, etc.), but
these alternative to physical mobility didn’t gain much ground. Thus, more should be done to
develop distance education and virtual mobility and better promote them among students as
convenient and efficient (and maybe democratic?) alternatives to get in touch with a foreign
context even without a full immersion in a host country.
18D. COOPERATION WITH EUROPEAN UNION N %
11a. Which of these types of Physical mobility 227 55.1
cooperation in higher Joint degrees and curricula 86 20.9
education with the European Foreign university branches 37 9.0
Union do you find most Distance education 32 7.8
desirable?3 Virtual mobility 30 7.3
Total 412 100.0
Joint degrees and curricula 139 33.7
11b. Which other type of
Foreign university branches 103 25.0
cooperation in higher
Physical mobility 60 14.6
education with the European
Virtual mobility 59 14.3
Union do you find desirable?
Distance education 51 12.4
Total 412 100.0
Physical mobility 225 54.6
12a. Which of these types of Joint degrees and curricula 84 20.4
cooperation in higher 38 9.2
Foreign university branches
education with the European
Distance education 35 8.5
Union are you most likely to
Virtual mobility 26 6.3
choose?
None 4 1.0
Total 412 100.0
Joint degrees and curricula 139 34.1
12b. Which other type of Foreign university branches 78 19.1
cooperation in higher Distance education 58 14.2
education with the European Virtual mobility 54 13.2
Union are you likely to choose? Physical mobility 52 12.7
None 27 6.6
Total 408 100.0
3
In questions 12 and 12b we distinguish between the five categories:
Physical mobility: the traditional mode, in which the student undertakes studies by personally attending an external
university or institution.
Joint degrees and curricula: joint university curricula are taught completely in a local university or jointly with a foreign
university, and the foreign university awards the degree.
Virtual mobility: Students and teachers use international curricula and interact/cooperate across countries through
information and communication technology without being disconnected from their original higher education institution.
Distance education: Education and training are imparted at a distance through communication media: books, radio, TV,
telephone, correspondence, computer, video.
Foreign university branches: A foreign university has a campus in your country, with its own curricula and professors,
and the foreign university awards the final degree.
19E. STUDENTS’ SOCIAL CONDITIONS AND FAMILY N %
BACKGROUND
I work 115 27.9
Family 102 24.8
26. How do you pay for your Scholarship 74 18.0
studies? Other 70 17.0
Personal savings 49 11.9
Not responding 2 0.5
Total 412 100.0
No 266 64.6
27. Are you responsible for a
Yes, and I have children 89 21.6
family?
Yes, but I have no children 57 13.8
Total 412 100.0
Yes, from home 307 74.5
Yes, from work 52 12.6
Yes, from the university 37 9.0
28. Do you have regular access
Yes, from other places 11 2.7
to the Internet and, if so, from
Not responding 3 0.7
where mostly?
No 1 0.2
Yes, from an Internet cafe 1 0.2
Total 412 100.0
English 385 93.4
29. Do you have a good
Spanish 209 50.7
working knowledge of the
French 55 13.3
following languages?
Dutch 3 0.7
(multiple choice question)
German 4 1.0
Other 15 3.6
The final section of the survey treated more specifically student background conditions that may
directly or indirectly influence the choice to pursue an international study experience. Even if the
majority of students carried out some kind of paid job during their studies (see question 22
above), these very students perhaps surprisingly claim not to be dependent on work in order to
pay for their studies (71.7% of students are funded by family, scholarships, personal savings or
other: question 26). In order to estimate the standard of living in students’ households, other
questions were posed concerning the availability of internet at home (widespread: question 28)
and parents’ level of education (tertiary level degrees are common both among fathers and
mothers: questions 30 and 31).
20University degree 115 27.9
30a. What is the highest level Secondary education 154 37.4
of formal education your father None or primary education 97 23.5
completed? Don't know or not applicable 44 10.7
Not responding 2 0.5
Total 412 100.0
Caribbean 89 77.4
United States 10 8.7
30b. Where did he obtain his
Latin America 9 7.8
highest level of education?
United Kingdom 6 5.2
Not responding 1 0.9
Total 115 100.0
University degree 138 33.5
31a. What is the highest level Secondary education 159 38.6
of formal education your None or primary education 97 23.5
mother completed? Don't know or not applicable 17 4.1
Not responding 1 0.2
Total 412 100.0
Caribbean 117 84.8
31b. Where did he obtain his Latin America 11 8.0
highest level of education? United States 4 2.9
United Kingdom 4 2.9
Not responding 2 1.4
Total 138 100.0
The last indicator used is parents’ profession (questions 32 and 33): many students have parents
employed (to date or before retirement) in higher/medium management positions, as liberal
professionals, or as medium/large‐size company entrepreneurs (31.1% for fathers and 28.9% for
mothers). Moreover, almost two‐thirds of respondents say they do not have a family for which
they are responsible (question 27).
These findings suggest that most respondents have good chances to participate in mobility
programs. It is likely that participation in this survey (which was not mandatory) in itself indicates a
certain desire to enrich one’s study CV with an international experience. In addition, it is likely that
in the Caribbean area participation in higher education exerts a selection effect (students coming
from wealthier families). In conclusion, one must always keep in mind that these results do not
concern a representative sample of the Caribbean tertiary level student population; indeed, the
sample comprises a (quite heterogeneous) group of volunteers that accepted (or were persuaded
by project partners) to participate in the survey in that they were already interested in a study
experience abroad. In this sense the survey initiative, together with other project information and
dissemination actions, contributed to sensitizing stakeholders with regard to a possible study
experience in Europe.
21Self‐employed 178 43.2
Liberal profession, entrepreneur (with at least 15
employees) 31 7.5
Entrepreneur (less than 15 employees), craftsman,
32. What is your father’s shopkeeper 57 13.8
occupation (or what was his Other self‐employed 90 21.8
final occupation if he no longer Employed 213 51.7
works)? High‐level manager, salaried professional 41 10.0
Mid‐level manager, white‐collar 56 13.6
Clerical worker 38 9.2
Blue‐collar, manual laborer 78 18.9
Never held a paid job 11 2.7
Not responding 10 2.4
Total 412 100.0
Self‐employed 106 25.7
Liberal profession, entrepreneur (with at least 15
employees) 10 2.4
Entrepreneur (less than 15 employees), craftsman,
33. is your mother’s occupation shopkeeper 50 12.1
(or what was her final Other self‐employed 46 11.2
occupation if she no longer Employed 260 63.1
works)? High‐level manager, salaried professional 46 11.2
Mid‐level manager, white‐collar 63 15.3
Clerical worker 72 17.5
Blue‐collar, manual laborer 79 19.2
Never held a paid job 41 10.0
Not responding 5 1.2
Total 412 100.0
223.2.1 Student Survey – Focus on Jamaica, Dominican Republic, Trinidad and Tobago
The prevalence of selected national groups in the student sample (see Tab. 8) makes it possible to
perform specific analyses for the most represented countries: namely Jamaica, the Dominican
Republic, and Trinidad and Tobago.
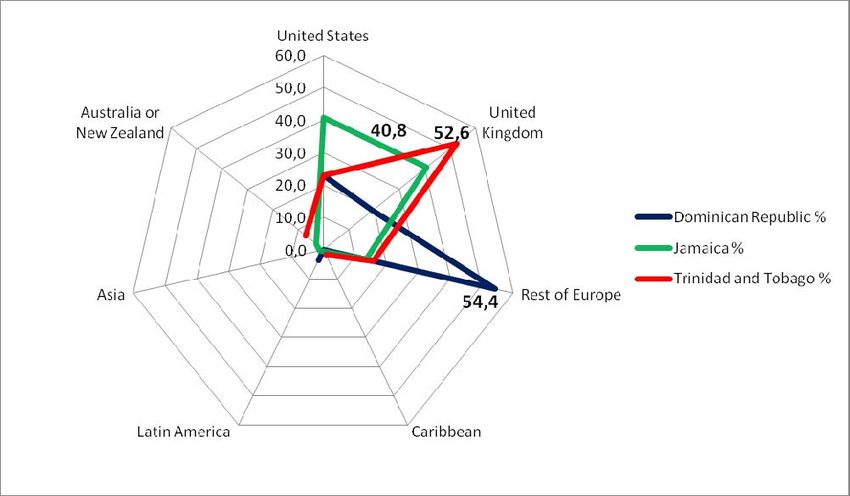
Fig. 6. Preferred Region of Destination for a Postgraduate Programme by Country of Origin
(three most represented nationalities)
Figure 6 confirms how preferences for foreign study destinations are strongly linked to cultural
and linguistic factors. Jamaican studentsì preferences are equally distributed between the United
Kingdom and the United States, while Trinidad students are more strictly focused on the UK.
Dominican students’ preferences gravitate toward continental Europe, to whom one may suppose
that Spain and other areas speaking languages of Latin origin appear more suitable. Once again
there a remarkable lack of interest for other world regions, including intra‐Caribbean mobility: a
clear signal of the integration difficulties the region is experiencing.
A look at the most preferred European countries (after the United Kingdom) confirms these
results: Dominican students are most likely to be oriented toward Spain, France, and Italy (Figure
7). Trinidad students’ second preference for Germany deserves further investigation. In general,
France and Germany stimulates the interest of many students regardless of their country of origin.
23Fig. 7. Preferred Continental Europe Country of Destination for a Postgraduate Program by
Country of Origin*
* The data refer exclusively to students who are willing to move to continental Europe for study (first or second
choice); multiple choices were possible for all EU continental countries (including Ireland).
3.2.2. Student Survey – Focus on Parents’ Education level
In order to explore social background more thoroughly, we cross‐tabulated the educational levels
achieved by students’ father and mothers (Figure 8). For the analysis we have considered the
whole students population. Two interesting trends emerge. Firstly, many students are the first
generation to attend university, in that 196 students out of a total of 412 (47.6%) have parents
who have earned at most a lower (primary or secondary) education degree. This suggests that
families are engaging in a clear attempt to achieve social progression via the educational choices
of their children. Secondly, 176 students out of 412 (42.7%) have at least one parent holding a
university degree. In order to provide a benchmark with a European country, one may mention
that among Italian graduates the corresponding rate is 16.4%4. Among these 176 students 77
students about 412 (18,7%) declares that both parents hold a tertiary education degree, which is a
far higher rate than that observed among Italian graduates (10.1%).
4
AlmaLaurea, Italian Graduates Profile 2010. http://www.almalaurea.it/en/universita/profilo/profilo2010/index.shtml
24Fig. 8. Students by Parents’ Education Level*
*figures in absolute numbers
253.3. Aggregate results – Researcher Survey
In this last section we report response distributions for the full set of questions included in the
researcher questionnaire. Section A reports researchers’ perception of the European Higher
Education Area. Finding reflect the student survey results.
Most of the researchers interviewed perceive Europe as the sum of their national components
even if the belief that a common set of standards rules or guidelines is yet established is quite
widespread. Researchers were also invited to list UK and continental European universities they
consider “prestigious”. Again, Oxford and Cambridge lead the UK group, while Paris Sorbonne and
Complutense of Madrid lead the continental ranking.
A. RESEARCHERS’ PERCEPTION OF EUROPEAN HE SYSTEM N %
English 58 33,1
0. Questionnaire’s chosen
Spanish 117 66,9
language
Total 175 100
Distinct institutions with cultures and practices
primarily defined by the environment of their 68 38,9
home countries
Institutions that follow guidelines established by
2. In terms of higher education
a unique and coherent political entity, 50 28,6
(colleges, universities, etc.)
independent of the international context
which of the following phrases
Institutions that adhere to common set of
best describes your idea of the
standards for education in each country, 27 15,4
European Union?
regardless of the international context
Western European institutions 15 8,6
I don’t know 14 8,0
Not responding 1 0,6
University of Oxford 76 51,4
3. List up to 3 universities in the University of Cambridge 53 35,8
United Kingdom you consider London Metropolitan University 4 2,7
prestigious Imperial College 3 2,0
(first choice*) London School of Economics 3 2,0
Open University 2 1,4
Goldsmiths College, London 1 0,7
Hastings College of Arts & Technology 1 0,7
Queen Margaret University 1 0,7
University of Bristol 1 0,7
*We consider for analysis only
University of Newcastle 1 0,7
the very first choice out of 3 (27
researchers didn’t reply) University of Sussex 1 0,7
University of Warwick 1 0,7
26Université de Paris‐Sorbonne 21 20,5
Universidad Complutense de Madrid 15 15,0
Universidad de Salamanca 9 6,3
4. List up to 3 universities in the
Alma Mater ‐ Università di Bologna 6 5,5
rest of Europe you consider
Ludwig Maximilian Universität Munchen 6 3,9
prestigious (first choice*)
Universidad de Barcelona 6 3,9
Universidad de Valencia 5 3,1
Swiss Federal Institute of Technology Zurich 3 2,4
University of Oslo 3 2,4
Universidad Alcalá de Henares 3 1,6
Universidad Pontificia de Salamanca 3 1,6
*We consider for analysis only
Universidsd Autonoma de Madrid 3 1,6
the very first choice out of 3 (48 Universität Heidelberg 3 1,6
researchers didn’t reply) Université Catolique de Louvaine la Neuve 3 1,6
Université de Provence Aix‐Marseille 3 1,6
Universiteit Gent 3 1,6
Other 33 universities 3 26,0
Fig.9 Attributes that best describe the idea of “Europe” in the preferences of researchers*
27*In blue the positive attributes, in red the negative attributes, in black the neutral attributes.
As students were, researchers were asked to indicate – among a list of attributes – which best
describe their idea of Europe (the question was multiple choice). Fig. 9 reports the adjectives that
were selected by at least one‐quarter of the interviewees (in the upper part of the figure) and
those that were discarded by a wide majority of them (or selected by a small minority). In addition
we have highlighted these attributes’ status as positive, negative, or neutral. Results do not differ
significantly from those involving students. Researchers have in general a positive idea of Europe:
organized, exciting, attractive, etc., even if expensive. Researchers raise the linguistic challenge
issue, which they see as more of an obstacle to international cooperation than does the younger
generation of students. In addition, the "friendly" attribute chosen by the majority of students was
discarded by most researchers.
In Section B the questionnaire focuses on researchers’ international cooperation intentions. The
majority of researchers (61.7% ; question 7) are aware of research agreements between their own
university and international partners, and the majority of them proved to be of some benefit for
their work (question 9). Interviewed researchers also would be definitely willing to participate in
international research programmes (question 10).
B. INTERNATIONAL COOPERATION IN RESEARCH N %
Both research and teaching 127 72,6
5. Does your work involve Only teaching 35 20,0
research and teaching Only research 8 4,6
activities? Neither research nor teaching 4 2,3
Not responding 1 0,6
Total 175 100,0
7. To your knowledge does your Yes 108 61,7
university have any research No 63 36,0
agreements with foreign Not responding 4 2,3
universities? Total 175 100,0
Very useful 46 42,6
9. How useful have you found
Useful 41 38,0
the agreements with respect to
Not useful 21 19,4
your work?
Total 108 100,0
Definitely 138 78,9
10. Would you participate in a Probably 34 19,4
research programme with a Probably not 2 1,1
foreign university? Definitely not 0 0,0
Not responding 1 0,6
Total 175 100,0
28Researchers are particularly interested in creating links with continental Europe (34.3%), followed
by the United States and Canada (19.8%), the United Kingdom (15.1%), and other world regions.
Intra‐Caribbean cooperation was chosen by only 10 researchers out of 172 (5.8%), suggesting once
again that there is weak academic integration in the Caribbean space. The high representation in
the survey of Dominican researchers (see table 9) helps explain the preference for continental
Europe as the first area of choice for international cooperation: Spain, Italy, and France are the top
ranked countries in question 11c.
Continental Europe 59 34.3
11a. In which of the following United States and Canada 34 19.8
regions would you most prefer United Kingdom 26 15.1
to participate in a research The country in which I currently work 21 12.2
programme with a foreign Latin America 20 11.6
university? Other Caribbean country 10 5.8
Australia or New Zealand 2 1.2
Total 172 100.0
Continental Europe 50 29.1
United States and Canada 34 19.8
11b. In which other of the United Kingdom 34 19.8
following regions would you Latin America 26 15.1
most prefer to participate in a
Other Caribbean country 14 8.1
research programme with a
The country in which I currently work 7 4.1
foreign university?
Australia or New Zealand 4 2.3
Asia 3 1.7
Total 172 100.0
Spain 81 80.2
Italy 56 55.4
France 49 48.5
Germany 37 36.6
Netherlands 29 28.7
Sweden 27 26.7
Belgium 23 22.8
Portugal 22 21.8
11c. In which of the following
Denmark 11 10.9
[continental European]
Ireland 11 10.9
countries would you consider
Austria 10 9.9
participating in a research
Finland 6 5.9
programme? Select no more
Greece 3 3.0
than five countries.
Luxembourg 2 2.0
Malta 2 2.0
Romania 2 2.0
Czech Republic 1 1.0
Estonia 1 1.0
Latvia 1 1.0
Lithuania 1 1.0
Slovakia 1 1.0
29The ideal length of a cooperation scheme varies appreciably (question 11d), with a preference for
short (from 3 to 12 months) and, vice versa, long durations (from 2 to 5 years) over intermediate
ones. In the case of short durations, respondents may be thinking about physical mobility
schemes, while large and more structured international cooperation schemes (e.g., joint degrees)
require longer time frames to produce their effects. Nevertheless, when asked an opinion on the
possible impact on their university of joint degree curricula (question 12) or joint research
programs (question 13) with the EU, researchers react in a very satisfying way. As regards the
possible forms of cooperation (question 14), physical mobility of academics or the development of
joint degrees are believed to be the most suitable solutions (respectively 66 and 44% of
preferences).
For up to 3 months 30 17.4
3‐6 months 23 13.4
11d. For how long would you
6‐12 months 38 22.1
be willing to participate in a
12‐18 months 15 8.7
research programme with a
18‐24 months 17 9.9
foreign university?
2‐5 years 30 17.4
More than 5 years 19 11.0
Total 172 100.0
Excellent: it would only be of benefit
thanks to the wealth of work from two different
12. In your opinion, what cultural and methodological frameworks 106 60.6
impact would the Positive for the growth and development of the
implementation of joint institution and country, if the equity of the
curricula with European collaboration is respected 67 38.3
universities have on the Negative, as it can cause problems such as "brain
research systems in your own drain" and increase the economic and cultural 0 0.0
dependency on the collaborating countries
country?
Other 0 0.0
Not responding 2 1.1
Total 175 100.0
Excellent: it would only be of benefit 80 45.7
13. In your opinion, what
Positive for the growth and development of the
impact would the
country, if the equity of the collaboration is respected 85 48.6
implementation of joint Negative, as it can cause problems such as "brain
research programs with drain" and increase the economic and cultural
European universities have on dependency on the collaborating countries 0.0
the research systems in your Other 1 0.6
own institution and country? Not responding 9 5.1
Total 175 100.0
30Physical mobility of students to/from a foreign
university 25 14.3
Physical mobility of academics to/from a foreign
university 66 37.7
14. In your opinion, which of
Virtual mobility of students to/from a foreign
the following could most 11 6.3
university
improve international Virtual mobility of academics to/from a foreign
collaboration? university 22 12.6
Jointly awarded degrees between my university and
other universities 44 25.1
Opening of foreign university branches and offshore
campuses in my country 6 3.4
Not responding 1 0.6
Total 175 100.0
The third part of the survey regarded respondents’ family background and social condition. In
order to estimate the standard of living in students’ households, other questions were posed
concerning the availability of internet at home (widespread: question 28), widely common among
respondents (question 26), the command of the most common European languages (question 27),
and above all, the family situation where emerges that almost the 70% of the interviewed is
married and the 45% of them declares to have a family composed of two or three components
(questions 28, 29) financially dependent by them.The analysis of social conditions Is completed by
data on parental education levels and professional background.
As regards parents’ level of education (questions 30 and 31), there emerge findings that resemble
those involving students. A tertiary level degree is common both for fathers (32.6%) and mothers
(30.3%), and secondary school degrees are also very common among other parents. The last
indicator considered is parents’ current or former professional status (questions 32 and 33): a
good number of researchers have parents who are or were employed in medium‐low positions, as
blue collars or in clerical work. This suggests that current researchers have enjoyed a process of
upward social mobility, unlike students whose social origins seem to be higher.
In conclusion, even among researchers there is a positive attitude towards forms of international
cooperation and establishment of enduring links with the European higher education area.
Nevertheless major constraints for the effective realization of such projects derive from issues
related with family constraints (i.e. the impossibility to move having families composed by
two/three components financially dependents) that in some way may limit potential for physical
mobility (even if it strongly desired by respondents), thus paving the way for alternative forms of
cooperation such as joint degrees and virtual mobility.
31C. RESEARCHERS’ SOCIAL CONDITIONS AND FAMILY N %
BACKGROUND
Yes, from home 95 54.3
Yes, from work 43 24.6
26. Do you have regular access 33 18.9
Yes, from the university
to the Internet and, if so, from
Not responding 3 1.7
where mostly?
Yes, from other places 1 0.6
Yes, from an Internet cafe 0 0.0
No 0 0.0
Total 175 100.0
English 139 79.4
27. Do you have a good Spanish 131 74.9
working knowledge of the
French 34 19.4
following languages?
Dutch 2 1.1
(multiple choice question)
German 6 3.4
Other 21 12.0
Single 43 24.6
Cohabitation with life partner / Married 121 69.1
28. What is your marital
Separated / Divorced / Widowed 10 5.7
status?
Not responding 1 0.6
Total 175 100.0
Only myself 46 26.3
One person, besides myself 31 17.7
29. How many family members
Two persons, besides myself 39 22.3
depend on you financially?
Three persons, besides myself 40 22.9
Four or more persons, besides myself 16 9.1
Not responding 3 1.7
Total 175 100.0
None or primary education 48 27.4
30a. What is the highest level Secondary education 58 33.1
of the formal education your University degree 57 32.6
father completed? Don't know or not applicable 10 5.7
Not responding 2 1.1
Total 175 100.0
Caribbean 34 59.6
30b. Where did he obtain his Latin America 11 19.3
highest level of education? United States 6 10.5
Continental Europe 3 5.3
United Kingdom 1 1.8
Asia 1 1.8
Not responding 1 1.8
Australia or New Zealand 0 0.0
Total 57 100.0
32None or primary education 53 30.3
31a. What is the highest level Secondary education 64 36.6
of formal education your University degree 53 30.3
mother completed? Don't know or not applicable 3 1.7
Not responding 2 1.1
Total 175 100.0
Caribbean 36 67.9
Latin America 7 13.2
United States 3 5.7
31b. Where did he obtain his Continental Europe 3 5.7
highest level of education? United Kingdom 2 3.8
Asia 1 1.9
Not responding 1 1.9
Australia or New Zealand 0 0.0
Total 53 100.0
Self‐employed 178 43.2
Liberal profession, entrepreneur (with at least 15
employees) 31 7.5
Entrepreneur (less than 15 employees), craftsman,
32. What is your father’s shopkeeper 57 13.8
occupation (or what was his Other self‐employed 90 21.8
final occupation if he no longer Employed 213 51.7
works)? High‐level manager, salaried professional 41 10.0
Mid‐level manager, white‐collar 56 13.6
Clerical worker 38 9.2
Blue‐collar, manual laborer 78 18.9
[8] Never held a paid job 11 2.7
Not responding 10 2.4
Total 412 100.0
Self‐employed 106 25.7
Liberal profession, entrepreneur (with at least 15
employees) 10 2.4
Entrepreneur (less than 15 employees), craftsman,
33. is your mother’s occupation shopkeeper 50 12.1
(or what was her final Other self‐employed 46 11.2
occupation if she no longer Employed 260 63.1
works)? High‐level manager, salaried professional 46 11.2
Mid‐level manager, white‐collar 63 15.3
Clerical worker 72 17.5
Blue‐collar, manual laborer 79 19.2
[8] Never held a paid job 41 10.0
Not responding 5 1.2
Total 412 100.0
33You can also read