Philadelphia's Municipal Clean Fleet Plan - October 2021 - Phila.gov
←
→
Page content transcription
If your browser does not render page correctly, please read the page content below

Philadelphia’s Municipal
                     Clean Fleet Plan
                                             October 2021

CONNECT: Philadelphia’s Strategic Transportation Plan       1
2 City of Philadelphia
Table of Contents
                                                          Abbreviations, Acronyms, and Definitions    4

                                                          Executive Summary				                      6

                                                          Introduction 		          			               10

                                                          Current Fleet and Procurement Process      11

                                                          Alternative Fuels and Vehicles 			         16

                                                          Vehicle and Fueling Recommendations        33

                                                          Electric Vehicle Supply Equipment (EVSE)   40

                                                          EVSE Recommendations                       50

                                                          Conclusion			                              54

                                                          Appendices					 54

CONNECT: Philadelphia’s
Philadelphia’s Municipal Clean
                          Strategic
                               FleetTransportation
                                     Plan          Plan                                               3
Abbreviations, Acronyms,
and Definitions
Electric Vehicle (EV): A vehicle powered at least in part by electricity, usually from an on-board battery – a
Battery Electric Vehicle (BEV), Plug-in Hybrid Electric Vehicle, or (rarely) a Hybrid Electric Vehicle (HEV).

        Battery Electric Vehicle (BEV): A vehicle solely powered by electricity which has no internal
        combustion engine. It must be charged from a utility power supply and includes regenerative
        braking technology. An example of this vehicle would be the Chevrolet Bolt.

        Hybrid Electric Vehicle (HEV): A vehicle with an internal combustion engine (ICE) which runs on
        gasoline or diesel. The vehicle has a regenerative braking system which captures energy as it
        slows down, stores it in a small battery, and then uses it to provide a boost to the vehicle upon
        subsequent acceleration. All power for the vehicle originates from gasoline or diesel. The hybrid
        technology only serves to improve fuel efficiency. An example of this vehicle would be a Toyota
        Prius.

        Plug-in Hybrid Electric Vehicle (PHEV): A vehicle with the features of the HEV except the onboard
        battery is slightly larger and can be charged from a utility power supply while parked. Thus, these
        vehicles can be powered by gasoline or directly by grid charging. An example of this vehicle would
        be a Ford Fusion Energi.

Electric Vehicle Supply (or Support) Equipment (EVSE): A free-standing or mounted piece of equipment
which supplies electric energy from a power source for the safe resupply (charging) of electric vehicle
(EV) batteries. Typically referred to as charging stations with one of more units/’heads’ or ports, EVSE is
often categorized by level which specifies the voltage input. For the City’s immediate purposes, levels are
simplified as follows: Level 1 (AC, alternating current) at 120V; Level 2 AC at up to 240V; and Level 3 (DC,
direct current) at 400-600+V. The most popular types of charging/plug connectors are the SAE J1772 for
Level 1 and 2 charging, and CHAdeMO or CCS for Level 3 charging.

EV-Capable Space: Capable of future Level 2 charging infrastructure installation. Installed electrical panel
capacity and space to support a minimum 40-ampere, 208/240-volt branch circuit for each parking space
and the installation of continuous raceways, from the panel to the intended EV parking space. Foundational
electrical capacity installed but lacks conduit to an electrical outlet with required voltage and amperage.

EV-Ready Space: A parking space with installed electrical panel capacity (EV-Capable, as above) for future
Level 2 charging infrastructure installation, in close proximity to a conduit terminating in a junction box (with
service loop) or a 240-volt charging outlet. Ready for installation of charging station equipment to supply
electrical power for an EV. Overcurrent protection devices are also recommended.

EVSE-Installed Space: A vehicle parking space with completed EV-Capable and EVSE-Ready work, with
fully operational Level 2 charging station already installed.

4                                                                                               City of Philadelphia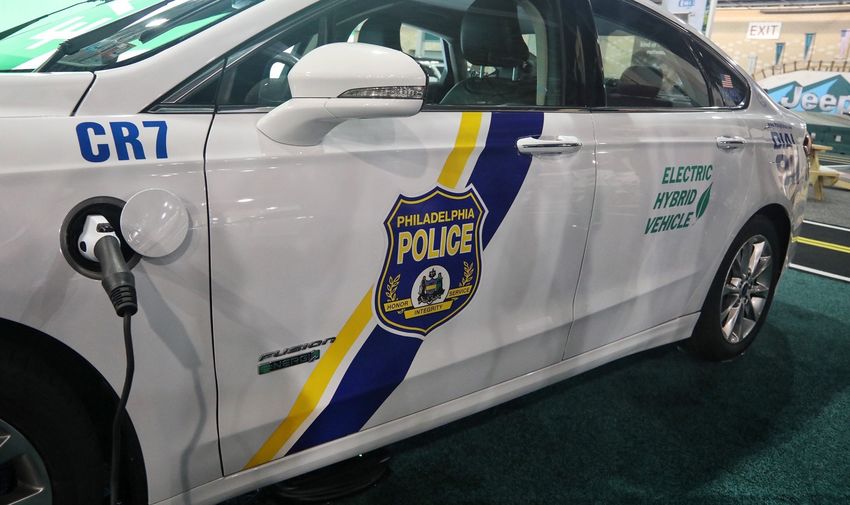
Fossil-Fuel-Free (F3): As per the City of Seattle Green Fleet Plan – ‘Liquid fuels that are renewable
hydrocarbon biofuels (also called “green” hydrocarbons, bio-hydrocarbons, drop-in biofuels and
sustainable or advanced hydrocarbon biofuels).’

Internal Combustion Engine (ICE) vehicle: A vehicle whose propulsion is powered by the combustion
(burning) of fuel and oxidant which produces heat and power – as well as carbon monoxide, nitrogen
oxides, hydrocarbons, other pollutant vapors, and greenhouse gases.

Metric Tons of Carbon Dioxide Equivalents (MTCDE or MT CO2e): A metric measure used to compare
the emissions from various greenhouse gases based on their global warming potential.

CONNECT: Philadelphia’s
Philadelphia’s Municipal Clean
                          Strategic
                               FleetTransportation
                                     Plan          Plan                                            5
Executive Summary
Background and Context

In January of 2021, Mayor Jim Kenney announced Philadelphia’s commitment to achieving carbon neutrality
by 2050, along with the release of the City of Philadelphia’s Climate Action Playbook. This goal requires the
elimination of emissions in the buildings, energy, transportation, and waste sectors by 2050 and is in line
with what experts indicate is needed to prevent the worst effects of climate change.

Nationally, transportation is the largest source of carbon emissions. This is why the Biden Administration has
prioritized vehicle electrification in its efforts to address climate change and to protect and grow American
jobs. Government agencies around the country are transitioning their fleets and seeing the benefits of
doing so, including major operational savings. Auto manufacturers are also getting in the game, such as
General Motors who announced their plans to stop making gas-powered cars by 2035

The City of Philadelphia’s Municipal Clean Fleet Plan lays out a strategy to transition the City’s fleet- which
represents around 13% of the municipal government’s carbon footprint- to clean and electric vehicles. This
transition will allow the City to lead by example in reducing carbon pollution. But additionally, the transition
will allow the City to achieve cost savings, to support local job creation, and to enhance Philadelphia’s
competitiveness among peer cities.

It is no small feat to transition a large fleet that serves many functions. This Plan provides guidance
and recommendations that will ensure the City’s fleet transition is cost-effective and results in tangible
outcomes. An overview of the recommendations is provided in the Action Plan below.

This Plan is the culmination of multiple analyses which considered the City’s current fleet, its vehicle and
supporting infrastructure procurement projections, the current electric vehicle market, and future trends
in transportation electrification. The plan draws heavily from reports produced by two city consultants
(Wilson Engineering Services/WES, see Appendix B; and ICF’s Infrastructure Analysis, see Appendix C)
which reviewed the 2020 market for vehicles and fuels and made projections on charging infrastructure
needs to support a zero-emissions fleet. The plan is also supported by regional efforts like Pennsylvania’s
participation in the multi-state Memorandum of Understanding on medium- and heavy-duty electric
vehicles and the Pennsylvania Department of Environmental Protection’s Alternative Fuels Incentive Grant
(AFIG) program.

Action Plan: Clean Fleet Recommendations

The following provides a summary of the recommendations outlined within the body of this Clean Fleet
Plan, for both fleet vehicles and necessary supply infrastructure. The Plan prioritizes the electrification of
Philadelphia’s fleet to achieve reduced operating costs and emissions, in line with the City’s goal for carbon
neutrality by the year 2050.

6                                                                                              City of Philadelphia
1. Adopt goals for the fleet that will provide a pathway to zero emissions:

       •   By 2025, lay out a procurement strategy to achieve 100% procurement of EVs for sedans, sport
           utility vehicles (SUVs), vans, and light duty pickup trucks by 2030.

       •   By 2030, reduce light- and medium-duty vehicle emissions by at least 45% from 2019 levels by
           transitioning to zero-emissions electric vehicles (EVs).

       •   Procure no new fossil-fuel consuming vehicles after 2030

  2. Institute a Clean Fleet Procurement Policy

       This procurement policy will support the above goals by establishing a vehicle procurement hierarchy
       that prioritizes battery electric vehicles (fairly strictly for light- and medium-duty vehicle classes) and
       discourages gas- and diesel-fueled vehicles (with some flexibility for heavy-duty classes). The policy
       would also aim to reduce the overall size of the fleet and the share of SUVs.

  3. Limit procurement of medium and heavy-duty vehicles in the short term; pilot new fuels or
  procure CNG vehicles where feasible

       This recommendation is meant to support achievement of the procurement targets listed as part
       of #1 above, and to move towards piloting new fossil-free fuels including electricity, hydrogen, and
       renewable diesel, and to scale them when effective.

  4. Conduct an EV suitability assessment

       Using fleet telematics and data analysis is a best practice for supporting data-driven fleet electrification
       on a mass scale. For example, an EV suitability assessment conducted for the City of Columbus,
       OH informed its deployment of over 300 electric vehicles between 2018 and 2020, along with the
       required charging infrastructure.

  5. Establish a Clean Fleet Committee (CFC) to support infrastructure coordination and to track goals

       This Committee will track progress and refine implementation of the Plan. It would meet at least
       semiannually and include representatives from Office of Fleet Management; Procurement
       Department; Office of Transportation, Infrastructure, and Sustainability; Department of Public
       Property; the Office of Sustainability / Energy Office; Fleet Liaisons from various departments. and
       other stakeholders as needed.

  6. Develop funding programs to connect capital procurement and fuel cost/operational savings

       Capturing and tracking data as the City fleet progresses towards electrification will be essential for
       demonstrating success. Accrued vehicle fuel and maintenance savings should be used to offset
       the price differential between an internal combustion engine (ICE) vehicle and its comparable EV
       equivalent in future procurements.

  7. Optimize Alternative Fueling and EVSE Infrastructure

       •   Moderately expand compressed natural gas (CNG); focus on deploying renewable natural gas
           (RNG) – The City should explore ways to procure RNG for its current CNG-fueling facility, which
           should be expanded to its full capacity.

CONNECT: Philadelphia’s
Philadelphia’s Municipal Clean
                          Strategic
                               FleetTransportation
                                     Plan          Plan                                                          7
•   Evaluate E85 or B20 Fueling Locations – Consolidate flex-fuel capable vehicle refueling to E85/
          B20 fueling locations.

      •   Consolidate Alternative Fuel infrastructure and EVSE management under a single department
          and expand staffing support appropriately – Currently, EVSE is installed and managed by the
          department owning the EV. There is no coordinated strategy for EVSE deployment or use. Given
          the cross-cutting nature of plan implementation, the Managing Director’s Office should oversee the
          Clean Fleet Committee and designate that body to manage all aspects of EVSE with appropriate
          staffing. A full time staff position should be hired as soon as possible, but no later than FY23.

      •   Develop an EVSE deployment scenario; expand dual-port Level 2 charging availability at locations
          – The Clean Fleet Committee should use the EV Charging Infrastructure Analysis Tool to complete
          a 10-year EVSE deployment framework and begin expanding EVSE installation immediately. The
          City is encouraged to simplify and streamline its internal EV charging infrastructure permitting
          process to facilitate this rapid infrastructure buildout, and also to require new and renovated
          municipal facilities to be ‘EV-ready’ in order to minimize the costs of installing charging infrastructure
          at those sites in the future.

Emissions Impacts of Recommended Targets

In 2017, light and medium duty vehicles, which are the fleet’s primary users of gasoline, emitted 26,441
Metric Tons CO2e, or slightly over half of the city fleet’s greenhouse gas emissions (see Wilson Engineering
Services/WES Report, Appendix B). If the City of Philadelphia achieves 100% procurement of clean energy
for municipal operations by 2030 and adopts the recommended targets for light and medium-duty vehicle
electrification, greenhouse gas (GHG) emissions for the light and medium duty fleet are estimated to
decline by 47%.

            Table 1. Estimated Fuel Reduction and Emissions Impacts of Recommended Targets

                      2021    2022     2023     2024     2025      2026      2027      2028       2029         2030

Gallons Gasoline
                     20,000   49,000   53,000   87,000   147,000   218,000   376,000   687,000   1,068,000    1,429,000
Avoided Annually

Metric Tons CO2e
                       148     369      409      670      1,146     1,707     2,955     5,416      8,424        11,281
Avoided Annually

% Reduction
of CO2e from
                      0.5%     1.3%     1.5%     2.4%     4.2%      6.2%      10.9%     20.1%      31.6%        42.7%
‘17 Baseline for
Gasoline Vehicles

8                                                                                                     City of Philadelphia
Cost Impacts of Recommended Targets

Tables 11 and 12 highlight the projected total costs for the vehicle purchasing scenario illustrated between
2021 and 2030, with and without state incentives. Based on available vehicle model prices and projected
cost trends, BEV sedans are projected to reach cost parity with conventional vehicles by 2025, whereas
electric SUVs, pickup trucks, and vans are projected to remain more expensive than conventional vehicles
through 2030. All cost assumptions are documented at the end of this section.

Based on the cost assumptions documented at the end of this section, it’s estimated that the vehicle
electrification scenario articulated in this Plan would incrementally cost the city $7M between 2021 and
2030 in capital costs, and save the city $2.5M in operating costs over that same time period. If the city could
leverage available state incentives through the AFIG and Driving PA Forward programs, the city could
potentially save on capital costs in the same time period.

EV Charging Considerations

The City’s strategy around siting and deploying vehicle charging equipment should focus on ‘future-
proofing,’ or meeting the needs of electric vehicles that will join the fleet not just imminently but in the
longer term. It is recommended that the City consolidate and reduce installation costs as much as possible
by installing the total required electrical capacity and conduit during the first set of installments.

The Infrastructure Analysis confirms that a 2:1 vehicle-to-plug equipment sharing would effectively cut
project costs in half (as opposed to a 1:1 vehicle-to-charger ratio), but there still exist logistical challenges
associated with sharing charge ports between vehicles, at least in the near term. To improve this type of
analysis moving forward, it is recommended that the City collect parking location data from more fleet
vehicles. Fleet telematics capture, as part of an EV Suitability Assessment, would satisfy this data need.

CONNECT: Philadelphia’s
Philadelphia’s Municipal Clean
                          Strategic
                               FleetTransportation
                                     Plan          Plan                                                        9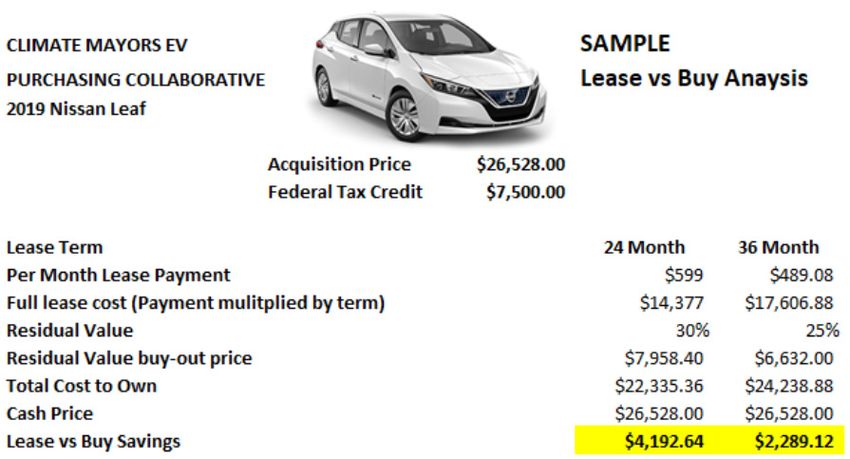
Introduction
The fundamental role of the City of Philadelphia is to provide essential services and amenities to
Philadelphians. The City pumps clean drinking water to residents, collects garbage and recycling, maintains
a system of parks, and much more. Yet, none of this would be possible without a highly diversified fleet
of municipal vehicles or the tireless work of the Office of Fleet Management (OFM), which procures and
services these vehicles across 43 City departments.

The municipal fleet deserves significant attention because it represents both an asset and liability. The
vehicles are critical because they enable tasks that allow the City to successfully function. But the fleet also
costs the City significant sums of money in terms of upfront procurement costs and ongoing maintenance
and fueling. More critically, the current fleet, which runs almost exclusively on gasoline and diesel, is a
significant emitter of carbon and other dangerous pollutants. Although low- and zero-emission vehicle
technologies have been around for decades, they have not always been widely commercially available
or viable. However, the future is set to be electric, with more and more auto-manufacturers debuting all-
electric vehicle models and committing to phasing-out combustion-engine vehicle production within
the next one or two decades. As these vehicles become more mainstream, and the impetus to improve
air quality and reduce greenhouse gas (GHG) emissions from City operations becomes more pressing,
it is essential that the City reassesses its procurement opportunities with the goal of keeping pace with
industry-wide shifts by incorporating these low-emissions technologies into the City fleet.

This Municipal Clean Fleet Plan is based on the latest available data from OFM on the City’s vehicle
composition, and seeks to provide a more robust view of how OFM can procure vehicles which pollute less,
have lower maintenance and fueling costs, and act as a beacon of sustainability for all of Philadelphia. This
plan draws heavily from reports produced by two city consultants (Wilson Engineering Services/WES, see
Appendix B; and ICF’s Infrastructure Analysis, see Appendix C) which review the 2020 market for vehicles
and fuels and make projections on charging infrastructure needs to support a zero-emissions fleet. ICF
additionally developed a Charging Infrastructure Analysis Tool to support this Clean Fleet Plan, for which
they conducted EV charging equipment location analysis based on parking location data available from
the City. Using more current data to analyze immediate fleet electrification opportunities and associated
carbon-emissions savings across all vehicle classes, the Dashboard for Rapid Vehicle Electrification (DRVE)
Tool was also deployed — this report can be found in Appendix A.

Philadelphia’s municipal fleet represents about 13% of the City’s carbon footprint due to its reliance on fossil
fuels. By transitioning away from fossil fuel-powered vehicles and being more thoughtful about efficient
vehicle procurement and how this matches operational needs, the City will be one step closer to meeting
its goal of becoming carbon neutral by 2050.

The City of Philadelphia Clean Fleet Plan recommends pursuing an electrification procurement schedule,
which would allow the City to pursue a 100% EV procurement plan by 2030, generating up to $12,000,000
in total cost and operational savings; a 20% savings compared to a continued procurement plan of internal
combustion engine-only vehicles.

10                                                                                             City of Philadelphia
Current Fleet and
Procurement Process
Fleet Makeup

As of January 2020, the City of Philadelphia owned a fleet of approximately 5,500 vehicles which assist City
workers in performing a variety of services. These vehicles are spread across 43 departments within the
City and vary in terms of vehicle class and fuel type (Figure 1 and Figure 2).

                                         Figure 1. Vehicle Count by Department

                                           Figure 2. Vehicle Count by Class Size

CONNECT: Philadelphia’s
Philadelphia’s Municipal Clean
                          Strategic
                               FleetTransportation
                                     Plan          Plan                                                  11
Three key takeaways from these figures:
1. Light-duty trucks comprise almost double the number of sedans, and many could be right-sized
to allow for electrification. While sedans present an immediate and easy opportunity to transition to
electric vehicles, they are only 6.8% of the (non-Police) fleet. Over 11% of the City fleet consists of light-
duty trucks (Class 1-2a), the smallest and lightest of trucks which are rarely used for towing and hauling.
Pursuing vehicle right-sizing exercises with the light-duty trucks is an opportunity to further transition
some of these to smaller vehicles more suited for electrification. Additionally, auto manufacturers
are preparing to debut several electric truck models (light-duty and otherwise), which bodes well for
electrification of this vehicle class in the next 3-5 years.
2. SUVs may also benefit from vehicle right-sizing exercises. The share of SUVs in the fleet has grown
significantly in the past decade, from about 14% in 2010 to over 19% in 2020. SUVs are heavier vehicles
and use more fuel per mile than a sedan, thereby reducing the average fuel efficiency of the fleet, even
if transitioned to cleaner vehicles. Identifying opportunities to right-size these SUVs to lighter-duty,
more fuel-efficient vehicles — without impacting service delivery — presents an opening to significantly
decrease fuel consumption through electrification. Reducing the number of SUVs in the city fleet
(transitioning these vehicles to sedans as possible) also provides an opportunity for Philadelphia to
lead by example with respect to the Office of Transportation and Infrastructure Systems’ (oTIS) Vision
Zero goals. SUVs are more often involved in crash fatalities and injuries, and calls are growing to limit
the size and scope of these larger vehicles on city streets.
3. Police and other emergency vehicles are considered separately from other vehicles and are a
significant share of the fleet. These vehicles are considered in their own category, since compromising
on performance or responsiveness may directly lead to public safety issues. They often have longer
and more erratic duty cycles and may require special consideration when transitioning to alternative
fuels. While their special operational needs must be considered, their large share of the fleet indicates
that they too will eventually need to transition in order for the City to reach its climate goals.
Along with vehicle right-sizing exercises, efforts to downsize the fleet by leveraging alternative transport
options for city staff — such as the city contract for car-sharing services or pre-tax transit benefits that staff
may use in lieu of pool vehicles — can also help eliminate underutilized fleet assets. These strategies can
provide an avenue to increase efficiency, as well as the number of electric miles travelled by staff (if the
car-share service includes electric vehicles).
12 City of PhiladelphiaOverview of the Fleet Vehicle Lifecycle
This section describes the key steps in a City fleet vehicle’s lifecycle, for both conventional internal
combustion engine (ICE) vehicles and electric vehicles.
Table 2. Fleet Vehicle Lifecycle Comparison
Internal Combustion Engine Electric Vehicles (EVs)
(ICE) Vehicles
Departments have “fleet liaisons” which relay
the needs of staff to OFM, which then uses
Procurement The same as ICE Vehicles.
capital funds from its budget to procure the
vehicles requested by these liaisons.
The Department of Public Property (DPP)
Departments use vehicles — these are
pays for electricity. EV charging stations are
either assigned to a specific staff member or
procured, and the department receiving the
pooled across a department — to meet their
Use EV is responsible for installation of the charging
operational needs. With funding from OFM’s
equipment. The electricity supply for the
operating budget, drivers fill up their tanks at
vehicle is not sub-metered, it is included in the
City-owned fueling sites.
whole building mix.
OFM employs in-house mechanics to ensure
vehicles perform optimally and complete The same as for ICE vehicles. OFM has specific
Maintenance & Repairs
necessary repairs. OFM may also contract out shops and trained staff who can work on EVs.
for services.
OFM “flags for retirement” vehicles based on
The same outlet as for ICE vehicles (auction),
age, mileage, parts availability problems and
though it is recommended that warranty
life-to-date maintenance cost. After a unit is
coverage (currently at least 8 years/100,000
flagged it still remains active, though it’s closely
miles) be the primary driver for EV replacement
examined when maintenance work is done.
Retirement cycles. This is a good way to protect against
A flagged vehicle will only be relinquished if
any battery defect, and vehicles that sill have
it requires a major repair, such as an engine
12 months or more of factory warranty left will
failure, transmission failure, rear differential
fetch significantly more at auction than like
failure, or collision damage. These vehicles are
models that are out of the warranty period.
then sold at auction.
Fleet Fuel Use and Emissions
Certain offices and departments use more fuel than others to provide their services, with fuel use intensity
being highest in departments which utilize heavy duty vehicles, such as Streets and Fire. Table 3 shows
fuel use consumption and associated emissions for each of the top 13 fuel-consuming City departments.
These departments represent 98% of all fuel consumption by the City. Based on the corresponding 2017
City Government GHG Inventory (see Appendix B, Table 3), the municipal fleet represents about 13% of the
City’s carbon footprint due to its reliance on fossil fuels. See Appendix B for more information on vehicle
ownership patterns among the 13 departments with the greatest vehicle use based on fuel consumption.
CONNECT: Philadelphia’s
Philadelphia’s Municipal Clean
Strategic
FleetTransportation
Plan Plan 13Table 3. Top Fuel Consuming Departments in Descending Order by Total Gallons (2017)
Total Gallons
Average Number of Gallons Per
Department Vehicle Age (Gasoline & MTCDE
Vehicles Vehicle
Diesel)
Police 4 1,926,224 1,556 1,238 15,264
Streets 6 1,539,764 811 1,899 14,387
Water 6 768,358 896 858 6,693
Fire 8 638,514 354 1,804 5,952
Parks & Recreation 8 219,170 318 689 1,853
Commerce/ Division of Aviation 9 200,006 310 645 1,729
Fleet Management 11 109,342 116 943 913
Managing Director’s Office 7 89,976 131 687 757
Human Services 6 69,989 105 667 553
Sheriff’s Office 5 68,734 69 996 564
Prisons 6 62,978 67 940 508
Public Health 6 53,840 117 460 429
Public Property 6 51,374 82 627 421
Key Takeaways
• Data on annual vehicle miles driven was not available, which would shed more light on the level of
vehicle utilization in each department. However, this chart still provides a good indication of the
range of fuel savings and GHG emissions reductions that could be achieved by the replacement
of a single vehicle with a more efficient vehicle.
14 City of Philadelphia• Excluding in total the Police/Fire/Sheriff’s Departments, which have an outsized effect given their
fuel intensity, 45% of the City’s emissions are accounted for in the table. The Police and Sheriff
Departments’ fleets have the shortest average vehicle replacement times, and so these should be
evaluated closely year-over-year for opportunities to transition to electric. Given the fuel intensity
of the Police Department, and market developments which continue to maximize EV range and
performance with respect to the operational needs for this department’s vehicles, electrification of
the Police fleet is something that should be anticipated, not dismissed. Other police departments
have successfully introduced electric vehicles into their fleets, such as Holland, MI; Eden Prairie,
MN; Windham County, VT; Logan, OH; Bargersville, IN; Westport, CT; Hyattsville, MD; Hastings-on-
Hudson, NY; Spokane, WA; and Brookhaven, GA, to name a few.
• Both the Water Department and Parks and Recreation Department present good opportunities
for vehicle electrification, given their fuel use intensity and average vehicle age. In other cities, these
departments have traditionally been one of the first to adopt electric vehicles, given the associated
applications, vehicle size, average vehicle age, and opportunity for leadership with zero-emission
vehicle deployment given those departments’ roles.
• Outside of the Sheriff’s Office, the Police Department, and the Fire Department, the Streets
Department presents the largest fuel use intensity (gallons per vehicle per year), which translates
to the biggest opportunity for GHG savings through fleet electrification. This department utilizes many
heavy duty vehicles, so maximizing the electrification opportunities in this fleet stands to improve the
Department’s overall emissions and fuel intensity. The same rationale applies for departments with
longer average vehicle ages, such as Commerce/Aviation, or the Office of Fleet Management. The
Office of Fleet Management also deploys many SUVs, providing another good reason to explore
aggressive electrification.
Additionally, the City’s gasoline and diesel costs have risen by $2.3M dollars in the three years from 2017-
2020, despite seeing a net decrease in consumption over that time. Between the years in question, the
fleet added about 100 new vehicles while gasoline and diesel prices rose by an average of $0.60/gallon.
Table 4. City of Philadelphia Gasoline and Diesel costs (2017, 2020)
2017 2020
Gallons Cost Gallons Cost
Gasoline 4,064,843 $6,357,330 3,838,215 $7,537,575
Diesel 3,087,162 $4,919,464 2,758,168 $6,048,706
Total 7,152,005 $11,276,794 6,596,383 $13,586,280
Total Change - 555,622 $2,309,486
% Change - 7.8% 20.5%
Efficiency is the hallmark of cost-savings, and this mantra must be prioritized by sizing vehicles appropriately
for their duties, reducing the city’s overall fleet size, and reducing the use of price-volatile fuels. Employing
electricity as a widely-used transportation fuel is more efficient and supports domestically produced
energy which is free from the national security risks posed by price-volatile international markets.
CONNECT: Philadelphia’s
Philadelphia’s Municipal Clean
Strategic
FleetTransportation
Plan Plan 15Alternative
Fuel & Vehicles
Various fuels differ in terms of associated emissions, cost, energy density, supply, infrastructure needs,
extraction and refinement methods, and geographic availability, amongst other factors. GHG emissions
from transportation fuels were evaluated on the basis of Scope 1 and Scope 2 emissions, in accordance
with the Climate Registry and the GHG Protocol Corporate Standard. Scope 1 is defined as carbon dioxide
equivalents emitted due to direct combustion at the point of use. Scope 2 is defined as emissions due
to purchase of grid electricity.
While electricity ranks among the lowest for net Scope 1 and Scope 2 GHG emissions (see Appendix B),
it is critical to note that electric vehicles have Scope 2 emissions because EVs charge from the electricity
generated in the immediate grid region, which contains natural gas and coal plants. Yet, when the City
sources electricity solely from renewable energy — which is the City’s goal by 2030 — electric vehicle
Scope 2 emissions would essentially drop to zero. Despite currently having Scope 2 emissions, EVs are
still found to produce at least 68% fewer GHG emissions than gasoline vehicles in Pennsylvania.
Figure 3. Electricity Sources and Emissions – Averages for Pennsylvania
Source: Alternative Fuels Data Center
Clean transportation fuels are also evaluated on the basis of lifecycle emissions using pathways certified
by the California Low Carbon Fuel Standard (LCFS). Figure 4 shows the GHG emissions for each fuel
relative to the energy content of the fuel, adjusted for the energy efficiency ratio (EER) of the vehicle. In
general, EER is an apples-to-apples comparison of emissions per energy unit. For liquid and gaseous fuel
sources, total energy content (measured in British Thermal Units, BTUs) in each relative unit is converted.
16 City of PhiladelphiaThe possible negative emissions from certain compressed natural gas (CNG) pathways are based on
using renewable natural gas (RNG) produced by an anaerobic digester processing animal waste, which
otherwise would have created uncontrolled methane emissions during decomposition. However, there
exists a very limited supply of renewable natural gas (RNG) from waste — and when used in vehicles,
natural gas provides limited climate benefits compared with diesel. Fueling heavy-duty trucks with RNG
instead of diesel still involves the combustion of methane in the vehicle, emitting carbon dioxide, carbon
monoxide, and nitrogen oxides. Anaerobic digesters also leak methane, at a rate of between 2 and 3
percent — a 2012 study by the National Academy of Sciences found that, if the leakage rate in natural gas
pipelines exceeds 1.4%, the climate benefits of switching from diesel to RNG are negated. See Appendix
B, for more information on the alternative fuel technologies evaluated for Philadelphia.
Figure 4. EER Adjusted Carbon Intensity for Selected Transportation Technologies
Note: Data from CA LCFS certified pathways as of 11/5/2019. EERs obtained from the CA LCFS Credit Price Calculator version 1.3.
EER based on LCFS default values of 1 for gasoline, ethanol, and diesel, 0.9 for propane replacing diesel, 1 for CNG and LNG used
in a heavy duty compression ignition engine, 5 for an electric heavy duty vehicle, and 1.9 for a hydrogen fuel cell heavy duty vehicle.
Electricity emissions are based on usage in CA: the high value for electric represents the default CA grid while the lower values
represent wind or solar derived electricity. Ethanol and biodiesel blends will have a blended carbon intensity.
CONNECT: Philadelphia’s
Philadelphia’s Municipal Clean
Strategic
FleetTransportation
Plan Plan 17Currently, only a small percent of the City’s fleet runs on alternative fuels, including EVs, CNG, and 85%
E85. Table 5 lists the alternative fuel vehicles in the City’s fleet. Although the City has many flex fuel
vehicles that can use E85, it is assumed these vehicles are fueled with conventional E10 gasoline.
Table 5. Alternative Fuel Vehicles in Philadelphia Fleet
Fuel Type Count
E85 1,227
Hybrid EV (HEV) 394
Battery EV (BEV) 49
Plug-In Hybrid EV (PHEV) 33
CNG 16
In terms of individual vehicles, analysis revealed that the City’s FY 2019 combined hybrid-electric
(HEV) and battery-electric vehicles (BEV) purchases (103 vehicles total) reduced the City’s annual GHG
emissions by 305 MTCDE, approximately 0.6% of the City’s total vehicle emissions as of 2017. This offset
is an estimate based on the average GHG emissions of all gasoline vehicles in the fleet — including
police cars — and it does not take into account the specific departments or use cases of these new
vehicles. See Table 6 below, which provides an example of the amount of annual GHG emissions offset
with the purchase (or retrofit) of a single light-duty gasoline vehicle using selected clean transportation
technologies.
Table 6. Annual GHG Reduction Potential for Light Duty Vehicles
Measure GHG Savings MT CO2e Avoided Per Vehicle
BEV 70% 5.2
Anti-Idle 5% 0.4
E85 35% 2.6
HEV 37% 2.7
The City purchased its first hybrid-electric vehicle (HEV) in 2004 and has steadily increased annual
purchases of this vehicle type. In FY19, the City purchased 93 HEVs, making it their highest annual HEV
purchase year. In FY14, the City acquired its first Plug-in Hybrid Electric Vehicle (PHEV), and in FY18,
the City acquired its first Battery-Electric Vehicle (BEV). Currently, the City has 394 HEVs, 49 BEVs, and
33 PHEVs in its fleet. The City also procured four CNG-fueled trash trucks and has another 21 being
delivered by summer 2021.
18 City of PhiladelphiaEV Adoption Potential and Benefits
For the majority of City departments, the percent of vehicles which are hybrid or electric is between 3%
and 8% — but the Department of Public Health (DPH) has 39% hybrid or electric vehicles, likely prompted
by the opportunity to lead by example with low-emission vehicle deployment given the department’s
public health focus. Many departmental fleets are comprised of less than 4% PHEVs and BEVs, with the
Department of Health and Department of Prisons at 12% and 8%, respectively.
EVs are a key solution to reducing both GHG emissions and operational costs associated with the City’s
fleet, most immediately for the light-duty sedans and trucks required by certain City staff. Beyond these
benefits, EVs present other long-term advantages, including:
• Cost competitiveness with comparable ICE vehicles over five-year time horizon: EV prices
have dropped significantly over the past decade. Looking at vehicle costs over the first five years
of ownership, EVs are extremely competitive with ICEs. Although capital costs will still be a factor
initially, EV technology for all light-duty classes is expected to reach price parity with comparable
ICE vehicles in the next 5-10 years.
• Reduced maintenance and upkeep: The reduced cost of upkeep is factored into the five-year
cost estimates. With fewer moving parts, EVs require less maintenance which allows these vehicles
to stay in operational rotation longer, with fewer trips to the shop. The New York City Fleet, which
has the most experience with electric vehicles on the East Coast, reported “dramatic” reductions in
maintenance costs when compared with gas, hybrid, and hybrid plug-in models after a year-long
review in 2018. Annual maintenance costs for the fleet’s all-electric vehicles ranged from $204 with
the Chevrolet Bolt to $386 with the Ford Focus Electric.
• Less fuel price volatility: Volatility and uncertainty in international oil markets lead to unstable
and higher long-term costs for operating ICEs, which can pose an economic burden on the City
in addition to a national security threat. Electricity is domestically produced (increasingly from
renewable sources like solar and wind) with low, predictable rates, which provides for cost-stable
fleet fueling free from volatile price swings to which petroleum-based fuels are especially subject.
Electricity costs are also a fraction of petroleum fuel prices, leading to a minimum of 50-56%
operational savings from fuel switching alone, in line with the Vehicle Cost Calculator from the
Department of Energy’s Alternative Fuels Data Center.
• Improved local air quality: Unlike fossil fuel vehicles, EVs have zero tailpipe emissions of air
pollutants like nitrogen oxides (NOx) and carbon monoxide (CO), which can cause or exacerbate
health-related issues, like asthma. Reduced emissions will improve local air quality and decrease
related healthcare costs for Philadelphians.
CONNECT: Philadelphia’s
Philadelphia’s Municipal Clean
Strategic
FleetTransportation
Plan Plan 19Light and Medium Duty Fleet Electrification
Procurement Research and Emissions/Cost Analysis to Support 2030 Targets
This section analyzes ambitious yet feasible targets for light and medium duty fleet electrification for
the city fleet between 2021 and 2030. Table 7 illustrates a recommended purchasing schedule that
would include procuring 100% electric sedans, station wagons, and sport utility vehicles by 2025, and
75% electric radio patrol cars, unmarked police cars, pickup trucks, van cargo and passenger vehicles
by 2030.
Table 7. Fleet EV Procurement Targets
2021 2022 2023 2024 2025 2026 2027 2028 2029 2030
Sedan and
75% 75% 75% 75% 100% 100% 100% 100% 100% 100%
Station Wagon
Radio Patrol Car 25% 25% 25% 25% 50% 50% 75% 75% 75% 100%
Unmarked
25% 25% 25% 25% 50% 50% 75% 75% 75% 100%
Police Car
Sport Utility
25% 25% 50% 75% 100% 100% 100% 100% 100% 100%
Vehicle
Pickup Truck 0% 25% 25% 25% 50% 50% 75% 75% 75% 100%
Cargo and
0% 25% 25% 25% 50% 50% 75% 75% 75% 100%
Passenger Van
The above analysis includes the 3,743 light and medium duty vehicles included in the ICF report (see
Appendix C, Table 1), and utilizes ICF’s analysis of when existing vehicles will need to be retired and
replaced (Appendix C, Table 4). The analysis also utilizes ICF’s EV eligibility criteria based on availability of
EV alternatives, excluding for example large SUVs like Tahoes and Suburbans. In total, 2,148 vehicles, or
about 60% of the light and medium duty fleet, are included in the analysis as eligible to be replaced
by an EV between 2021 and 2030.
In total, about 60% of the light and
medium duty fleet are included in the
analysis as eligible to be replaced by
20 an EV between 2021 and 2030 City of Philadelphia
Philadelphia’s Municipal Clean Fleet Plan 20Table 8 summarizes the number of EVs that would be procured per year based on the estimated vehicles
up for replacement that could be replaced by an EV, and the schedule of EV purchasing targets on page
20.
Table 8. Fleet EV Procurement Estimates Per Year
2021 2022 2023 2024 2025 2026 2027 2028 2029 2030
Sedan and
18 17 0 8 8 20 17 24 10 24
Station Wagon
Radio Patrol Car 0 0 0 0 0 0 31 106 90 48
Unmarked
11 10 4 5 7 6 34 46 20 36
Police Car
Sport Utility
12 12 4 35 37 52 73 27 115 180
Vehicle
Pickup Truck 0 6 0 0 21 8 20 32 49 68
Cargo and
0 8 0 4 17 24 11 43 97 82
Passenger Van
Total 41 53 8 52 90 110 186 278 381 438
Based on the procurement schedule outlined above, it is estimated that the light and medium duty in-
service fleet would be 44% electric by 2030. This is further illustrated in Table 9.
Table 9. EV % of In-service Light and Medium Duty Fleet
2021 2022 2023 2024 2025 2026 2027 2028 2029 2030
Sedan and
7% 13% 13% 15% 18% 25% 32% 40% 44% 52%
Station Wagon
Radio Patrol Car 0% 0% 0% 0% 0% 0% 4% 19% 32% 39%
Unmarked
2% 4% 4% 6% 7% 8% 14% 22% 26% 32%
Police Car
Sport Utility
1% 2% 3% 6% 9% 14% 21% 23% 34% 51%
Vehicle
Pickup Truck 0% 1% 1% 1% 5% 7% 11% 17% 26% 40%
Cargo and
0% 1% 1% 2% 5% 9% 11% 18% 34% 47%
Passenger Van
Total 1% 3% 3% 4% 7% 9% 14% 22% 32% 44%
CONNECT: Philadelphia’s
Philadelphia’s Municipal Clean
Strategic
FleetTransportation
Plan Plan 21By 2030, the recommended targets are
estimated to reduce light and medium
duty fleet GHG emissions by 47%
Emissions Impacts of Recommended Targets
In 2017, light and medium duty vehicles, which are the fleet’s primary users of gasoline, emitted 26,441
metric tons of CO2e, or slightly over half of the city fleet’s greenhouse gas emissions (see WES Report,
Appendix B, Table 4). Based on the assumptions outlined in the upcoming sections, including the City’s
procurement of 100% clean energy for municipal operations by 2030, the following table summarizes
the estimated emissions impacts of the recommended targets. By 2030, the recommended targets are
estimated to reduce light and medium duty fleet GHG emissions by 47%.
Cost Impacts of Recommended Targets
Tables 11 and 12 highlight the projected total costs for the vehicle purchasing scenario illustrated on page
21. between 2021 and 2030, with and without state incentives. Based on available vehicle model prices and
Table 10. Estimated Fuel Reduction and Emissions Impacts of Recommended Targets
2021 2022 2023 2024 2025 2026 2027 2028 2029 2030
Gallons of
Gasoline
20,000 49,000 53,000 87,000 147,000 218,000 376,000 687,000 1,068,000 1,429,000
Avoided
Annually
Metric Tons
CO2e Avoided 148 369 409 670 1,146 1,707 2,955 5,416 8,424 11,281
Annually
% Reduction
of CO2e from
’17 baseline 0.5% 1.3% 1.5% 2.4% 4.2% 6.2% 10.9% 20.1% 31.6% 42.7%
for gasoline
vehicles
projected cost trends, BEV sedans are projected to reach cost parity with conventional vehicles by 2025,
whereas electric SUVs, pickup trucks, and vans are projected to remain more expensive than conventional
vehicles through 2030. All cost assumptions are documented at the end of this section.
Based on these assumptions, it’s estimated that the vehicle electrification scenario articulated above
would incrementally cost the city $7M between 2021 and 2030 in capital costs and save the city $2.5M in
operating costs over that same time period. If the city could leverage available state incentives through the
AFIG and Driving PA Forward programs, the city could potentially save on capital costs in the same time
period.
22 City of PhiladelphiaTable 11. Total Fleet Transition Costs, 2021-2030 - Without Incentives
Capital costs Operating costs Total costs
Total - ICE Total - EV Total - ICE Total - EV Total - ICE Total - EV
Sedan and Station Wagon $4,120,000 $4,561,000 $447,000 $256,000 $4,567,000 $4,817,000
Radio Patrol Car* - - $11,907,000 $10,498,000 $11,907,000 $10,498,000
Unmarked Police Car $5,765,000 $5,518,000 $657,000 $362,000 $6,422,000 $5,880,000
Sport Utility Vehicle $16,276,000 $19,537,000 $1,531,000 $783,000 $17,807,000 $20,320,000
Pickup Truck $7,255,000 $10,349,000 $475,000 $251,000 $7,730,000 $10,600,000
Van Cargo and Passenger $11,573,000 $12,708,000 $700,000 $390,000 $12,273,000 $13,098,000
Total $44,989,000 $52,673,000 $15,717,000 $12,540,000 $60,706,000 $65,213,000
Difference (total) $7,684,000 - $3,177,000 $4,507,000
Difference (%) 17% - 20% 7%
*Because Radio Patrol Cars are not part of the Capital Budget, their cost of purchase is included within the Operating Costs.
Table 12. Total Fleet Transition Costs, 2021-2030 - With Incentives
Capital costs Operating costs Total costs
Total - ICE Total - EV Total - ICE Total - EV Total - ICE Total - EV
Sedan and Station Wagon $4,120,000 $3,135,000 $447,000 $256,000 $4,567,000 $3,391,000
Radio Patrol Car* - - $11,907,000 $7,679,000 $11,907,000 $7,679,000
Unmarked Police Car $5,765,000 $3,734,000 $657,000 $362,000 $6,422,000 $4,096,000
Sport Utility Vehicle $16,276,000 $14,068,000 $1,531,000 $783,000 $17,807,000 $14,851,000
Pickup Truck $7,255,000 $8,258,000 $475,000 $251,000 $7,730,000 $8,509,000
Van Cargo and Passenger $11,573,000 $9,777,000 $700,000 $390,000 $12,273,000 $10,167,000
Total $44,989,000 $38,972,000 $15,717,000 $9,721,000 $60,706,000 $48,693,000
Difference (total) - $6,017,000 - $5,996,000 - $12,013,000
Difference (%) - 13% - 38% - 20%
*Because Radio Patrol Cars are not part of the Capital Budget, their cost of purchase is included within the Operating Costs.
CONNECT: Philadelphia’s
Philadelphia’s Municipal Clean
Strategic
FleetTransportation
Plan Plan 23Table 13 highlights key assumptions utilized to estimate the emissions and cost impacts of the proposed
light and medium duty electric vehicle purchasing schedule detailed in Table 12.
Table 13. Cost and Emissions Inputs and Assumptions for Target Analysis
Description Input and Source
Capital Costs
Lutsey, Nic, and Michael Nicholas. “Update on electric vehicle costs in the United States
through 2030.” ICCT (2019) (Cars, SUVs) Analysis utilizes BEV200 and PHEV50 figures.
Vehicle purchase cost
projections Energy Information Agency (EIA) Annual Energy Outlook (AEO) 2020 - New Light-Duty Vehicle
Prices (Vans, pick-ups). Analysis utilizes small pick-up and large van figures, for BEV200 and
PHEV40 vehicles. Utilized to project cost changes over time from current MSRP.
Vehicles per port: 2 (Atlas DRVE tool default assumption)
EV charging infrastructure Type of equipment: Assumes all non-networked Level 2
costs Charging equipment cost per port: $600 (cost for Clipper Creek non-networked station)
Make ready cost per port: $4,900 (average from ICF report)
Vehicles: $7500 BEV / $2000 PHEV from AFIG.
Incentives
Charging infrastructure: $3,500 or up to 50% of total project costs - Driving PA Forward.[BK2]
Operating Costs
Estimated vehicle lifetime 12 years (City of Philadelphia fleet data)
Average annual VMT by vehicle type (City of Philadelphia fleet data) – Ranges from 4,624 for
Vehicle utilization
sedans and station wagons to 13,414 for radio patrol cars.
Current: fueleconomy.gov
Fuel economy Projections: EIA AEO 2020 - New Light-Duty Vehicle Fuel Economy. Analysis utilizes BEV200,
PHEV40 figures for midsize car, small utility (SUV), small pick-up, and large van.
Fuel - electricity [$/kWh] $0.07 (City of Philadelphia)
Fuel - gasoline [$/gallon] $2.35 (City of Philadelphia)
$0.09 — conventional vehicle
$0.05 — BEV
Vehicle maintenance $0.08 — PHEV
(Alameda County, 2017 (Passenger Vehicle) via U.S. DOE-funded Atlas Public Policy Fleet
Procurement Analysis Tool)
Charging station
3% of equipment cost (Atlas DRVE tool assumption)
maintenance [$/year/port]
Emissions
Gasoline TTW emissions
Argonne National Labs’ GREET tool via Atlas Public Policy fleet procurement tool
factors
Electricity TTW emissions EPA eGRID 2019 emissions factors by fuel type (coal, gas, etc.) by region (RFCE) utilized to
factors project forward based on Ameren’s projected grid mix. Also incorporates grid loss estimates.
City of Philadelphia’s Municipal Energy Use Dashboard. Includes target to generate or
Electricity emissions
purchase 100% of all electricity for the City’s built environment from renewable resources by
projections
2030.
Avoided fuel use and To estimate emissions reduction from retiring vehicles, utilizes implied fuel economy
emissions from retiring
estimates based on average mileage and fuel use per vehicle type in the current fleet.
vehicles
24 City of PhiladelphiaTable 14 highlights the sample vehicles modeled for each vehicle type in the light and medium duty
fleet, and their base year MSRP.
Table 14. Replacement Vehicle Base Year Purchase Costs
ICE BEV PHEV**
Purchase Purchase Purchase
Make/ Make/ Make/
price/ price/ price/
model model model
MSRP* MSRP* MSRP*
Ford Fusion
Sedan and Station Wagon Ford Taurus $27,800 Chevy Bolt $36,620 $37,000
Energi
Tesla Model Y
Ford
Radio Patrol Car $37,500 Long Range $48,000 N/A N/A
Interceptor
AWD
Tesla Model Ford Fusion
Chevrolet
Unmarked Police Car $31,620 3 Standard $37,990 Special $37,000
Impala (E85)
Range Plus Service PHEV
Chevrolet Ford Mustang Ford Escape
Sport Utility Vehicle $28,800 $47,595 $34,755
Blazer Mach-E AWD PHEV
Lordstown
Ford F150
Pickup Truck $33,390 Endurance $52,500 N/A N/A
4WD
BEV
Ford Transit Ford Transit
Van Cargo and Passenger $37,470 $45,000 N/A N/A
T150 (EV)
*MSRP and fuel economy from fueleconomy.gov unless otherwise linked.
**Assumes 25% of sedans and station wagons, unmarked police cars, and SUVs purchased through 2025 are PHEVs, and 0% of other
vehicle types.
CONNECT: Philadelphia’s
Philadelphia’s Municipal Clean
Strategic
FleetTransportation
Plan Plan 25
Table continued on next page.DRVE Tool Fleet Analysis
Immediate opportunities for electrification savings across all vehicle classes
Analysis using the Dashboard for Rapid Vehicle Electrification (DRVE) Tool identified a maximum of 840
light-duty vehicles that offer Philadelphia lifetime savings today under current market conditions without
including any federal or state level rebates, such as Pennsylvania’s Alternative Fuels Incentives Grants
(AFIG) Program. The competitiveness of light-duty EVs will of course increase if the City pursues state
rebates and federal tax credits to offset the upfront costs. Table 15 provides a summary of these vehicle
opportunities – see the DRVE Tool Report for additional details, assumptions, and analysis (Appendix A).
Table 15. Near Term Light-Duty EV Procurement Options
Per Vehicle
EV Average %
Conventional Vehicle Model Use Case Count Savings
Alternative Savings
Range
Ford Taurus Sedan 340 Chevy Bolt $774-$19,535 12%
Chevy Impala Sedan (Police) 66 Tesla Model 3 $24-$3,322 2%
Ford Fusion Sedan 14 896 $83-$4,150 4%
Chevy Tahoe SUV 116 354 $1,383-$13,575 12%
Chevy Equinox SUV 56 318 $2-$1,212 1%
Dodge Durango SUV 12 310 $33-$5,791 6%
Ford Explorer SUV (Police) 194 116 $33-$15,044 7%
Ford Expedition SUV 14 131 $2,442-$5,231 8%
When including AFIG rebates as a factor, the City could immediately cost effectively electrify
2,400 light-duty vehicles, or 83% of the total light-duty fleet. These calculations include state-
level incentives/rebates ($3,500) for Level 2 charging infrastructure. Electric SUVs, which are the
most common light-duty vehicle in the fleet, have an average cost per mile roughly equal to that of
conventional vehicles. Figure 5 shows the cost per mile comparisons across different light-duty vehicle
types — no federal or state incentives were applied to the calculations displayed in this figure.
26 City of PhiladelphiaThe analysis depicted in Figure 5 (next page) considered the use of plug-in hybrid electric vehicles
(PHEV), but not hybrid electric vehicles (HEV). Compared to the conventional ICE version, the Ford
Escape PHEV has a similar cost per mile even without applying available incentives. The fuel cost for the
plug-in Escape is four times lower than the conventional version.
Figure 5. Cost Per Mile Breakdown Across Light-Duty Vehicle Types
Across all plug-in hybrids, it is assumed that the vehicle will exhaust its electric-only range before turning
to gasoline consumption — fuel cost savings are high because many vehicles do not have a daily driving
range that is greater than the electric-only battery range. The Ford Escape plug-in, for example, has
a battery range of roughly 30 miles which exceeds the average daily driving distance of SUVs in the
Philadelphia fleet. The comparison depicted in Figure 6 does not include state or federal incentives, for
which the Ford Escape PHEV is eligible. Adding these incentives would increase the lifetime savings
potential of the applicable model.
While electric medium- and heavy-duty EVs are eligible for Pennsylvania purchase incentives (under the
Alternative Fuels Incentives Grants (AFIG) Program, their high upfront cost and limited number of available
models limit the savings potential of these vehicles, which offer significant fuel and maintenance cost
savings. Fuel cost alone for electric trash trucks are more than 10 times lower than conventional trash
trucks. In the near term, four (4) medium-duty EVs offer lifetime savings potential (about 5%) compared
to conventional models on Philadelphia’s fleet (the Chevrolet Express Van). See Appendix A for more
details.
CONNECT: Philadelphia’s
Philadelphia’s Municipal Clean
Strategic
FleetTransportation
Plan Plan 27Alternative Fuel & Vehicles Cont’d
Figure 6. Cost Per Mile Comparison – Ford Escape ICE vs Ford Escape PHEV
Collaborative Procurement
Depending on their application, electric vehicles present a unique value proposition which may be
best realized by pursuing alternative procurement, financing, and ownership options. Collaborative
procurement — where multiple entities consolidate their procurements into a single process or bid
request — saves staff time and effort during the procurement phase and eliminates the need to develop
an RFP or evaluate its responses to secure competitive solicitations for electric vehicles and related
equipment. Combined with the available Federal Tax Credit for plug-in vehicles — currently up to $7,500
off the vehicle purchase-price, subject to availability —procurement innovations and powerful financial
incentives are available to support the adoption of (light-duty) electric vehicles on municipal fleets.
Municipalities, as public fleets with no tax burdens, are unable to take advantage of federal tax credit
incentives. But under a lease financing arrangement, ownership resides with the lessor (a financing entity)
until the lessee (the end-user, in this case the municipality) takes possession of the vehicle title at the end
of the agreed-upon lease term. In this way, the lessor is able to monetize the tax credit directly as part of
its annual tax return, and, in anticipation of this future tax credit, can presently agree to lease the vehicle
in question to the lessee for a lower-than-normal monthly payment. In total, the lessee essentially takes
advantage of the tax credit since the total purchase price of the vehicle is reduced (the original cost of
the vehicle minus the available tax credit).
Solutions like the Climate Mayors EV Purchasing Collaborative provide flexible lease financing through
a partnership with NCL Government Capital, under contract with collaborative procurement agent
Sourcewell. The City of Philadelphia signed on to the EV Purchasing Collaborative but has not yet taken
28 City of Philadelphiaadvantage of the program. This EV Purchasing Collaborative allows cities to save time and money during
the procurement phase, while allowing cities to take advantage of the federal tax credit for plug-in
vehicles. See Figure 7 below for more information. Other benefits include:
• Predictable budgeting — terms never change over the life of the agreement
• Lease payments come out of the City’s operating budget, not capital budget
• Lease payments billed monthly OR annually, as needed
• Lease agreements include non-appropriation clauses, providing room for cities to ‘default’ on
payment and not be held responsible
Such a financing arrangement also enables cities to explore different ownership options for its fleet
vehicles – and decide whether or not to take on the depreciation risk of the asset. Closed-end leases
are essentially long-term vehicle rentals, whereby the vehicle is returned to the lessor at the end of
pre-arranged lease term. In this case, the lessor takes on the depreciation risk. Open-end leases (lease-
to-own offerings) are more common for vehicles that record high vehicle miles travelled, and so the
depreciation risk resides with the lessee who agrees to make a balloon payment at the end of the lease
term to build equity in the asset/own the vehicle outright. In all cases, cities know up-front how much the
monthly payments and the residual value will be – these never change over the term of the agreement.
Different financing options may be employed for specific vehicles based on their applications, achieving
enhanced fleet spending efficiency.
Figure 7. 2019 Nissan Leaf Procurement Comparison the Climate Mayors EV Purchasing Collaborative
*Maintenance, repairs, licensing/registration and insurance costs NOT included. Sales Tax will be charged on the monthly lease
payment and the appropriate rate.
CONNECT: Philadelphia’s
Philadelphia’s Municipal Clean
Strategic
FleetTransportation
Plan Plan 29You can also read