Phenotyping cowpea accessions at the seedling stage for drought tolerance in controlled environments
←
→
Page content transcription
If your browser does not render page correctly, please read the page content below
Open Agriculture 2022; 7: 433–444
Research Article
Gabriel V. Nkomo*, Moosa M. Sedibe, Maletsema A. Mofokeng
Phenotyping cowpea accessions at the seedling
stage for drought tolerance in controlled
environments
https://doi.org/10.1515/opag-2022-0093 Keywords: accessions, cowpea, drought tolerance, pheno-
received February 9, 2021; accepted April 7, 2022 type, screen houses
Abstract: One of the most important screening techni-
ques used in cowpea selection for drought tolerance is
screening at the seedling stage. The objective of this
study was to phenotype 60 cowpea genotypes for seed- 1 Introduction
ling drought tolerance in screen houses (glasshouse and
greenhouse). Principal component analysis revealed that Cowpea [Vigna unguiculata (L.) Walp.], Fabaceae,
of the 14 variables, the first 4 expressed more than 1 (2n = 2x = 22) is an important leguminous crop in devel-
eigenvalue. Data showed that PC1, PC2, and PC3 contrib- oping countries, especially in sub-Saharan Africa, Asia,
uted 39.3, 15.2, and 10%, respectively, with 64.68% total and Latin America, with a genome size of about 620 mil-
variation. A PCA plot and biplot showed that the number lion base pairs [1]. The improvement in cowpea is mainly
of pods (NP), seeds per pod (SP), survival count (SC), pod dependent on breeding and selection from existing land-
weight (PWT), and stem wilting in week 1 (WWK1) had races according to the existence of phenotypic variability,
the most significant contributions to genetic variability to which is largely influenced by environmental conditions.
drought tolerance and to yield after stress imposition According to the Food and Agriculture Organisation
based on the PCA, biplot, and cluster plot, the accessions of the United Nations (FAO), cowpea was grown on
IT 07-292-10, IT 07-274-2-9, IT90K-59, 835-911, RV 343, 1 million ha in Africa in 2014, with the bulk of production
and IT 95K-2017-15 had the maximum variability in terms occurring in West Africa, particularly in Niger, Nigeria,
of NP, SP, SC, PWT, and WWK1 after drought imposi- Burkina Faso, Mali, and Senegal [2]. The global cowpea
tion. Cowpea accessions 835-911, IT 07-292-10, RV 344, production was 5.59 million and the average yield was
Kangorongondo, and IT 90K-59 were the major individuals 443.20 kg/ha [3]. Africa leads in both area and produc-
that contributed mainly to domain information model tion, accounting for about 95% of each. Niger and Nigeria
(DIM) 1 and 2. The accessions that contributed the least are the leading producers of cowpea, together accounting
were IT 89KD288, Chibundi mavara, and TVU12746. Thirty- for about 70% of the area and 67% of production world-
six cowpea accessions from both screen houses were tol- wide. Most cowpea cultivars have relatively short growth
erant to drought, 15 were moderately tolerant, while 23 and maturation cycles of 60–80 days, which makes them
were susceptible. The findings of the study provided a suitable for drought-prone regions [4].
useful tool for screening and determining drought-tolerant Drought is one of the most serious environmental
and susceptible accessions at the seedling stage. stresses, and it has a significant negative impact on
crop yield. Authors of ref. [5] recommended the use of
water-efficient varieties in combination with good crop
husbandry practices. Cowpea plants exposed to tempera-
tures of 30–38°C from 8 days after emergence to maturity
* Corresponding author: Gabriel V. Nkomo, Department of had very limited vegetative growth and reproductive
Agriculture, Central University of Technology Free State, potential. Authors of refs. [6,7] observed that there is
Bloemfontein, South Africa, e-mail: gvnkomo@gmail.com
a great need to screen and breed for drought-tolerant
Moosa M. Sedibe: Department of Agriculture, Central University of
Technology Free State, Bloemfontein, South Africa
and water-efficient varieties in Africa, as cowpea is grown
Maletsema A. Mofokeng: Department of Plant Breeding, Agriculture mostly under rain-fed conditions, with frequent exposure to
Research Council Grain Crops, Potchefstroom, South Africa intermittent droughts. Authors of refs. [5,8] recommended
Open Access. © 2022 Gabriel V. Nkomo et al., published by De Gruyter. This work is licensed under the Creative Commons Attribution 4.0
International License.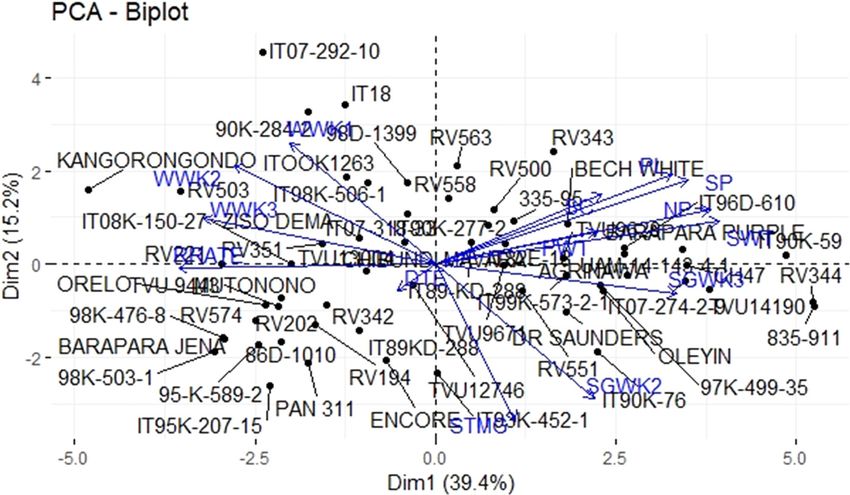
434 Gabriel V. Nkomo et al.
the use of well-adapted, early maturing cultivars in 2 Materials and methods
the smallholder farming sector to escape losses from
late season droughts. In an experiment by the author
2.1 Plant material
of ref. [9], to ascertain the growth of cowpea cultivars
under osmotic stress, seeds of three cowpea cultivars
Sixty cowpea accessions collected from three geographic
(BRS Tumucumaque, BRS Aracê, and BRS Guariba) were
origins were used in this study (Table 1). Out of these,
germinated at five osmotic potentials after three pre-treat-
33 accessions were from the International Institute of
ments: pre-soaking in deionised water, pre-soaking in sali-
Tropical Agriculture (IITA) in Nigeria, 19 accessions were
cylic acid, and without pre-soaking. It was observed that
from the Agricultural Research Council – Grain Crops in
salicylic acid promoted a reduction in abiotic stress, and
South Africa, and 8 accessions were from smallholder
BRS Guariba was more tolerant to water deficits and
farmers in Buhera District in Zimbabwe.
adjusted its cellular electrolyte leakage to increase its pro-
line content under induced water stress.
In a wooden box experiment, to screen cowpea recom-
binant inbred lines (RILs) for seedling drought tolerance 2.2 Planting and data collection
[10], 200 inbred lines were used. It was observed that 12
RILS performed well for recovery, 13 RILS were susceptible Seeds of cowpea accessions were planted in 20 cm dia-
to drought stress, and 11 RILS had higher relative water meter pots in topsoil mixed with compost (3:1) in a green-
and chlorophyll contents. Authors of ref. [11] analysed house (environment 1) at the Agriculture Research
10 cowpea accessions under screen house conditions Council – Grain Crops in Potchefstroom, South Africa,
and observed significant differences among accessions in January 2019. The experiment was repeated in a glass-
for percentage plant recovery, stem regrowth, and stem house (environment 2) in February 2019. An alpha lattice
greenness. For the evaluation of four Mozambican cowpea design with four blocks was used for both the experiments.
landraces for drought tolerance, authors of ref. [12] deter- Sixty accessions were carefully selected for drought toler-
mined that variability exists among the landraces in terms ance at the seedling stage and were used in the experi-
of growth under drought conditions, with Timbawene ments. A triplicated 10 × 6 alpha lattice design was used
moteado having considerably higher leaf dry biomass, for the experiments. After planting, the pots were watered
leaf and nodule protein content, and symbiotic nitrogen to field capacity for their establishment, thereafter which
fixation compared to those of other landraces, as well as watering was completely withheld for 3 weeks after planting
the lowest increase in proteolytic activity. (WAP), when plants were at the three-leaf stage [10]. There-
In a screen house experiment, to select drought-tolerant after, wilted plants of each variety were counted daily until
cowpea seedlings, authors of ref. [8] evaluated 23 cowpea all the plants of the susceptible lines had wilted. Stress was
accessions at the seedling stage in the 2013 and 2014 measured by observing all dead plants in the susceptible
growing seasons. They observed that the plant height, group. Watering resumed at 3 weeks after stressing in both
number of leaves, and stem greenness were all affected the greenhouse (environments 1 and 2) experiments until
by drought stress. It was found that five varieties, Kanan- harvest. After the resumption of watering, the number of
nado, Danila, IT07K-297-13, IT03K-378-4, and Aloka recovered seedlings were rated for recovery. Based on the
local, were highly tolerant to drought. In addition, six days to wilting and percentage recovery, the accessions
varieties IT07K-322-40, IT07K-313-41, IT07K-291-92, IT06K- were rated as either drought-tolerant or -susceptible. The
270, IT07K-244-1-1, and IT06K-275 were classified as highly longer an accession took to wilt as well as its ability to recover
susceptible to drought and the remaining 12 varieties after being subjected to drought stress were very important
were found to be neither tolerant nor susceptible to determinants in the experiment. Drought-related traits were
drought. Most cowpea plants exposed to moisture var- recorded at the seedling stage on days to emergence (DTE),
iation during the vegetative or reproductive stages per- recovery rate (RR), survival count (SC), stem greenness from
form poorly; hence, seedling-stage screening is ideal in week 1–3 (SGWK1, SGWK3, and SGWK3) and wilting in week
this scenario. The objective of this study was to pheno- 1–3 (WWK1, WWK2, and WWK3). Yield-related traits were
type 60 cowpea genotypes for seedling drought toler- recorded as average seeds per pod (AVSD), pod length
ance in screen houses. (PL), pod width (PWDTH), and pod weight (PWT).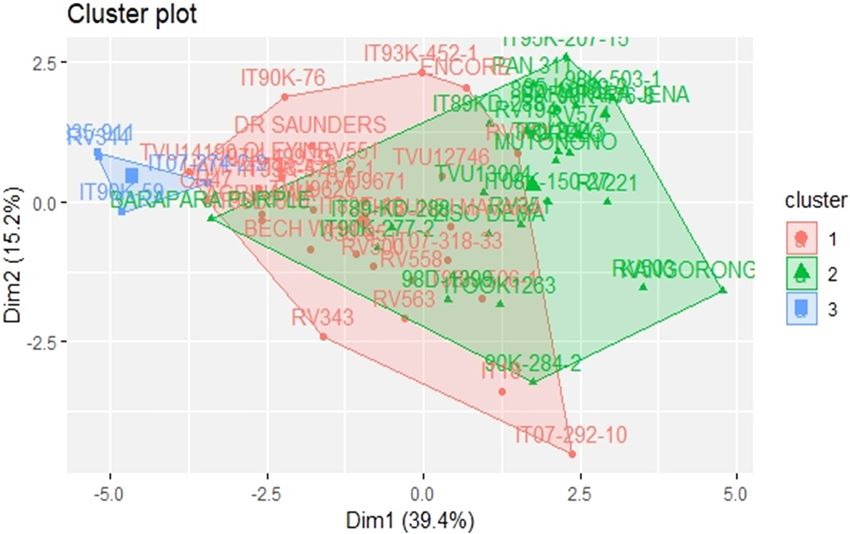
Phenotyping cowpea accessions at the seedling stage for drought tolerance 435
Table 1: List of cowpea accessions used in the study obtained from
three geographic regions Table 1: Continued
Entry Name Source Origin Entry Name Source Origin
1 Dr Saunders ARC-GC South Africa 56 IT 99K-573-2-1 IITA Nigeria
2 IT96D-610 IITA Nigeria 57 Mupengo dema Buhera Zimbabwe
3 RV 574 ARC-GC South Africa 58 CH47 ARC-GC South Africa
4 RV 342 ARC-GC South Africa 59 TVU 13004 IITA Nigeria
5 Pan 311 ARC-GC South Africa 60 IT 90K-59 IITA Nigeria
6 Bechuana white ARC-GC South Africa
IITA – International Institute of Tropical Agriculture; ARC-GC –
7 Barapara jena Buhera Zimbabwe
Agriculture Research Council Grain Crops.
8 TVU 9443 IITA Nigeria
9 95K-589-2 IITA Nigeria
10 RV 344 ARC-GC South Africa
11 Agrinawa ARC-GC South Africa
2.3 Data collection
12 IT 95K-207-15 IITA Nigeria
13 Orelo IITA Nigeria 2.3.1 Temperature conditions of the screen houses
14 TVU 9671 IITA Nigeria
15 Mutonono Buhera Zimbabwe The daily minimum and maximum temperatures of
16 UAM-14-143-4-1 IITA Nigeria
the screen houses were captured using temperature log-
17 98K-503-1 IITA Nigeria
18 RV 503 ARC-GC South Africa
gers. The loggers were placed in the screen houses and set
19 86 D 1010 IITA Nigeria to record the temperature at hourly intervals for the whole
20 TVU 9620 IITA Nigeria period of the experiment. The highest and lowest day tem-
21 RV 202 ARC-GC South Africa peratures recorded in the greenhouse (environment 1)
22 RV 351 ARC-GC South Africa were 35.75°C and 27.67°C, respectively. The highest and
23 Encore ARC-GC South Africa
lowest night temperatures recorded in the greenhouse
24 TVU 14190 IITA Nigeria
25 IT 89KD-288 IITA Nigeria (environment 1) were 26.87°C and 19.99°C, respectively.
26 RV 551 ARC-GC South Africa The highest and lowest daytime temperatures recorded
27 IT 82E-18 IITA Nigeria in the glasshouse (environment 2) were 36.4°C and 19°C,
28 Barapara purple Buhera Zimbabwe respectively. The highest and lowest night temperatures
29 Kangorongondo Buhera Zimbabwe
recorded in the glasshouse (environment 2) was 23.64°C
30 835-911 IITA Nigeria
31 ITOOK 76 IITA Nigeria
and 18.5°C, respectively.
32 98K-476-8 IITA Nigeria
33 Ziso dema Buhera Zimbabwe
34 Chibundi mavara Buhera Zimbabwe 2.3.2 Agronomic traits
35 90K-284-2 IITA Nigeria
36 RV 221 ARC-GC South Africa Drought tolerance was estimated using the wilting score
37 RV 343 ARC-GC South Africa
(WS) as the degree of wilting severity, based on the 0–4
38 IT 98K-506-1 IITA Nigeria
39 Oleyin IITA Nigeria score scale as described in ref. [5]. Data were collected on
40 IT 07-292-10 IITA Nigeria number of days to seedling emergence, stem greenness,
41 IT 08K-150-27 IITA Nigeria and wilting at 14, 21, and 30 days after planting (DAP),
42 RV500 ARC-GC South Africa and rated on a scale of 0–4 [13].
43 IT 90K-277-2 IITA Nigeria
Stem greenness (SGWK)
44 98D-1399 IITA Nigeria
45 ITOOK 1263 IITA Nigeria
0 – leaves and stem completely yellow;
46 RV 563 ARC-GC South Africa 1 – 75% of the leaves yellow, brown either from
47 IT 18 Buhera Zimbabwe the base or tip of the stem;
48 RV 194 ARC-GC South Africa 2 – 50% yellow or pale green, stem not turgid;
49 335-95 IITA Nigeria
3 – 25% yellow, 75% green, stem less turgid;
50 TVU 12746 IITA Nigeria
4 – completely green, stem turgid.
51 IT 07-274-2-9 IITA Nigeria
52 97K-499-35 IITA Nigeria Wilting (WWK)
53 IT 07-318-33 IITA Nigeria 0 – no sign of wilting;
54 IT89-KD-288 IITA Nigeria 1 – 25% wilting;
55 RV558 ARC-GC South Africa 2 – moderate wilting, 50%;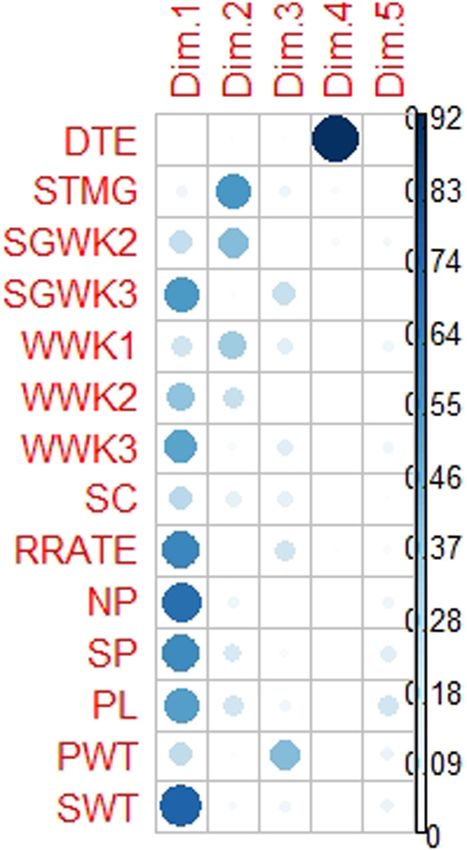
436 Gabriel V. Nkomo et al.
3 – yellow and brown leaves with 75% wilting; Meyer–Olkin measure of sampling of adequacy and rotated
4 – completely wilted. component plot.
After re-watering, data were collected on the SC:
the number of surviving plants per genotype.
Recovery type 3 Results
0 – no recovery;
0.5 – recovery from the basal meristem; There were significant differences among most drought-
1 – recovery from the apical meristem; related traits at the seedling stage on DTE, RR, SC, SGWK1,
The Recovery rate (RR) was computed as follows: SGWK3, and SGWK3 and WWK1, WWK2, and WWK3).
(No. of dead plants/No. of emerged plants) × 100 There were also significant differences at p < 0.01 between
Envt × Genotype and RR, SGWK2, SGWK3,WWK1, WWK2,
and WWK3 (Table 2).
There were significant differences among most yield-
2.4 Data analysis related traits on average seeds per pod (SP), PL, PWDTH,
and PWT. There were also significant differences at
A two-way analysis of variance (ANOVA) was used to p < 0.01 between Envt × Genotype and SP, NP, number
determine significant differences in DTE, wilting scores, of seeds (NSDS), PL, PWDTH, and PWT (Table 3).
SC, and yield-related traits. GenStat (version 19) software
(www.genstat.kb.vsni.co.uk) was used for the statistical
analysis of data. Statistical analysis was performed using 3.1 Principal component analysis
[14] (www.ibm.com/support/pages/spss-statistics-20-available-
download) statistical computer package for Bartlett’s test of Principal component analysis (PCA) revealed that of
sphericity, principal component analysis, scree plot, Kaiser– the 14 component variables (PCs) only 4 PCs with eigenvalue
Table 2: Mean square of traits from the analysis of variance from two screen houses for 60 cowpea accessions under drought stress
conditions
Trait
Source DF DTE RR SC SGWK1 SGWK2 SGWK3 WWK1 WWK2 WWK3
Envt 1 36.74** 9343.2** 137.52** 52.90** 62.5** 46.94** 154.71** 18.68** 122.50**
Envt × Genotype 118 0.46 ns 1012.2** 0.30 ns 0.44 ns 0.78** 0.72** 0.52** 1.29** 0.57**
Rep 2 0.81 ns 3432.5** 84.94** 9.29** 4.84** 0.58** 3.10** 3.94** 34.70**
Residual 238 0.34 317.4 0.81 0.31 0.38 0.39 0.2292 0.39 0.31
**– significant at p < 0.01; ns – not significant; DTE – date to emergence; RR – recovery rate; SC – survival count; SGWK1 – stem greenness
in week 1 after imposition of water stress; SGWK2 – stem greenness in week 2 after imposition of water stress; SGWK3 – stem greenness in
week 3 after imposition of water stress; WWK1 – level of wilting in week 1 after imposition of water stress; WWK2 – level of wilting in week 2
after imposition of water stress; WWK3 – level of wilting in week 3 after imposition of water stress.
Table 3: Mean square of yield-related traits from the analysis of variance from two screen houses for 60 cowpea accessions after drought
stress
Trait
Source DF SP NP NSDS PL PWDTH PWT
Envt 1 59.211** 30.044 ns 20.07 ns 226.768** 1.22267** 512.298**
Envt × Gen 118 28.831** 17.574** 1006.99** 51.074** 0.33401** 215.105**
Rep 2 20.4 16.3** 284.63** 31.63** 0.2433** 132.764**
Residual 238 1.936 3.462 62.35 2.453 0.01265 7.068
**– significant at p < 0.01; ns – not significant; AVSD – average seeds per pod; NP – number of pods; NSDS – number of seeds; PL – pod
length; PWDTH – pod width; PWT – pod weight.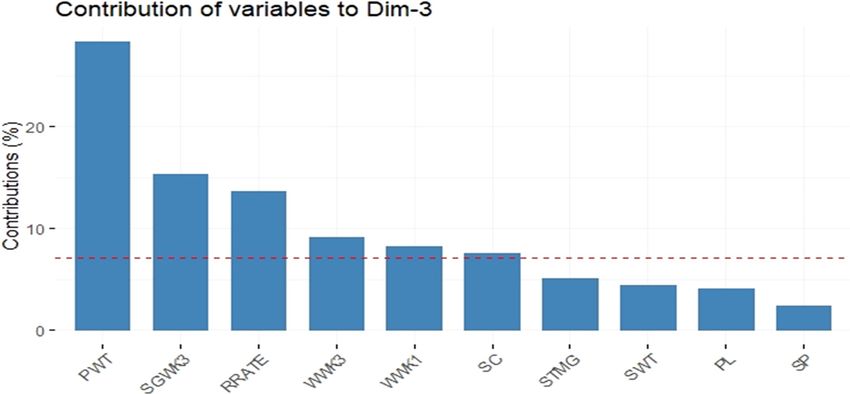
Phenotyping cowpea accessions at the seedling stage for drought tolerance 437
greater than 1 were maintained (Table 4). The 4 PCs
explained 72.1% of the total phenotypic variation. The first
principal component (PC) was positively influenced by
PWT, with a value of 0.358, as well as by PL (0.286), SP
(0.263), SWT (0.255), and NP (0.181). PC2 was influenced by
SGWK3, with a value measuring 0.332, and SC, with a value
of 0.232. In PC3, SGWK1 had the highest value (0.384), fol-
lowed by SGWK2 (0.295), and PWT (0.109). In PC4, the DTE
had a positive influence (0.926), as did SGWK2 (0.194).
A scree plot to show the relationship between eigen-
values and principal components was constructed to
summarise the contribution of PCs (Figure 1). The plot Figure 1: Scree plot showing contributions of PCs to variability.
showed that maximum variation was present in variable
1 with the highest eigenvalue of 5.8 followed by variable 2
The day and night temperature ranges in both
(2.1), variable 3 (1.4), and variable 4 (1). Variable 14 had
the screen houses varied during the three-week period
the lowest eigenvalue (0).
when the plants were stressed. The highest and lowest
A further PCA with VARIMAX rotation was conducted
daytime temperatures recorded in the greenhouse (envir-
to assess how the variables were clustered (Figure 2).
onment 1) were 35.75 and 27.67°C, respectively, with
The component plot in rotated space (Figure 2) highlights
a mean daytime temperature of 32.24°C (Figure 3). The
the important variables in order when all three components
highest and lowest night-time temperatures recorded in
are compared. WWK1, WWK2, and SC are the most impor-
the greenhouse (environment 1) were 26.87 and 19.99°C,
tant variables of the three components, respectively. Bar-
with a mean night-time temperature of 23.98°C, respectively.
tlett’s test of sphericity was significant at p < 0.05, while
The highest and lowest daytime temperatures recorded in
the Kaiser–Meyer–Olkin measure of sampling of adequacy
the glasshouse (environment 2) was 36.4 and 19°C, with
was 77, indicating sufficient items for each factor.
a mean daytime temperature of 26.06°C respectively. The
highest and lowest temperatures recorded in the glasshouse
(environment 2) was 23.64 and 18.5°C, with a mean night-
Table 4: Eigen-values, proportions of variability, and morphological time temperature of 21.42°C, respectively.
traits that contributed to the first four PCs of cowpeas
PC1 PC2 PC3 PC4
Eigen values 5.51 2.13 1.41 1.04
Proportion of variance (%) 39.4 15.2 10.1 7.4
Cumulative variance (%) 39.38 54.6 64.7 72.1
DTE 0.034 0 −0.008 0.926
SGWK1 −0.05 −0.101 0.384 −0.169
SGWK2 −0.045 0.032 0.295 0.194
SGWK3 −0.123 0.332 −0.004 0.088
WWK1 −0.07 0.13 −0.339 −0.039
WWK2 0.069 −0.117 −0.216 0.063
WWK3 0.111 −0.277 −0.052 0.004
SC 0.004 0.232 −0.178 0.025
Recovery Rate 0.095 −0.322 0.055 0.095
NP 0.181 0.063 −0.036 −0.047
SP 0.263 −0.012 −0.074 0.033
PL 0.286 −0.048 −0.074 0.035
PWT 0.358 −0.283 0.109 0.022
SWT 0.255 −0.034 0.027 0.012 Figure 2: Component plot in rotated space showing contributions of
principal component variables. SGK1 – stem greenness in week 1;
SGK1 – stem greenness in week 1; SGWK2 – stem greenness in SGWK2 – stem greenness in week 2; SGWK3 – stem greenness in
week 2; SGWK3 – stem greenness in week 3; WWK1 – wilting in week 3; WWK1 – wilting in week 1; WWK2 – wilting in week 2; WWK 3
week 1; WWK2 – wilting in week 2; WWK3 – wilting in week 3; SC – – wilting in week 3; SC – survival count; RR – recovery rate; NP –
survival count; RR – recovery rate; NP – number of pods; SP – seeds number of pods; SP – seeds per pod; PL – pod length; PWT – pod
per pod; PL – pod length; PWT – pod weight; SWT – seed weight. weight; and SWT – seed weight.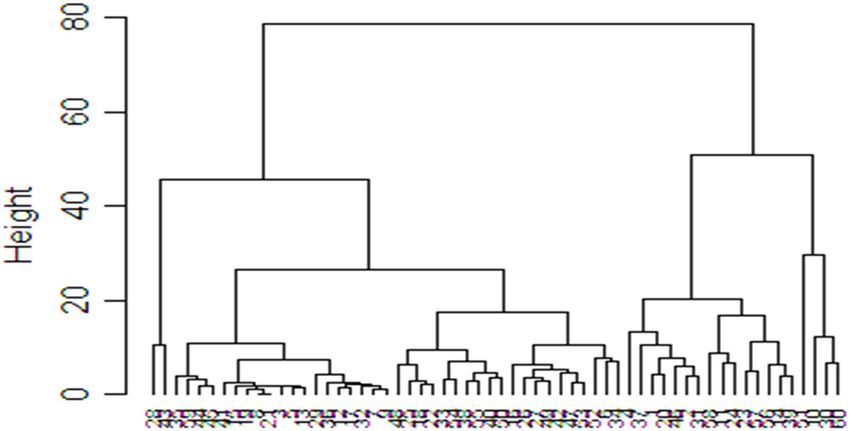
438 Gabriel V. Nkomo et al.
40
35
30
25
20
15
10
5
0
1 2 3 4 5 6 7 8 9 10 11 12 13 14 15 16 17 18 19 20 21 22 23
DAY TEMP/3WKS NIGHT TEMP/3WKS Environment 1
DAY TEMP NIGHT TEMP Environment 2
Figure 3: Graph showing day and night temperature ranges for 3 weeks.
both DIM 1 and DIM 2 (Figure 5). The accessions IT
89KD288, Chibundi mavara, and TVU12746 contributed
the least.
The main contributors to DIM 3 were PWT, SGWK3,
and RR (Figure 6). The variables that contributed the least
were SWT, PL, and SPD.
Figure 7 shows the relationships among traits in DIM
1 to DIM 5. SWT, NP, and SGWK3 dominated DIM 1. DIM 2
was dominated by SGWK1 and SGWK2 after drought
imposition. PWT was the dominant trait in DIM 3, while
that in DIM 4 was DTE.
The cluster plot analysis showed that the cowpea
accessions could be grouped into three distinct clusters;
red, blue, and green (Figure 8). Most accessions were
grouped into the red and blue clusters. However, there
was an overlap of accessions in the green and red clus-
ters. As such, some accessions (TVU 13004, ITOOK 1263,
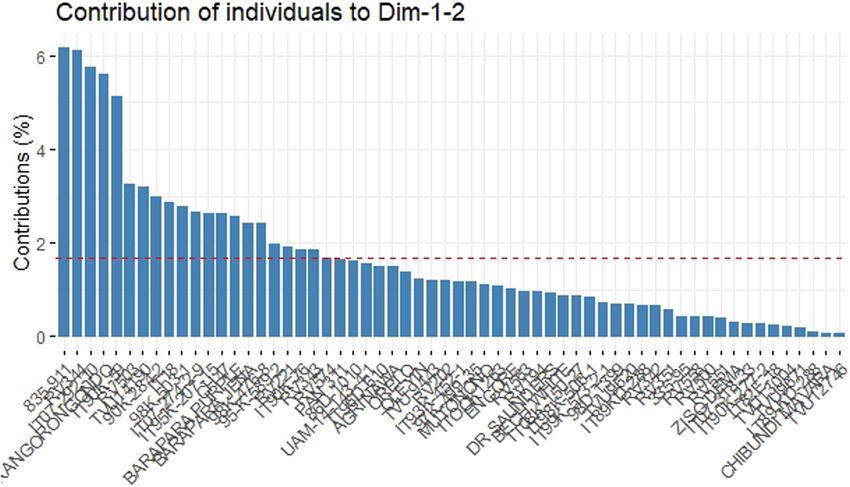
Figure 4: The contribution of various variables among 60 cowpea
IT89 KD 288, RV 588, Bechuana White, TVU 12746, IT07-
accessions screened for drought tolerance. SGK1 – stem greenness
in week 1; SGWK2 – stem greenness in week 2; SGWK3 – stem
318-33, and TVU 9671) managed to withstand water stress
greenness in week 3; WWK1 – wilting in week 1; WWK2 – wilting in and went on to flower and produce pods when irrigation
week 2; WWK3 – wilting in week 3; SC – survival count; RR – was resumed after 3 weeks of water stress.
recovery rate; NP – number of pods; SP – seeds per pod; PL – pod The relationship of cowpea traits was studied using
length; PWT – pod weight; SWT – seed weight. correlation coefficients. The correlation coefficient was
statistically significant between SWT and SGWK3, WWK2,
In the PCA plot, NP, SP, SC, PW, and WWK1 had WWK3, SC, NP, SP, PL, as well as PWT. Also, the correlation
the most significant contributions to genetic variability coefficient was statistically significant in SGWK2 compared
in the drought tolerance cowpea accessions, as well as to those of other traits. This means that there was an inverse
to yield after stress imposition (Figure 4). relationship between stem greenness and weeks. This was
Cowpea accessions 835-911, IT 07-292-10, RV 344, due to the fact that as the cowpea accessions were subjected
Kangorongondo, and IT 90K-59 contributed the most to to more time under drought stress, they showed differentPhenotyping cowpea accessions at the seedling stage for drought tolerance 439
Figure 5: The contribution of 60 cowpea accessions screened to DIM 1 and 2.
responses. Some wilted earlier, while others were gradual. accessions from both screen houses were tolerant to
All of the significant correlation coefficients were positive drought, 15 were moderately tolerant, while 23 were sus-
and were mainly between DTE, SGWK1, SGWK3, SC, NP, ceptible, based on the 14 traits measured (Table 6).
SP, PL, PWT, and SWT (Table 5). Pearson correlation ana- The biplot highlights the relationship of each traits
lysis showed that the most significant relationships were and accessions to drought tolerance at the seedling stage
observed from SGWK2 up to SWT. In addition, DTE had (Figure 9).
mostly weak negative correlations with most of the mea- The neighbour-joined cluster analysis generated by
sured attributes. Most positive correlations were observed UPGMA divided the 60-cowpea accessions into two main
in SWT, PWT, and PL. clusters (Figure 10). The cluster analysis showed that
The 60-cowpea accessions used in this study varied in the 60 accessions were grouped into two major clusters
their response to drought imposition. Thirty-six cowpea and other subclusters with their respective distances.
Figure 6: The contribution of various variables among 60 cowpea accessions screened for drought tolerance. SGK1 – stem greenness in
week 1; SGWK2 – stem greenness in week 2; SGWK3 – stem greenness in week 3; WWK1 – wilting in week 1; WWK2 – wilting in week 2;
WWK3 – wilting in week 3; SC – survival count; RR – recovery rate; NP – number of pods; SP – seeds per pod; PL – pod length; PWT – pod
weight; SWT – seed weight.440 Gabriel V. Nkomo et al.
The phenotypic height index based on morphological traits
ranged from 1 (IT 89KD-288 from IITA) to 50 (TVU 13004
and IT96D-610 from IITA). The phenotypic height index
of other accessions in other subclusters was less than 20.
4 Discussion
This study revealed that moisture is a very important
component in plant growth and reproduction. According
to ref. [15], when moisture stress is imposed during
the vegetative stage, it has the most effect on shoot and
dry weight reduction in cowpea. It is also during the vege-
tative stage that plants set up their architecture for repro-
duction. Author of ref. [16] observed that moisture stress
imposed after the pod-filling stage in determinate acces-
sions has a limited reduction in the shoot and root biomass.
Most of the cowpea accessions showed differences in
their response to drought imposition in their stem green-
ness from week 1 to week 3 after drought imposition.
A similar variation was also observed when wilting was
recorded from week 1 to week 3 after drought imposition.
In both environments, the temperature had a significant
effect on the performance of the accessions. In the green-
Figure 7: The contribution of various variables to DIM 1 to DIM 5.
SGK1 – stem greenness in week 1; SGWK2 – stem greenness in week house (environment 1) experiment, the average day and
2; SGWK3 – stem greenness in week 3; WWK1 – wilting in week 1; night temperatures were 34.24°C and 23.98°C, respec-
WWK2 – wilting in week 2; WWK3 – wilting in week 3; SC – survival tively. In the glasshouse (environment 2) experiment,
count; RR – recovery rate; NP – number of pods; SP – seeds per pod; the mean day and night temperatures were 26.06°C and
PL – pod length; PWT – pod weight; SWT – seed weight.
21.42°C, respectively. According to ref. [17], the optimum
Figure 8: Cluster plot showing the three groups of cowpea accessions grouped according to their levels of drought tolerance.
Cluster 1 – moderately tolerant; cluster 2 – susceptible; cluster 3 – tolerant.Table 5: Pearson correlation coefficients of traits assessed for 60 cowpea accessions evaluated under two moisture regimes
DTE STMG SGWK2 SGWK3 WWK1 WWK2 WWK3 SC RRATE NP SP PL PWT SWT
DTE 1 −0.062 0.132 0.047 −0.012 0.042 0 −0.034 0.07 −0.204 −0.102 −0.118 −0.216 −0.179
STMG 1 0.460** 0.11 −0.476** −0.362** −0.256* −0.104 −0.079 −0.008 0.003 −0.028 0.068 0.064
SGWK2 1 0.372** −0.356** −0.475** −0.266* 0.091 −0.24 0.178 0.141 0.096 0.169 0.214
SGWK3 1 −0.255* −0.360** −0.729** 0.285* −0.696** 0.516** 0.402** 0.349** 0.439** 0.472**
WWK1 1 0.371** 0.349** 0.108 0.162 −0.19 −0.184 −0.203 −0.246 −0.258*
WWK2 1 0.456** −0.218 0.449** −0.313* −0.286* −0.195 −0.324* −0.378**
WWK3 1 −0.324* 0.667** −.460** −.396** −0.358** −.397** −0.446**
SC 1 −0.506** 0.374** 0.382** 0.367** 0.421** 0.416**
RRATE 1 −0.687** −0.550** −0.456** −0.602** −0.640**
NP 1 0.781** 0.723** 0.912** 0.939**
SP 1 0.933** 0.813** 0.839**
PL 1 0.778** 0.795**
PWT 1 0.954**
SWT 1
**– significant at p < 0.01; * – not significant; DTE – date to emergence; SGWK1 – stem greenness in week 1; SGWK2 – stem greenness in week 2; SGWK3 – stem greenness in week 3; WWK1 –
wilting in week 1; WWK2 – wilting in week 2; WWK3 – wilting in week 3; SC – survival count; RR – recovery rate; NP – number of pods; SP – seeds per pod; PL – pod length; PWT – pod weight;
SWT – seed weight.
Phenotyping cowpea accessions at the seedling stage for drought tolerance
441442 Gabriel V. Nkomo et al.
Table 6: The response to drought stress of 60-cowpea accessions
based on 14 traits measured Table 6: Continued
Entry Name Source Origin Response to Entry Name Source Origin Response to
drought drought
1 Dr Saunders ARC-GC South Africa Tolerant 55 RV558 ARC-GC South Africa Tolerant
2 IT96D-610 IITA Nigeria Tolerant 56 IT 99K-573-2-1 IITA Nigeria Tolerant
3 RV 574 ARC-GC South Africa Moderate 57 Mupengo dema Buhera Zimbabwe Moderate
4 RV 342 ARC-GC South Africa Moderate 58 CH47 ARC-GC South Africa Tolerant
5 Pan 311 ARC-GC South Africa Moderate 59 TVU 13004 IITA Nigeria Tolerant
6 Bechuana white ARC-GC South Africa Tolerant 60 IT 90K-59 IITA Nigeria Tolerant
7 Barapara jena Buhera Zimbabwe Susceptible
ARC-GC – Agriculture Research Council-Grain Crops; IITA –
8 TVU 9443 IITA Nigeria Moderate
International Institute of Tropical Agriculture.
9 95K-589-2 IITA Nigeria Susceptible
10 RV 344 ARC-GC South Africa Susceptible
11 Agrinawa ARC-GC South Africa Tolerant
12 IT 95K-207-15 IITA Nigeria Susceptible temperature for growth and development of crops is
13 Orelo IITA Nigeria Moderate around 30°C; hence, 27 out of the 37 tolerant accessions
14 TVU 9671 IITA Nigeria Tolerant were located in the glasshouse (environment 2). Authors
15 Mutonono Buhera Zimbabwe Moderate of ref. [18] also confirmed that temperatures above 30°C
16 UAM-14-143-4-1 IITA Nigeria Tolerant
increase the intensity of stress levels in cowpea, thus
17 98K-503-1 IITA Nigeria Susceptible
18 RV 503 ARC-GC South Africa Moderate
fewer accessions were found in the greenhouse.
19 86 D 1010 IITA Nigeria Moderate The PC plot highlighted the importance of the dis-
20 TVU 9620 IITA Nigeria Tolerant tance of variables to PCs and their ultimate contributions
21 RV 202 ARC-GC South Africa Moderate to the drought tolerance of accessions, as well as to
22 RV 351 ARC-GC South Africa Moderate the yield after stress imposition. The PC plot showed
23 Encore ARC-GC South Africa Moderate
that the NP, SP, SC, PWT, and WWK1 had the most sig-
24 TVU 14190 IITA Nigeria Tolerant
25 IT 89KD-288 IITA Nigeria Moderate nificant contributions to genetic variability in drought
26 RV 551 ARC-GC South Africa Tolerant tolerance in cowpea accessions, as well as to the yield
27 IT 82E-18 IITA Nigeria Tolerant after stress imposition. In the PC plot, accessions placed
28 Barapara purple Buhera Zimbabwe Susceptible far from each other were more diverse. Based on the PC,
29 Kangorongondo Buhera Zimbabwe Susceptible
and scatter plot, the accessions IT 07-292-10, RV 343, and
30 835-911 IITA Nigeria Tolerant
31 ITOOK 76 IITA Nigeria Tolerant
IT 95K-2017-15 had the maximum variability for the NP,
32 98K-476-8 IITA Nigeria Susceptible SP, SC, PWT, and WWK1, and could be used in future
33 Ziso dema Buhera Zimbabwe Tolerant breeding programmes. Authors of ref. [19] used the PC
34 Chibundi mavara Buhera Zimbabwe Tolerant plot to reveal the large variation among 60-cowpea acces-
35 90K-284-2 IITA Nigeria Tolerant sions in terms of seed length and width, 100-seed weight,
36 RV 221 ARC-GC South Africa Susceptible
and seed colour.
37 RV 343 ARC-GC South Africa Tolerant
38 IT 98K-506-1 IITA Nigeria Tolerant In DIM 1 and DIM 2, SWT, NP, and SG were the major
39 Oleyin IITA Nigeria Tolerant determinants. Both groups had accessions 835-911, IT07-
40 IT 07-292-10 IITA Nigeria Tolerant 292-10, IT90-59, IT89KD288, Chibundi mavara, and TVU12746,
41 IT 08K-150-27 IITA Nigeria Moderate which were tolerant to drought, while RV344 and
42 RV500 ARC-GC South Africa Tolerant
Kangorongondo were susceptible to drought during
43 IT 90K-277-2 IITA Nigeria Tolerant
44 98D-1399 IITA Nigeria Tolerant
the first week of drought imposition.
45 ITOOK 1263 IITA Nigeria Tolerant Authors of ref. [20] observed significant and positive
46 RV 563 ARC-GC South Africa Tolerant correlations among the number of pods per peduncle and
47 IT 18 Buhera Zimbabwe Tolerant number of seeds per pod, PWT, seed length, seed thick-
48 RV 194 ARC-GC South Africa Moderate ness, SW, 100-seed weight, biomass, and harvest index at
49 335-95 IITA Nigeria Tolerant
the genotypic and phenotypic levels. Authors of ref. [21]
50 TVU 12746 IITA Nigeria Tolerant
51 IT 07-274-2-9 IITA Nigeria Tolerant revealed that at the genotypic and phenotypic levels,
52 97K-499-35 IITA Nigeria Tolerant a significant and positive correlation was shown by
53 IT 07-318-33 IITA Nigeria Tolerant pod yield in quintal per hectare with pod yield per
54 IT89-KD-288 IITA Nigeria Tolerant plant and pod length. Authors of ref. [22] observed thatPhenotyping cowpea accessions at the seedling stage for drought tolerance 443
Figure 9: The contribution of various traits and accessions to drought tolerance at the seedling stage.
the study of drought tolerance in cowpea seedlings. How-
ever, authors of [10] recommend a wide collection of
cowpea lines in order to select the most tolerant geno-
types for various growth stages as parents in a hybridisa-
tion programme.
On the cluster plot analysis, accessions in cluster
1 had higher values compared to all other clusters for
all traits investigated in this study except for SGWK1,
SGWK2, and SGWK3 after drought imposition and wilting
in WWK1 after drought imposition. In both greenhouse
Figure 10: Clustering patterns of the 60-cowpea accessions con- and glasshouse experiments, this cluster had early maturing
structed based on the neighbour-joining algorithm using and high yielding accessions that can be used in future
the unweighted pair group method (UPGMA) according to drought cowpea-breeding programmes for drought tolerance at
tolerance and yield-related traits.
the seedling stage. The accessions used in this study, how-
ever, showed very little variation as was highlighted by
UPGMA. This supports the findings of the principal com-
the genotypic coefficient of variation (GCV) was lower than
ponent analysis. The differences and similarities in acces-
the phenotypic coefficient of variation (PCV) for all studied
sions on some clusters because of their locations indicate
traits. They observed that both the GCV and PCV were
the extent of accession exchange among farmers from
reduced as drought stress went beyond 21 days among
different regions [9].
the wilting parameters and morphological traits, because
of the influence of the environment on these traits.
The main traits that accounted for variability from
PC1 to PC4 in the screen houses were PWT, PL, SP,
SWT, NP, SGWK, SC, and DTE. This implies that acces- 5 Conclusion
sions that emerged earlier and withstood the imposition
of drought had higher chances of podding and producing The findings of this study provided a useful tool for
seeds. Thus, it is imperative to consider these traits screening and determining drought-tolerant and -suscep-
in further enhancing cowpea accessions’ tolerance to tible accessions at the seedling stage. The results of
drought at the seedling stage. Authors of ref. [11] recom- the investigation were also useful in selecting accessions
mend the drought susceptibility score, percentage of per- especially for AVSD, NS, PL, PWDTH, and PWT for further
manent wilting, stem greenness and regrowth, number breeding programmes. Some accessions were able to per-
of leaves, and stem girth as the ideal traits for use in form well in both screen houses, under different temperature444 Gabriel V. Nkomo et al.
conditions. While the experiments were done in screen El-Esawi MA, editor. Legume crops - characterization and
houses, it is necessary to evaluate these accessions under breeding for improved food security [Internet]. London:
different field conditions in different agro- ecological regions. IntechOpen; 2019. [cited 2022 May 29]. doi: 10.5772/
intechopen.84985.
This would further help in screening for the stability of
[6] Singh SK, Kakani VG, Surabhi GK, Reddy KR. Cowpea (Vigna
the high tolerant accessions to drought. This stability of unguiculata [L.] Walp.) genotypes response to multiple abiotic
accessions with minimal variation in any environment or stresses. J Photochem Photobiol. 2010;100:135–46.
location can serve as a genetic pool or germplasm collection doi: 10.1016/j.jphotobiol.2010.05.013.
for the breeding of drought-tolerant cowpea accessions. [7] Hall AE, Cisse N, Thiaw S, Elawad HOA, Ehlers JD, Ismail AM,
et al. Development of cowpea cultivars and germplasm by the
bean/cowpea CRSP. Field Crops Res. 2003;82:103–34.
Acknowledgments: Many thanks go to Central University [8] Araujo ED, Melo AS, Rocha MS. Germination and initial growth
of Technology for funding this research as well as of cowpea cultivars under osmotic stress and salicylic acid.
Agricultural Research Council Grain Crops for providing Rev Caatinga. 2018;31:80–9. doi: 10.1590/1983-
facilities for this research. This manuscript is part of my 21252018v31n110rc.
[9] Alidu MS. Evaluation of cowpea genotypes for drought toler-
PhD thesis submitted to Central University of Technology
ance using the pot screening approach. Asian J Agric Res.
Free State, South Africa in 2020. The university reserves
2018;10:1–11. doi: 10.9734/ARJA/2018/45806.
the right to republish other parts of the full doctoral [10] Ajayi AT, Olumekun VO, Gbadamosi AE. Screening for drought
thesis. The full doctoral thesis is available at link: tolerance in cowpea (Vigna unguiculata (L.) Walp) at seedling
http://ir.cut.ac.za/handle/11462/2309. Also, the manuscript stage under screen house condition. Int J Food Sci Technol.
has been published online as an unrevised preprint on 2018;11:1–19.
[11] Martins CM, Lawlor DW, Quilambo OA, Kunert KJ. Evaluation of four
https://doi.org/10.1101/2020.07.10.196915.
Mozambican cowpea landraces for drought tolerance. S Afr J Plant
Soil. 2014;31(2):87–91. doi: 10.1080/02571862.2014.907453.
Funding information: This research received funding from [12] Isma’Ila M, Ramlatu MA, Zakari BG. Screening of selected
Central University of Technology Research Grant Scheme. varieties of cowpea seedlings [Vigna unguiculata (L.) Walp.]
for drought tolerance. J Biol Nat. 2015;5(1):31–8.
Conflict of interest: The authors state no conflict of [13] Singh D, Dikshit HK, Singh R. A new phenotyping technique for
screening for drought tolerance in lentil (Lens culinaris
interest.
Medik). Plant Breed. 2013;132:185–90. doi: 10.1111/pbr.12033.
[14] Muchero W, Ehlers JD, Roberts PA. Seedling stage drought-
Data availability statement: The datasets generated during induced phenotypes and drought-responsive genes in diverse
and/or analysed during the current study are available cowpea genotypes. Crop Sci. 2008;48:541–52.
from the corresponding author on reasonable request. [15] SPSS. IBM SPSS version 20. Available at www.ibm.com/
support/pages/spss-statistics-20-available-download, 2020.
[16] Padi FK. Relationship between stress tolerance and grain yield
stability in cowpea. J Agric Sci. 2004;142:431–43.
[17] DAFF. Directorate of Plant Production. Production guidelines
References for cowpeas. www.arc.agric.za/Cowpea Production
Guidelines.pdf, 2011.
[1] Boukar O, Belko N, Chamarthi S, Togola A, Batieno J, Owusu E, [18] Alidu MS, Asante IK, Tongoona P, Ofori K, Danquah A, Padi FK.
et al. Cowpea (Vigna unguiculata). J Genet Genom Plant Breed. Development and screening of cowpea recombinant inbred
2018;00:1–10. doi: 10.1111/pbr.12589. lines for seedling drought tolerance. J Plant Breed Crop Sci.
[2] FAOSTAT. Food and Agriculture Organization of the United 2019;11:1–10. doi: 10.5897/JPBCS2018.0768.
Nations Statistics Division. Available at: http://faostat3.fao. [19] Al-Saady NA, Nadaf SK, Al-Lawati AH, Al-Hinai SA. Germplasm
org/download/Q/QC/E, 2017. collection and seed diversity of cowpea (Vigna unguiculata (L.)
[3] Gull M, Sofi PA, Mir RR, Ara A, Dar SA, Bhat MA. Maturity, Walp.). Asian J. Agric. Food Sci. 2018;6:129–39.
biomass partitioning and growth response indices in cowpea [20] Walle T, Mekbib F, Amsalu B, Gedil M. Correlation and path
(Vigna unguiculata L.) under water stress. Int J Agric Environ coefficient analyses of cowpea (Vigna unguiculata L.) land-
Biotechnol. 2018;11(6):863–9. doi: 10.30954/0974- races in Ethiopia. Am J Plant Sci. 2018;9:2794–812.
1712.12.2018.7. doi: 10.4236/ajps.2018.913202.
[4] Kyei-Boahen S, Savala CEN, Chikoye D, Abaidoo R. Growth and [21] Diwaker P, Sharma MK, Soni AK, Diwaker A, Singh P. Character
yield responses of cowpea to inoculation and phosphorus association and path coefficient analysis in Vegetable Cowpea
fertilization in different environments. Front Plant Sci. [Vigna unguiculata (L.) Walp]. J Pharmacognosy Photochem.
2017;8:646. doi: 10.3389/fpls.2017.00646. 2018;7:2289–93.
[5] Gomes AMF, Nhantumbo N, Ferreira-Pinto M, Ferreira-Pinto M, [22] Ajayi AT, Olumekun VO, Gbadamosi AE. Estimates of genetic
Massinga R, Ramalho JC, et al. Breeding elite cowpea [Vigna variation among drought tolerant traits of cowpea at seedling
unguiculata (L.) Walp] varieties for improved food security and stage. Int J Plant Res. 2017;7(2):48–57. doi: 10.5923/
income in Africa: opportunities and challenges. In: j.plant.20170702.04.You can also read