PERSPECTIVES MARKET AND ALLOCATION - Our experts monthly overview - Ofi Invest Asset Management
←
→
Page content transcription
If your browser does not render page correctly, please read the page content below

PERSPECTIVES
MARKET AND ALLOCATION
Our experts monthly overview

March 2023
Document completed on 10/03/2023

PERSPECTIVES
                                                                           Éric BERTRAND
                                                                           Deputy Chief Executive Officer,
                                                                           Chief Investment Officer
                                                                           OFI INVEST

                                       OUR CENTRAL SCENARIO

                                       Interest rates rose sharply over the month, as we had predicted the
                                       previous month, returning to levels that now seem more consistent
                                       with our expectations for the monetary tightening cycle. Short-
                                       term interest rates reached a high point, having risen slightly (to
                                       around 5.50% for the US Federal Reserve and 4% for the European
                                       Central Bank). Furthermore, the fixed income markets pushed back
                                       the first interest rate cuts by central banks until much later. This is
                                       in keeping with our scenario that interest rates are going to remain
                                       in restrictive territory as long as it takes for core inflation to begin
                                       trending downwards, and the latest statistics show no real signs of
                                       this happening.

    The analyses presented in          We have therefore resumed a neutral stance on bonds. There is a
    this document are based on
    the assumptions and expec-
                                       possibility that interest rates are going to stretch further in the short
    tations of Ofi Invest Asset        term as and when inflation and growth statistics are released, and
    Management, These anal-
    yses were made as of the           investors could take advantage of this to overweight sovereign bonds
    time of this writing. It is pos-   as an asset class. Given the attitude adopted by central banks, interest
    sible that some or all of them
    may not be validated by            rates should ease off moderately in the second half of the year if
    actual market performanc-          growth slows down as expected.
    es. No guarantee is offered
    that they will prove to be
    profitable. They are subject       On the credit side, carry levels are already such that we have increased
    to change.
                                       our exposure to both Investment Grade and High Yield bonds a notch.
    A glossary listing the defini-
    tions of all the main financial
    terms can be found on the          The equity markets continued to hold up well against this backdrop
    last page of this document.
                                       of rising bond yields, driven by surprisingly resilient growth and
                                       expectations of a less severe slowdown than initially thought.
                                       Earnings forecasts were revised upwards as a result, enabling share
                                       prices to hold steady at current levels. There is plenty of uncertainty
                                       surrounding central bank action going forward - both in the short
                                       term as regards how high rates need to go in order to keep inflation
                                       in check, and in the medium term as regards their impact on growth.
                                       We are therefore sticking with our cautious stance for the short term,
                                       but see no reason to question our positive outlook for the full year.

                                       The recent drop in the Chinese market has made us somewhat more
                                       bullish given the country’s economic growth prospects for this year.

2
Underweight Neutral Overweight
Our allocation as of 10/03/23
-- - = + ++
ASSET CLASSES
The surge in sovereign yields over the course of February was Money market
driven by expectations that central banks are going to tighten Bonds
monetary conditions more sharply and for a longer period of time.
At this stage, our view is that the market’s key interest rate Convertibles
expectations are now high enough to take profits on our Equities
underweight sovereign bonds position. We remain cautious about
equities given the possible risks surrounding inflation (upside risks)
Commodities
and growth (downside risks). Alternatives/Absolute return
BONDS
The scenario that central banks are going to keep interest rates higher Euro core sov. debt
and, above all, for longer spread throughout the market, wiping out the Euro periphery sov. debt
effects of January’s bond rally. The market’s current key interest rate
expectations now seem more coherent. We have therefore revised our Euro Investment Grade
position on duration and resumed a neutral stance on sovereign debt. High Yield
Yields on Investment Grade and High Yield credit are all the more attractive
thanks to this rise in interest rates. However, credit spreads (particularly in
Inflation-linkers/Breakeven
the High Yield segment) have narrowed in recent weeks, partly absorbing Emerging debt, hard currency
the uptrend in interest rates. We would therefore not rule out the
possibility that risk premiums might widen a little if sovereign yields
Emerging debt, local currency
consolidate.
EQUITIES
Valuation levels on the equity markets look coherent given that United States
the bond markets have not experienced any further tension and
corporate earnings forecasts have not been revised downwards
Eurozone
at all severely. In the short term, concerns about central bank UK
monetary policies and inflation indicators could create more volatility. Japan
In these circumstances, we appreciate the Chinese market from a
relative viewpoint as it has recently turned downwards. Emerging markets
China
EQUITIES BY SECTORS / STYLES
Stretched interest rates have recently taken a toll on growth Growth
stocks. Such stocks might be penalised further if tensions appear Value
in the bond markets, but they have a defensive profile so are
unlikely to underperform cyclical stocks any more than they have Small / Mid caps
done. The financial sector (banking especially) is undervalued Cyclicals
and should continue to benefit from a more propitious interest rate
environment.
Financials
CURRENCIES
The dollar has been buoyed up by a vigorous US economy and thus USD
by expectations of more aggressive monetary tightening by the Fed. Yen
The ECB remains hawkish on inflation and is against monetary
tightening. Pending the arrival of the Bank of Japan’s new chairman Livre sterling
on 20th March, the yen continues to mirror the dollar and the
US interest rate outlook.
Notice: the allocation policy presented applies to multi-asset funds managed by Ofi Invest Asset Management (including profile funds). The investment horizon of this
allocation policy is short term and subject to change. This investment policy therefore does not constitute an indication for building a client’s long-term allocation.
3
MACROECONOMIC VIEW
    INFLATION SURPRISES
    ON THE UPSIDE ONCE AGAIN
                                               CENTRAL BANKS                                          MARKETS SEE INFLATION REMAINING
                                               UNDER PRESSURE                                         ABOVE 2% FOR SOME TIME
                                               For the time being, the markets are                    The situation in the euro zone differs
                                               pricing in a soft landing for the US                   from that in the USA: not only is its core
                                               economy thanks to growth in both                       inflation rate likely to exceed the USA’s in
                                               jobs and consumer spending. But                        absolute terms, but it is also still trend-
                                               there are clear signs that these fac-                  ing upwards and set to continue doing
                                               tors are running out of steam (not                     so until at least the spring according to
                                               including the real estate sector). For                 our central scenario. The markets cur-
                                               instance, the manufacturing sector                     rently see inflation remaining above 2%
                                               has contracted for 4 months now                        for some time and across all horizons.
           Ombretta SIGNORI                    according to survey results, and                       This undermines the ECB’s credibility and
     Head of Macroeconomic Research            financing terms and conditions have                    sets the scene for it to adopt a hawkish
               and Strategy                    worsened significantly for business-                   tone when it announces its next 50-basis
      OFI INVEST ASSET MANAGEMENT              es, which suggests that lenders are                    point hike in interest rates at the mon-
                                               rationing credit. In all logic, these                  etary policy committee meeting sched-
                                               signs should point to a steeper slow-                  uled for 16th March.
    Central banks are rightly concerned        down over the coming quarters. But                     As far as good news is concerned, pro-
    about how sticky inflation is proving to   the longer it takes for the slowdown                   duction prices in January were rather
    be, and they have by no means won          to materialise, the greater the risk                   reassuring and suggest that inflation in
    the inflation battle yet. On an annual-    that the US Federal Reserve (Fed) will                 industrial goods and food prices could
    ised basis, the least volatile compo-      have to do more to calm inflation. So                  peak within the next few months. How-
    nents of inflation are still too high at   a risk analysis leans towards higher                   ever, when it comes to services inflation
    5.6% in February in the euro zone and      key interest rates than in our current                 - which is correlated with wage infla-
    at 5.6% in January in the USA. Central     scenario, which sees them peaking at                   tion, as mentioned earlier - there is not
    bankers have already explained that        5.25% in this cycle; we might there-                   enough evidence to suggest that the
    services inflation is the key compo-       fore revise our scenario upwards next                  uptrend is about to reverse. For the time
    nent to watch as it is the mostly close-   month. The Fed will present its new                    being, the cycle is proving more resilient
    ly correlated with wage inflation and      projections during the FOMC mone-                      than expected - surveys currently indi-
    therefore with conditions in the job       tary policy meeting on 22nd March,                     cate that growth in economic activity is
    market, and this in turn is what drives    and the FOMC members’ interest                         going to remain positive in the first quar-
    demand and pricing pressure.               rate forecasts might already signal                    ter of 2023. And this poses upside risks
                                               an upward revision to those issued in                  both to inflation and to our predicted
    Tight job markets on both sides of         December; the scale of this upward                     trajectory for ECB interest rates: our 3.5%
    the Atlantic are boosting consumer         revision will undoubtedly depend on                    target for the deposit rate is now a floor
    spending, but this is not the only fac-    the February job and inflation statis-                 level rather than a ceiling for key interest
    tor. US households have tapped into        tics published in March.                               rates in 2023.
    the savings glut that built up during
    the Covid crisis, whereas the data
    available in Europe shows that Euro-                                 EURO ZONE INFLATION OVER 1 YEAR
    pean consumers have not yet used
    up their Covid-related savings sur-             In %
                                               11                 ECB target          Core inflation          Total inflation
    plus, and it is therefore the various      10
    measures introduced by the region’s        9
                                                                                                                                              8.5%
    governments that have helped them          8
    absorb the energy shock. Alongside         7
    these internal upside inflation risks      6
                                                                                                                                              5.6%
    there are other external risks, above      5
    all the impact that the Chinese econ-      4
    omy’s reopening is going to have on        3
    commodity prices.                          2
                                                1
                                               0
                                               -1
                                                    2002   2004   2006    2008       2010    2012     2014     2016     2018   2020   2022

                                                                               Sources: Macrobond, Ofi Invest Asset Management as of 07 March 2023

4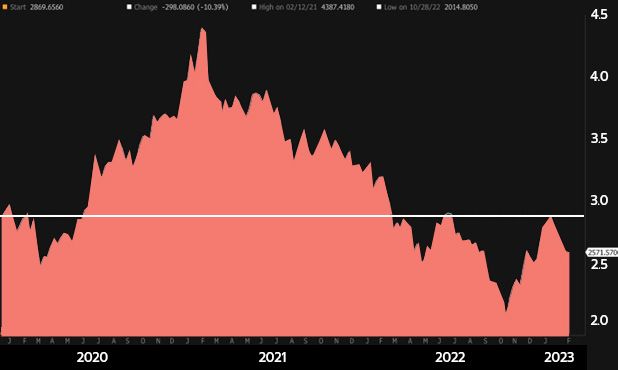
INTEREST RATES
STICKY INFLATION AND BOND YIELDS
ON THE RISE
                                          than anticipated. The German 2Y rate               STILL PLENTY OF APPETITE FOR RISK
                                          jumped from 2.65% to 3.20% over the                AND CARRY
                                          month and the 10Y rate increased
                                                                                             The main market sentiment indicators
                                          by almost as much to a new high of
                                                                                             remain healthy, as reflected in bond
                                          2.75% in early March. Meanwhile, the
                                                                                             and credit spreads. Italy’s 10Y spread,
                                          US 10Y rate rose from 3.50% to over
                                                                                             for instance, is still low at just 180
                                          4.00%.
                                                                                             basis points above the German 10Y
                                                                                             rate; this is well below the 2022
                                          WHEN CAN WE EXPECT THE MON-
                                                                                             peak of 250 basis points. Similarly,
                                          ETARY TIGHTENING CYCLE TO END?
                                                                                             credit spreads held relatively steady
        Geoffroy LENOIR                   We still think inflation is going to               in February. The Investment Grade
        Co-CIO, Mutual Funds              prove stickier than the markets                    credit market’s performance was
  OFI INVEST ASSET MANAGEMENT             expect. Inflation expectations were                therefore mainly penalised by the
                                          indeed already revised significantly               interest rate component, whereas
                                          higher in February. The euro zone’s                credit spread fundamentals remain
                                          5Y5Y inflation swap rate monitored                 solid. High Yield credit proved
The big central banks are still moving    by the ECB climbed from 2.30%                      more resilient as this segment is
forward with their monetary tightening    to 2.60%, its highest level for more               less sensitive to interest rates and
cycles. Key interest rates are rising
                                          than 10 years… and above the US                    spreads narrowed a little. Within this
gradually, pushing short-term interest
                                          equivalent, which is something that                High Yield segment, however, we
rates on the money markets up with
                                          happens only rarely. The ECB will thus             have a preference for the best-rated
them. As a result, the 3M Ester swap
rate increased from 2.58% to 2.95%        have to take an even firmer stance                 issuers. The credit market is being
over the space of a month. Bond           in its efforts to tackle inflation. Two            buoyed up by revisions to growth
yields are more exposed to the            forces are therefore likely to come up             projections in Europe and by sound
continued uncertainty (in Europe but      against each other over the coming                 corporate earnings, underpinning our
also in the USA) about how long the       months: the signals sent out by                    constructive approach to this asset
monetary tightening will last and how     central bankers on the one hand, and               class and our view that it offers carry
far it will go.                           bond market valuations on the other.               opportunities.
                                          Current valuations seem particularly
The downtrend in bond yields              attractive for long-term investors but             In the short term, we expect the
observed in January came with             also for more speculative investors.               interest rate component to bolster the
encouraging signals about inflation
                                                                                             bond markets; this is likely to benefit
and growth, suggesting that the cycle
                                          The markets seem to be pricing in                  sovereign bonds but also corporate
would soon come to an end. As we
                                          an already strong reaction from the                bonds, again from a carry perspective.
said last month, we thought it was too
early to expect bond yields to fall any   central banks. In these circumstances,             The Investment Grade credit market,
further. The market proved us right       we see little upside potential for bond            however, might have to compete with
in February as bond yields picked         yields in the short term, and so we                money-market products, whereas
up again after the US and European        have a somewhat neutral position on                High Yield credit should fare well if
inflation statistics came out stronger    duration.                                          spread volatility remains low.

      FIGURE OF THE MONTH                 PERFORMANCES
   The market has factored in higher      Bond indices with coupons reinvested
       inflation in the euro zone:                                                          February 2023                      YTD

           2.60%                           JPM Emu
                                           Bloomberg Barclays
                                                                                                 -2.24%
                                                                                                  -1.44%
                                                                                                                              0.06%
                                                                                                                              0.75%
    This is the average 5-year 5-year      Euro Aggregate Corp
   forward inflation expectation rate,     Bloomberg Barclays                                     0.11%                       3.32%
       its highest level in 10 years.      Pan European High Yield in euro

                                                             Sources: Ofi Invest Asset Management, Refinitiv, Bloomberg as of 28 February 2023.
                                                                           Past performances are not a reliable indicator of future performances.

                                                                                                                                                    5
EQUITIES
    EUROPEAN EQUITIES: ARE INVESTORS
    WEARING ROSE-TINTED GLASSES?
                                              down by a further -19%, i.e. -39% YTD)                more than 10% since peaking in
                                              and consumer spending is proving                      January and appears more attractive
                                              resilient. Meanwhile, companies have                  in relative terms.
                                              reported healthy results and, perhaps
                                              more      importantly,     issued   solid             HIGHER INTEREST RATES IMPACT-
                                              guidance for this financial year. The                 ING ON SECTOR PERFORMANCES
                                              picture would look almost perfect if
                                                                                                    Sector performances partly reflect
                                              the inflation statistics hadn’t surprised
                                                                                                    the upward movement in interest
                                              on the upside both in the USA and
                                                                                                    rates, with the banking sector
                                              the euro zone.
                                                                                                    performing well but the real estate
                                                                                                    sector doing badly and profits being
                                              For now, investors are clearly opting
             Éric TURJEMAN                                                                          taken on sectors that are trading on
                                              to focus their attention more on the
            Co-CIO, Mutual Funds                                                                    high multiples such as luxury and
                                              upward revisions to global growth
      OFI INVEST ASSET MANAGEMENT                                                                   technology. They also partly reflect
                                              forecasts than on those being made
                                                                                                    the pleasant surprises delivered by
                                              to inflation forecasts. We all know
                                                                                                    this earnings season. Going forward,
                                              that corporate earnings are closely
    To infinity and beyond! Europe’s equi-                                                          we do not expect to see a major
                                              correlated with global economic
    ty markets remain in remarkably good                                                            difference between growth stocks
                                              growth. By approaching the 3% mark,
    health despite the upward pressure                                                              and more cyclical stocks in terms of
                                              economic forecasters are beginning
    on long-term interest rates on both                                                             performance, but we do think that
                                              to factor in the possibility of (albeit
    sides of the Atlantic and despite all                                                           rising long-term interest rates will
                                              modest) earnings growth in 2023, at
    the international geopolitical tension.                                                         continue to shore up bank stocks
                                              least in Europe.
    The EuroStoxx 50 index closed in on                                                             which are trading on rather low
    its historical high in February while                                                           multiples.
                                              WHICH COULD BOLSTER
    the CAC 40 overtook it. The eupho-        EARNINGS GROWTH
    ria was muted in the USA and Chi-                                                               Paradoxically, the main risk to the
    na as their main equity indices have      A geographic analysis shows that the                  equity markets could be that of more
    not made even half of the gains that      US market (where stocks are trading                   good economic news. This might
    Europe’s have year-to-date.               on about 18 times estimated 2023                      push interest rates higher, especially
                                              earnings) is indisputably dearer than                 as inflation statistics remain slightly
                                              its European counterparts (where                      above expectations.       The coming
    GROWTH FORECASTS
                                              valuation multiples average no more                   weeks are unlikely to threaten our
    BEING REVISED UPWARDS
                                              than 13). And yet the US appears to                   year-end double-digit growth targets
    The International Monetary Fund has       be more of a safe haven whenever                      for equity markets across the board,
    raised its global growth forecast for     volatility picks up. This is why we                   but they could create opportunities
    2023 from 2.7% to 2.9% as China’s         have not incorporated a hierarchy                     for investors to beef up their
    economy is poised for a recovery,         between these regions into our                        exposures at slightly lower levels. This
    the energy situation in Europe is         recommendations.      China’s  equity                 is why we remain somewhat cautious
    returning to normal (with gas prices      market, on the other hand, has shed                   for the short term.

          FIGURE OF THE MONTH                 PERFORMANCES
                                              Equity indices with net dividends reinvested, in local currencies

                   3%                                                                      February 2023                            YTD
            The global growth rate
         that would enable European            CAC 40                                            2.62%                            12.39%
         corporate earnings to avoid           EuroStoxx                                         1.92%                            11.40%
              a downturn in 2023
                                               S&P 500 in dollars                               -2.49%                             3.60%
                                               MSCI AC World in dollars                         -2.87%                             4.10%

                                                                    Sources: Ofi Invest Asset Management, Refinitiv, Bloomberg as of 28 February 2023.
                                                                                  Past performances are not a reliable indicator of future performances.

6
EMERGING MARKETS
                                                                                     A BRAND

CHINA: A “SPONTANEOUS” RECOVERY
WITH NO REAL GLOBAL IMPACT?
                                                   economy over the past decade has                    improve its balance sheet rather than
                                                   been huge: with its annual GDP                      to boost growth.
                                                   growth ranging between 5% and 10%,                  • The current recovery is therefore
                                                   its contribution to global economic                 being driven mainly by the effects of
                                                   growth has varied from 30% to 50%                   pent-up demand among consumers.
                                                   depending on the year. But things                   As a result, the consequences for the
                                                   look different this time around, for                commodity markets could prove quite
                                                   various reasons:                                    moderate. The extra demand for oil
                                                   • China’s previous recoveries in                    as the country gets moving again is
                                                   recent years have been boosted by                   likely to be fuelled by purchases from
                                                   investment plans, focused mainly on                 Russia at far lower prices than on the
                                                   infrastructure and real estate. Funding             global market. The consumer goods
    Jean-Marie MERCADAL                            was secured by local government-                    and services sectors will therefore
      Chief Executive Officer                      issued debt and by fiscal and                       be among the main beneficiaries of
   SYNCICAP ASSET MANAGEMENT                       monetary incentives. This is what                   this economic recovery: household
                                                   happened after the global financial                 spending could jump by 14% this
                                                   and economic crisis of 2008/2009                    year, accounting for 80% of the total
For the first time in 15 years, China’s            and after China’s slowdown in 2015.                 growth expected in 2023!
economic recovery is not being                     But it will not be the case this time.
driven by government stimulus.                     The central government wants to                     In the medium term, the Chinese
Growth disappointed in 2022 at 3%                  avoid reviving property speculation.                authorities seem to be aiming more
and the growth target for this year                It has only taken certain emergency                 for a certain degree of financial
has been set at “just” 5%. With the                measures in an effort to stabilise                  equilibrium and a stable economy
14th National People’s Congress                    the market, which has plummeted in                  and society, rather than rampant
having just begun, the real objectives             recent months, and to enable ongoing                growth fuelled by the real estate
announced for the medium term are                  building projects to be completed.                  and infrastructure industries. The
stability and balance. So, this time,              But confidence in this sector appears               5% GDP growth target set for 2023
China’s recovery is probably not                   to have been shaken for good, on top                thus seems very conservative indeed
going to have the same impact on                   of which the population is shrinking                for a “reopening” year.     The 3%
the global economy…                                due to a very low birth rate. So we                 budget deficit target is also below
                                                   can see why the real estate sector is               expectations. This means that China’s
China’s    abrupt    reopening    has              unlikely to shore up the economy in                 recovery this time around might
triggered a spectacular upturn in                  the years ahead.                                    have a smaller impact on the global
the country’s economic activity. As is             Meanwhile, the Chinese authorities                  economy and might curb the rise
the case each time China’s economic                are beginning to pay closer attention               in commodity prices and in inflation
growth bounces back, questions are                 to the country’s overall debt level,                more generally. This would be good
being asked about the impact this                  especially as the costs of their zero               news in helping to secure market
will have on global economic activity              Covid policy have also taken a heavy                equilibrium this year; longer term,
because of the country’s size (about               toll on public finances. So the logic               it could be an early indication that
20% of the world’s population) and                 this time around has been turned on                 China’s economy is going to become
large share of global GDP (around                  its head: the government now wants                  more disconnected from the rest of
25%). China’s influence on the global              the economy to recover in order to                  the world.

      FIGURE OF THE MONTHS                         MSCI CHINA ALL SHARES INDEX SINCE 31/12/2019                 Source: Bloomberg as of 28/02/2023

             22.8%
  Bloomberg’s earnings consensus
   out to 12 months for companies                                                                                                    +45%
 in the MSCI China All Shares index,
     pointing to a 12-month PER                                                                                                           -10%
            of around 11.8.

  Source: Bloomberg as of end-February 2023
                                                   Having gained 45% between the start of November and end of January, the MSCI China
                                                   All Shares index - comprising of 50% Chinese stocks listed locally and 50% listed in
                                                   Hong Kong - has lost around 10% since peaking in January.

Syncicap AM is a portfolio management company owned by Ofi Invest (66%) and Degroof Petercam Asset Management (34%), certified on 4 October 2021
by the Hong Kong Securities and Futures Commission. Syncicap AM specialises in emerging markets and provides a foothold in Asia, from Hong Kong.

                                                                                                                                                     7
A new dimension for the future

                                                                                                                          Expertise
                                                                                                                    Core portfolio management,
                                                                                                                        asset allocation, and
                                                                                                                        investment solutions
                              €180bn                                                 5th                                           •
                              In assets under                                Largest French                         Alternative & diversification
                                                                             asset manager                                    strategies
                                management
                         (as of end-December 2022)                          (source : IPE ranking,                                 •
                                                                               December 2021)                        Real-estate management

                                                                                                                                                                                of a fund or of the asset manager.
                                                                                                                                                                                References to a ranking are not a
                                                                                                                                                                                reliable indicator of future results
                   Ofi Invest is one of the four brands of Aéma Groupe, alongside MACIF, Abeille Assurances
                   and AÉSIO mutuelle, and is now the 5th-largest French asset management group.
                   Ofi Invest has more than 600 employees committed to serving institutionals, professionals
                   and individuals - clients and members of partner distribution networks - in France and
                   internationally.
                   Ofi Invest encompasses all asset management business lines in listed and non-listed assets.

                                                               www.ofi-invest.com

    Glossary
    Investment Grade / High Yield credit: Investment Grade bonds refer to bonds issued by borrowers that have been rated highest by the rating agencies. Their
    ratings vary from AAA to BBB- under the rating systems applied by Standard & Poor’s and Fitch. Speculative High Yield bonds have lower credit ratings (from
    BB+ to D, according to Standard & Poor’s and Fitch) than Investment Grade bonds as their issuers are in poorer financial health based on research from the
    rating agencies. They are therefore regarded as riskier by the rating agencies and, accordingly, offer higher yields.
    Spread: difference between interest rates. Credit spread is the difference in interest rate between a corporate bond and a same-dated benchmark bond that
    is regarded as the least risky (benchmark government bond). Sovereign spread is the difference in interest rate between a sovereign bond and a same-dated
    benchmark bond that is regarded as the least risky (German benchmark government bond).
    Volatility: a measure of the amplitudes of price variations of a financial asset. The higher the volatility, the riskier the investment is considered to be.
    Inflation: the loss of a currency’s purchasing power, translating into a widespread and lasting increase in prices. Core inflation refers to inflation excluding
                                                                                                                                                                                                          Printed on PEFC paper (sustainable forest management)

    energy and food.
    Duration: the weighted average life of a bond or bond portfolio expressed in years.
    Carry: a strategy that consists in holding bonds in a portfolio, possibly even till maturity, in order to tap into their yields.
    PER: Price to Earnings Ratio. A stock market analysis indicator consisting in dividing price by earnings.

    Important notice
    This promotional document was produced by Ofi Invest Asset Management, a portfolio management company (APE code: 6630Z) governed by French law and certified
    by the French Financial Markets Authority (Autorité des Marchés Financiers (AMF)) under number GP 92-12 – FR 51384940342. Ofi Invest Asset Management is a société
    anonyme à conseil d’administration [a joint-stock company with a board of directors] with authorised capital of 71,957,490 euros, whose registered office is located
    at 22, rue Vernier 75017 Paris, France and is entered into the Paris Register of Trade and Companies (Registre du Commerce et des Sociétés de Paris) under number
    384 940 342. This promotional document contains information and quantified data that Ofi Invest Asset Management considers to be well-founded or accurate on
    the day on which they were produced. No guarantee is offered regarding the accuracy of information from public sources. The analyses presented are based on the
    assumptions and expectations of Ofi Invest Asset Management at the time of the writing of this document. It is possible that such assumptions and expectations may
    not be validated on the markets. They do not constitute a commitment to performance and are subject to change. This promotional document offers no assurance
    that the products or services presented and managed by Ofi Invest Asset Management will be suited to the investor’s financial standing, risk profile, experience or
    objectives, and Ofi Invest Asset Management makes no recommendation, advice, or offer to buy the financial products mentioned. Ofi Invest Asset Management may
    not be held liable for any damage or losses resulting from use of all or part of the items contained in this promotional document. Before investing in a mutual fund, all
    investors are strongly urged, without basing themselves exclusively on the information provided in this promotional document, to review their personal situation and
    the advantages and risks incurred, in order to determine the amount that is reasonable to invest. Photos: Shutterstock.com/Ofi Invest. FA23/0032/09032024.

        Ofi Invest Asset Management • 22, rue Vernier 75017 Paris - FRANCE • Portfolio management company • RCS Paris 384 940 342
         Certified under N° GP 92-12 • S.A. with a board of directors and share capital of €71,957,490 • APE 6630 Z • FR 51384940342

8
You can also read


