PENSIONOMICS 2023 MEASURING THE ECONOMIC IMPACT OF DB PENSION EXPENDITURES - January 2023
←
→
Page content transcription
If your browser does not render page correctly, please read the page content below

PENSIONOMICS
2023
MEASURING THE ECONOMIC
IMPACT OF DB PENSION
EXPENDITURES

          By Ilana Boivie and Dan Doonan

          January 2023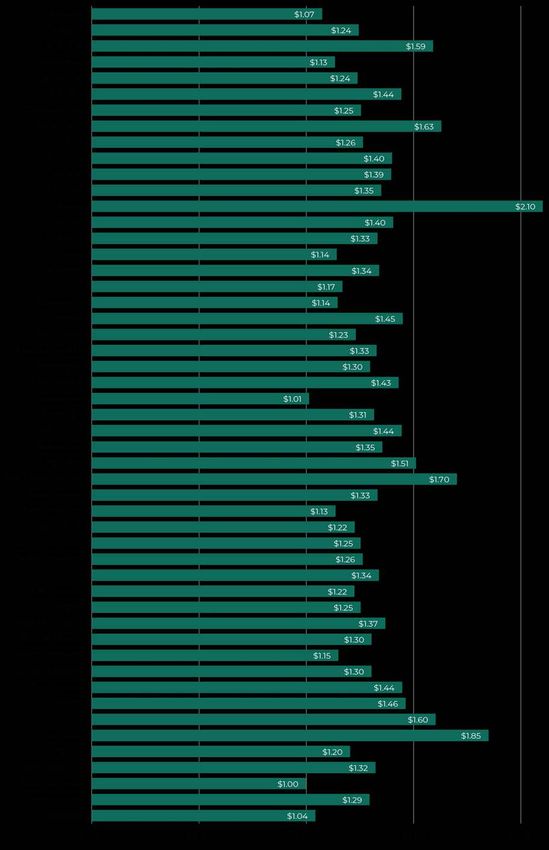
PENSIONOMICS 2023

ABOUT THE AUTHORS
Ilana Boivie is a Senior Economist with the International Association of Machinists and Aerospace Workers, with
a specialization in retirement and health benefit plans. On behalf of the IAMAW, she conducts labor research and
economic analysis regarding contract negotiations and labor policy issues. Previously, she worked as a Senior Policy
Analyst with the DC Fiscal Policy Institute, focusing on strengthening job training and improving working conditions
for workers in the District of Columbia. As a Research Economist for the Communications Workers of America, Ilana
served as the subject matter expert on retirement policy, and provided bargaining and policy support on health care
issues. Prior to that, she served as Director of Programs for the National Institute on Retirement Security, where she
conducted original research and analysis of national retirement issues. She speaks frequently on retirement and
economic matters, and has testified before federal, state, and local policymakers regarding her research. Ilana holds
an M.A. in economics from New Mexico State University and a B.A. in English from Binghamton University, where she
graduated Magna Cum Laude.

Dan Doonan is the executive director of the National Institute on Retirement Security. With the Board of Directors,
Doonan leads the organization's strategic planning, retirement research and education initiatives. Doonan has more
than 20 years of experience working on retirement issues from different vantage points including an analyst, consultant,
trainer, and a plan trustee. He comes to NIRS after serving as a senior pension specialist with the National Education
Association. Doonan began his career at the Department of Labor as a mathematical statistician. He then spent seven
years performing actuarial analysis with Buck Consultants in the retirement practice. His experience also includes
positions as a research director and labor economist. Doonan holds a B.S. in Mathematics from Elizabethtown College
and is a member of the National Academy of Social Insurance.

ACKNOWLEDGEMENTS
We are grateful for the comments, advice, and assistance provided by Tyler Bond, Kelly Kenneally, Alexander Measure, and Celia
Ringland. The core methodology in this study was reviewed by experts in the 2009 and 2012 editions of this study. The views in
this report and any errors or omissions are those of the authors alone.

MEASURING THE ECONOMIC IMPACT OF DB PENSION EXPENDITURES                                                                   1

EXECUTIVE SUMMARY
Defined benefit (DB) pension benefits not only provide a      in 2020. For state and local government pension plans,
secure source of income for many retired Americans, they      we also analyze these impacts at the state level for each
also contribute substantially to local, state, and national   of the 50 states and the District of Columbia. Because of
economies. DB pensions play a vital role in sustaining        methodological refinements, explained in the Technical
consumer demand that ultimately supports millions of jobs.    Appendix, both the national and state level results are not
                                                              directly comparable to those in previous versions of this
Virtually every state and local economy across the country    study.
benefits from the spending of pension checks. For example,
when a retired nurse residing in the state of Wisconsin       The economic gains attributable to DB pension expenditures
receives a pension benefit payment, s/he spends the pension   are considerable. This study finds that, in 2020:
check on goods and services in the local community. S/
he purchases food, clothing, and medicine at local stores,    $612.6 billion in pension benefits were paid to 24.6 million
and may even make larger purchases like a car or laptop       retired Americans, including:
computer. These purchases, combined with those of other       • $334.8 billion paid to some 11.5 million retired
retirees with pensions, create a steady economic ripple            employees of state and local government and their
effect. In short, pension spending supports the economy            beneficiaries (typically surviving spouses);
and supports jobs where retirees reside and spend their       • $90.3 billion paid to some 2.7 million federal government
benefits. Pension expenditures may be especially vital to          beneficiaries;
small or rural communities, where other steady sources of     • $187.4 billion paid to some 10.4 million private sector
income may not be readily found if the local economy lacks         beneficiaries, including:
diversity.                                                         • $47.2 billion paid out to 4.0 million beneficiaries of
                                                                       multi-employer pension plans, and
Additionally, reliable pension income can be especially            • $140.2 billion paid out to 6.4 million beneficiaries of
important not only in providing retirees with peace of                 single-employer pension plans.
mind, but in stabilizing local economies during economic
downturns. Retirees with DB pensions know they are            Expenditures made out of those payments collectively
receiving a steady check despite economic conditions.         supported:
In contrast, retirees may be reluctant to spend out of        • 6.8 million American jobs that paid $422.2 billion in
their 401(k)-type accounts if their savings are negatively       labor income;
impacted by market downturns. To the extent that DB           • $1.3 trillion in total economic output nationwide;
pensions provide retirees with steady income available for    • $738.5 billion in value added (GDP);
spending regardless of fluctuations in the stock market, DB   • $157.7 billion in federal, state, and local tax revenue.
pensions may play a stabilizing role in the economy like
Social Security.                                              DB pension expenditures have large multiplier effects:
                                                              • Each dollar paid out in pension benefits supported
In 2020, a global pandemic, unprecedented in generations,        $2.13 in total economic output nationally.
spread around the world. The global economy came to an        • Each taxpayer dollar contributed to state and local
abrupt standstill, and remained devastated for months.           pensions supported $7.89 in total output nationally. This
During this time, DB pension income was crucial, as many         represents the leverage afforded by robust long-term
retirees were reluctant to spend 401(k) assets, and many         investment returns and shared funding responsibility
Americans found themselves suddenly out of work.                 by employers and employees.

This study analyzes data on DB pension plans in both the      The largest employment impacts occurred in the food
public and private sectors to assess the overall national     services, health care, and retail trade sectors.
economic impact of benefits paid by these plans to retirees
PENSIONOMICS 2023 2
INTRODUCTION: MEASURING
THE ECONOMIC IMPACT OF DB
PENSIONS
Virtually every state and local economy across the country Background: DB Pensions in the United States
benefits from the spending of defined benefit (DB) pension
payments. For example, when a retired nurse residing in the Defined benefit (DB) pension plans have existed in the
state of Wisconsin receives a pension benefit payment, s/he United States since the 19th century. In the private sector,
spends the pension check on goods and services in the local the first DB pension plan was introduced in 1875 by the
community. S/he purchases food, clothing, and medicine at American Express Company. Over time, many private sector
local stores, and may even make larger purchases like a car employers saw the value of offering DB pension coverage
or laptop computer. These purchases, combined with those to their employees, as these benefits not only were quite
of other retirees with pensions, create an economic ripple valued by workers, but from a human resource management
effect. In short, pension spending supports the economy perspective, they also acted as an effective recruitment
and supports jobs where retirees reside and spend their and retention tool. Although private sector DB plans have
benefits. Pension expenditures may be especially vital to experienced a decline in recent decades (due in large part
small or rural communities, where other steady sources of to a difficult regulatory environment), in 2020, 25 percent
income may not be readily found if the local economy lacks of full-time civilian employees had access to DB pension
diversity. coverage. Yet, roughly half of workers with these plans were
still in “open plans,” in which all workers are still accruing
Additionally, reliable pension income can be especially benefits.
important not only providing retirees with peace of mind, but
in stabilizing local economies during economic downturns. In the public sector, Congress created the Civil Service
Retirees with DB pensions know they are receiving a steady Retirement System (CSRS) to provide a pension for civilian
check despite economic conditions. In contrast, retirees may federal employees in 1920. In 1986, Congress implemented
be reluctant to spend out of their 401(k)-type accounts if the new Federal Employee Retirement System (FERS),
their savings are negatively impacted by market downturns. which includes Social Security, a DB annuity, and a 401(k)-
To the extent that DB pensions provide retirees with steady type savings plan, called the Thrift Savings Plan. While
income available for spending regardless of fluctuations in many major municipalities offered pensions to police and
the stock market, DB pensions may play a stabilizing role firefighters and 21 states had pensions plans covering
in the economy like Social Security. This can be especially teachers by the 1920s, state and local pension systems began
crucial during a time of extreme economic turmoil, such as to take root on a large scale during the Great Depression.
the 2020 Covid-19 pandemic- related economic shutdown. When Social Security was established in 1935, the system
left out state and local workers, and many states acted to
The purpose of this study is to quantify the economic impact develop their own retirement systems for their employees.
of DB pension payments in the U.S. and in each of the 50 Between 1931 and 1950, nearly half of the large public
states and the District of Columbia (hereafter referred employee pension plans existing today were established; 45
to as “states”). Using the IMPLAN model, we estimate the states had retirement systems in place by 1961.
employment, output, value added, and tax impacts of
pension benefit expenditures at the national and state In 2020, state and local pension plans in the United States
levels. collectively held total assets of $4.6 trillion. They served
33.7 million Americans, including 15.1 million active
The remainder of this introduction provides a brief participants, 7.1 million inactive members, and 11.5 million
background on DB pensions and an overview of the retirees and other beneficiaries receiving regular benefit
methodology. Section I outlines the major types of economic payments. Benefit payments in 2020 totaled $334.8 billion,
impacts measured in this study. Section II presents national for an average benefit payment of $2,428 per month, or
level findings. Section III outlines the state level impact $29,132 per year.
analysis, and Section IV presents the state level findings.MEASURING THE ECONOMIC IMPACT OF DB PENSION EXPENDITURES 3
Federal pension plans currently serve 2.8 million active that investment earnings can do much of the work of
civilian employees. In 2020, federal plans paid out some paying for benefits. In such a system, the contributions
$90.3 billion in pension benefits to 2.7 million retirees and made on behalf of current employees are invested, and
beneficiaries, for an average benefit of $2,760 per month, or these investment earnings compound over time. Over a
$33,125 per year. span of decades, accumulation of investment earnings can
be substantial, and in many cases pay the majority of the
Private sector pension plans covered 34.4 million pension benefits.
Americans, including 10.4 million retired Americans and
other beneficiaries in 2020. With total plan assets of $3.5 In state and local government pension plans, typically
trillion in 2020, private DB pensions paid out some $187.4 both the employee and employer make contributions to
billion in pension benefits to retirees and beneficiaries. the pension fund. Pension fund trustees have a fiduciary
The average private sector pension benefit was $1,504 per duty to ensure that the retirement fund is operating in the
month, or $18,050 per year. best interest of workers and retirees, and hire professional
managers to oversee fund investments. In this respect,
There are two major types of private sector pension plans: public plans differ from private sector DB plans, which
multiemployer plans and single employer plans. Single are generally funded solely by employers. In requiring that
employer plans generally cover a single workforce at a employees share the cost of their pension, public plans
single company. Multiemployer plans, also called “Taft- are similar to the approach adopted in 401(k) plans where
Hartley” plans, cover multiple employers, usually within private sector employees contribute to their accounts.
the same industry and/or geographic region. They are
jointly governed by management and the labor union(s) However, DB pensions are distinguishable from defined
representing the participating workers. contribution (DC) plans, such as 401(k) plans, in that they
provide broad-based coverage, secure money for retirement,
In 2020, single employer plans provided some $140.2 billion a lifetime income, and special protections for spouses.
in benefits to 6.4 million retirees, for an average benefit of Research shows that DB plans are more economically
roughly $21,813 per year, or $1,818 per month. Multiemployer efficient than DC plans. Pensions can deliver the same level
plans cover fewer workers, and tend to have less generous of retirement benefits at nearly half the cost of a DC plan.
benefits. In 2020, some 4.0 million beneficiaries received
benefits totaling $47.2 billion, for an average benefit of State and local pension fund receipts come from three
$11,934 per year, or $994 per month. (See Table 1.) sources: employer contributions, employee contributions,
and earnings on investments. Figure 1 shows that between
DB plans are prefunded systems, which means that a 1993 and 2020, 27 percent of public pension fund receipts
retirement fund receives regular contributions for each came from employer contributions, 12 percent from
employee during the course of that person’s career. This employee contributions, and 61 percent from investment
type of arrangement can be contrasted with “pay-as-you- earnings. Earnings on investments—not taxpayer
go” systems like Social Security, whereby contributions contributions—have historically made up the bulk of
of current employees are used to pay benefits for current pension fund receipts, even though this time period saw two
retirees. Prefunded retirement systems have the advantage very large market downturns, as well as huge market
Table 1: Public and Private Sector Pension Benefits, 2020
Private Sector
State and Local Federal Single Employer Multiemployer Total*
Plans Plans
Beneficiaries 11.5 million 2.7 million 6.4 million 4.0 million 24.6 millon
Average Benefit $29,132 $33,125 $21,813 $11,934 $24,898
Total Benefits $334.8 billion $90.3 billion $140.2 billion $47.2 billion $612.6 billion
Note: Author's analysis of the Annual Survey of Public Pensions, US OPM, U.S. Census Bureau, Pension Benefit Guaranty Corporation, and IRS Form 5500 data.
*Totals may not add up exactly due to rounding.
**Total average benefit represents a weighted average of public and private sector benefits.PENSIONOMICS 2023 4
Figure 1: Aggregate State and In addition, local economies benefit not only from pension
spending by residents, but from pension checks spent in
Local Pension Contributions by other localities. That is, the economic benefits generated by
Source, 1993-2020 pension spending in one region “leak” to and are captured
by other regions.
Employer
Contributions
Investment
This analysis is focused on the expenditure effects of pension
27.0% Earnings
benefits, measuring the economic impacts that result
61.4%
when expenditures made by retirees ripple throughout
the economy. Because pension benefits are permanent
sources of income—in that they cannot be outlived—we
would expect the economic impacts to be larger than
those of temporary income increases. For this reason, we
would expect the economic impacts of pension benefit
Employee expenditures to be larger than those out of, for example,
Contributions
unemployment insurance benefit payments. It should also
11.6% be noted that this study measures the gross economic
impacts of pension benefit expenditures, rather than the
Note: Author's analysis of data from the U.S. Census Bureau
net economic impacts. For a detailed explanation, see the
Technical Appendix.
fluctuations throughout 2020. It should be noted that
public pension reform in nearly every state since 2008 has Because taxpayers and elected officials have an interest in
relied heavily on increased employee contributions as a way gauging the ultimate economic impact of each tax dollar
to immediately reduce taxpayer costs. “invested” in a state or local pension plan, we calculate
a proxy measurement of the total economic impact
Just as contributions from employees and employers attributable to each dollar in pension contributions made
have an expanded impact through the compounding of by the taxpayer, called the “taxpayer investment factor.”
investment earnings over time, a similar dynamic occurs Details follow.
when retirees spend their pension checks. When a retiree
receives a pension benefit, s/he spends it on goods and Data and Methodology
services in the local community. These expenditures have a
“ripple effect” in the economy, as one person’s expenditures The data used for our analysis comes primarily from two
become another person’s income. sources: the U.S. Census Bureau and IMPLAN. We used data
for 2020, as it was the most recently available at the time of
Measuring the National Economic Impact of our analysis.
DB Pension Plans
Data on state and local pension plans comes from the
This study measures the economic impact of pension benefits Census Bureau’s Annual Survey of Public Pensions, which
paid by public and private pension plans nationally, as well is a representative sample of state and local DB pension
as the economic effects of state and local plans within each plans in the United States. This survey provides data on
state economy. This analysis recognizes that expenditures revenues, expenditures, financial assets, and membership
have a “multiplier” effect in a regional or national economy. for state and local pension plans on a national basis and
When money is spent at a local business to purchase, say, in each of the states. Federal pension data comes from the
groceries, that initial purchase generates even more income. Congressional Research Service. Data on private pension
First, some of the money spent circulates back to the benefits comes from the Census Bureau and Bureau of
businesses that manufactured, transported, and otherwise Labor Statistics’ Current Population Survey Annual Social
contributed to the production of those goods. Second, the and Economic Supplement (CPS ASEC), which reports
proprietors of these businesses and their employees will sources of household income, including pension and
spend more money at other businesses, spurring another survivor income, by age.
round of income generation. Thus, with each new round
of spending, additional revenue is generated, sustaining To measure the economic impacts of retiree expenditures
jobs, incomes, total output, and tax revenue to the local made out of benefits paid by DB pension plans, the input-
community.MEASURING THE ECONOMIC IMPACT OF DB PENSION EXPENDITURES 5
output modeling software, IMPLAN, was used. IMPLAN comparable to any of the prior Pensionomics studies,
was first developed in the 1970s as part of a USDA Forest and the reader should avoid drawing conclusions based
Service project to analyze the economic effects of local on such comparisons. For example, in its newest release,
land management projects such as timber, mining, and IMPLAN has eliminated the ability to model household
recreation activities. Since that time, IMPLAN has been expenditure patterns directly. Due to this change, we had to
used by industry and government analysts throughout the make several adjustments to the level of benefit payments
country to assess economic impacts of highly varied local that we input into the model, in order to more accurately
community development projects. These studies include account for the level of expenditures of retirees, rather than
many recent economic impact studies of pension benefit working households. That, along with fundamental changes
payments from state retirement systems. to the US economy that occur each year—especially a year
as anomalous as 2020— means the national and state- by
Between the time NIRS’ original Pensionomics study was -state level impacts are not directly comparable to those in
published in 2009 and the release of this report, IMPLAN the previous Pensionomics studies. Detailed information on
has undergone several significant modeling changes. Due to our data and methodology and further discussion of these
these changes, results of the current study are not directly differences appear in the Technical Appendix.PENSIONOMICS 2023 6
The Multiplier Effect: How Spending Ripples Through the Economy,
Supporting Jobs and Incomes in the Process
PENSION
BENEFIT
A retired firefighter...
...uses his pension money
DIRECT to buy a new lawnmower.
IMPACT
As a result of that purchase, the owner of the hardware
store, the lawnmower salesman, and each of the
INDIRECT companies involved in the production of the car
IMPACT
all see an increase in income, and spend that
additional income.
These companies hire additional
INDUCED employees as a result of this
increased business, and those new
IMPACT employees spend their paychecks
in the local economy.MEASURING THE ECONOMIC IMPACT OF DB PENSION EXPENDITURES 7
I. ECONOMIC IMPACT
MEASUREMENTS
We analyze the economic impact of expenditures made 4. Tax Impact: Economic activity of all kinds—receiving
by retirees out of their DB pension payments along four pension income, earning wages, producing profits, selling
dimensions: employment and labor income, output, value goods and services—provides the basis for the tax revenues
added, and tax revenues. Each of these is described in detail that are required to fund government services. To calculate
below. the impact that pension payments have on tax revenues,
we first estimate the amount of taxes paid by beneficiaries
1. Employment and Labor Income Impact: When directly on their pension benefits. Then, using IMPLAN, we
retirees spend their pension checks, their expenditures calculate estimates of taxes attributable to the economic
help to support jobs—at the local diner, hospital, or even activity that results when retirees spend their after-tax
at a factory somewhere across the country. When a retiree pension checks, and in all subsequent rounds of spending.
makes a purchase, the money spent translates into business This includes all corporate, property, and business taxes
revenues, jobs, and income. Using IMPLAN, we calculated that are generated through each spending round. The
the number of jobs supported by retirees’ expenditures. newest version of IMPLAN separates out state and local tax
The employment impact constitutes an estimate of “annual revenues by subcounty general, subcounty special districts,
average jobs” within a single year. We also present estimates county, and state tax receipts. We report all of these here
of labor income supported by pension expenditures, which (but we do not attempt to provide the same breakdown for
is a component of value added, as described below. the state and local tax withholdings from pension payments
themselves).
2. Output Impact: Total output includes the value of
all goods and services produced in the economy. Using
IMPLAN, we calculate the value of total output supported
by retirees’ expenditures of DB pension benefits.
We also calculate a pension expenditure multiplier and
taxpayer investment factor. The pension expenditure
multiplier tells us the total economic impact attributable
to each dollar in pension benefits paid to a retiree. (For
example, a multiplier of 2.13 means that every $1 paid to
retirees in a local economy supports $2.13 of total output
in that region.) We calculate the pension expenditure
multiplier by dividing the total output generated by the
value of the “initial event” in the economy (in this case, the
gross pension benefit). Expenditure multipliers usually lie
between 1.0 and 3.0.
3. Value Added Impact: Value added is a net estimate of
the creation of “new value” in the economy. Commonly
referred to as Gross Domestic Product (GDP), it includes the
value of employee compensation, profits, rents, and other
aspects of production, but excludes the costs of purchased
materials and services. IMPLAN calculates the value added
attributable to DB pension benefit expenditures.PENSIONOMICS 2023 8
II. RESULTS: NATIONAL ECONOMIC
IMPACT OF DB PENSION PLANS
Our analysis indicates that DB pension benefits not supported an additional half a million jobs. These jobs
only provide a secure source of income for many retired collectively paid out an estimated $422.2 billion in labor
Americans, they also contribute substantially to the income.
national economy. DB pensions play a vital role in
sustaining consumer demand that, in turn, ultimately To put these employment impacts in perspective, the 6.8
supports millions of jobs, and hundreds of billions of dollars million jobs supported by pensioners’ expenditures exceed
in income, output, value added, and tax revenues. the number of jobs in the entire construction industry (5.5
million jobs in 2020).
Employment and Income
In addition, in 2020 the national unemployment rate was
Our analysis shows that the $612.6 billion in gross public 8.1 percent. The entire civilian labor force in the country
and private pension benefits paid out in 2020 supported 6.8 consisted of 160.7 million potential workers, of whom 12.9
million American jobs, as shown in Table 2. Of these jobs, million were unemployed. The high unemployment rate
over 3.7 million were supported by state and local pension was largely due to the Covid-19 pandemic-related economic
benefit expenditures, and nearly 1 million by federal shutdowns that occurred. (For example, the unemployment
pension expenditures. In the private sector, single employer rate reached a high of 14.7 percent in April. By December,
plans supported 1.5 million jobs, and multiemployer plans it decreased to 6.7 percent, but this is still historically
Table 2: DB Pensions Support 6.8 Million American Jobs That Pay
$422.2 Billion in Labor Income
Employment Labor Income
State and Local Government 3,736,191 $232,229,721,639
Governmental Plans
Federal Government 994,015 $61,784,827,559
Multiemployer 519,379 $32,282,920,670
Private Sector Plans
Single Employer 1,542,916 $95,902,741,502
Total Impactt All Plans 6,792,502 $422,200,211,371
*Totals may not add up exactly due to rounding.
high.) In light of these numbers, the fact that DB pension expenditures, $296.8 billion from single employer pensions,
expenditures supported 6.8 million jobs is significant, as it and $99.9 billion from multiemployer plans. See Table 3.
represents a full 4.2 percentage points in the national labor
force. This $1.3 trillion dollars in overall economic output is
more than the total output contributed by the entire
Total Output transportation and warehousing industry, which generated
$1.1 trillion in total output in the national economy in 2020.
Our model further finds that the $612.6 billion in public
and private pension benefit payments in 2020 supported Value Added (GDP)
over $1.3 trillion dollars in overall economic output in the
national economy. In terms of benefit source, $718.6 billion Retirees’ expenditures of DB pension benefit payments
in economic activity stemmed from state and local pension supported $738.5 billion in value added to the national
benefit expenditures, $191.2 billion from fFederal pension economy in 2020, including $406.2 billion supported byMEASURING THE ECONOMIC IMPACT OF DB PENSION EXPENDITURES 9
Table 3: DB Pensions Support $1.3 Trillion in Economic Activity and
$738.5 Billion in Value Added
Output Value Added
State and Local Government $718,646,463,523 $406,224,100,829
Governmental Plans
Federal Government $191,196,232,383 $108,076,114,646
Multiemployer $99,901,109,159 $56,470,379,108
Private Sector Plans
Single Employer $296,775,819,806 $167,756,326,188
Total Impact All Plans $1,306,519,624,872 $738,526,920,772
*Totals may not add up exactly due to rounding.
state and local pension benefits, $108.1 billion by federal is significantly more than the $53.0 billion the federal
pension benefits, $167.8 billion by single employer pensions, government spent on all housing assistance in 2020. The
and $56.5 billion by multiemployer pensions. See Table 3. total state and local tax revenue more than what state and
local governments collectively spent on health services in
This $738.5 billion in value added is more than what was 2020 ($77.0 billion).
contributed by the entire arts, entertainment, recreation,
accommodation, and food services industry, which Economic Impacts by Industry and
generated $715.5 billion in value added in 2020. Occupation
Tax Revenue Table 6 breaks down the economic effects of public and
private pension expenditures by the top ten industry sectors
Our analysis finds that an estimated $157.7 billion in total affected. Nationally, the largest employment impacts were
tax revenue was attributable to public and private pension seen in the food service, health care, and retail trade sectors.
benefits in 2020, including $62.9 billion in federal tax In 2020, pension expenditures supported 326,024 jobs in
revenue and $94.9 billion in state and local tax revenue. (See the retail industry, 547,819 jobs in full- and limited-service
Tables 4 and 5.) restaurants, and 662,188 jobs in the health care industry
(including nursing and community care facilities, hospitals,
Tax revenue comes from two major sources: taxes paid by and offices of physicians).
beneficiaries directly on their pension benefits and taxes
resulting from expenditures made in the local economy With the newest version of IMPLAN, we are now able to break
( for example, sales taxes resulting from a retail purchase). down the employment impacts by occupation categories
Of the total tax revenue supported, $14.3 billion came from as well. Table 7 shows that Office and Administrative
income taxes paid by beneficiaries on their benefits and Support Occupations showed the largest gains, with
$143.4 billion from taxes resulting from the spending of net 678,678 total jobs, paying $42.2 billion in compensation,
pension benefits. at 1.2 billion total hours worked in 2020. The rest of the
top ten occupation categories include food preparation
To put these numbers in perspective, the total federal and serving, sales, transportation, health care, business,
tax revenue attributable to pension benefit payments management, production, and installation, maintenance,
Table 4: DB Pensions Support $62.9 Billion in Federal Tax Revenue
State and Private Pensions
Federal Total Federal
Local
Pensions Single Employer Multiemployer Tax Revenue*
Pensions
Taxes Paid by $903.3
$3.3 billion $472 million $1.4 billion $6.1 billion
Beneficiaries on Benefits million
Tax Revenue Resulting
$31.2 billion $8.3 billion $4.3 billion $12.9 billion $56.7 billion
from Retiree Expenditures
Total Federal Tax
$34.6 billion $9.2 billion $4.8 billion $14.3 billion $62.9 billion
Revenue Impact
*Totals may not add up exactly due to rounding.PENSIONOMICS 2023 10
Table 5: DB Pensions Support $94.9 Billion in State and Local Tax
Revenue
State and Private Pensions Total State
Federal
Local and Local Tax
Pensions Single Employer Multiemployer
Pensions Revenue*
Taxes Paid by
$4.5 billion $1.2 billion $1.9 billion $628.9 million $8.2 billion
Beneficiaries on Benefits
Tax Revenue Resulting
$47.7 billion $12.7 billion $19.7 billion $6.6 billion $86.7 billion
from Retiree Expenditures
Total State and Local Tax
$52.2 billion $13.9 billion $21.6 billion $7.3 billion $94.9 billion
Revenue Impact
*Totals may not add up exactly due to rounding.
Table 6: Top Ten Industries by National Employment Impact
Industry Total # Jobs Supported
Hospitals 336,296
Limited-service restaurants 320,266
Other real estate 238,861
Full-service restaurants 227,553
Offices of physicians 193,807
Retails - Food and beverage stores 165,032
Retail - General merchandise stores 160,991
Employment services 153,151
Nursing and community care facilities 132,085
Individual and family services 126,382MEASURING THE ECONOMIC IMPACT OF DB PENSION EXPENDITURES 11
Table 7: Top Ten Occupation Categories by National Employment
Impact
Supplements to
Occupation Wage and Salary Wage and Salary Total Employee
Wages and Hours Worked
Category Employment Income Compensation
Salaries
Office and
Administrative
678,678 $35,238,942,845 $7,010,670,754 $42,249,613,599 1,158,506,275
Support
Occupations
Food
Preparation and
626,523 $14,205,455,078 $2,550,533,595 $16,755,988,673 738,188,665
Serving Related
Occupations
Sales and
Related 612,650 $29,155,593,836 $5,354,263,446 $34,509,857,282 943,933,014
Occupations
Transportation
and Material
492,232 $22,175,442,828 $4,669,598,456 $26,845,041,284 855,539,059
Moving
Occupations
Healthcare
Practitioners
421,408 $40,420,111,463 $8,662,109,299 $49,082,220,762 747,310,507
and Technical
Occupations
Healthcare
Support 327,375 $9,693,466,862 $2,079,173,150 $11,772,640,011 509,228,548
Occupations
Business and
Financial
261,488 $30,052,360,683 $5,133,365,706 $35,185,726,389 514,113,939
Operations
Occupations
Management
250,142 $41,091,599,259 $7,511,958,336 $48,603,557,595 524,946,337
Occupations
Production
242,017 $12,385,851,949 $2,981,657,290 $15,367,509,239 461,282,934
Occupations
Installation,
Maintenance,
203,364 $13,397,643,870 $2,766,376,647 $16,164,020,517 401,358,776
and Repair
OccupationsPENSIONOMICS 2023 12
Figure 2: Economic Multipliers
The pension expenditure multiplier for 2020 in the U.S was 2.13, meaning every dollar paid out in
DB pension benefits in that year generated $2.13 of total output in the national economy.
Because DB pension plans are prefunded, only a small portion of the total pension payment in
any given year is funded through employer or taxpayer dollars, as discussed previously. Therefore,
for state and local plans, it may be helpful to calculate the total impact of state and local pension
benefit expenditures that is attributable to the “taxpayer investment” in these plans. Because only
27 cents of every dollar paid out in pension benefits in 2020 was generated through taxpayer
contributions (see Figure 1), the taxpayer investment factor is substantially higher than the
expenditure multiplier. In 2020, of the $334.8 billion paid out in state and local pension benefits,
only $90.4 billion was funded by taxpayer dollars. The total economic impact attributable to state
and local pension benefits was $718.6 billion. The taxpayer investment factor, then, was 7.89. That
is, every taxpayer dollar contributed to state and local pension plans supported $7.89 in national
economic output.
Pension Expenditure Multiplier
Each $1 in public and private
pension benefits paid to retirees
ultimately supported $2.13 in
total output througout the
country. This “multiplier”
$1.00 $2.13 incorporates the direct, indirect,
and induced impacts of retiree
total output
pension benefits paid to spending, as it ripples through
retirees with DB pension the U.S. economy.
income
Taxpayer Investment Factor * Each $1 in taxpayer contributions
to U.S. state and local pension
plans supported $7.89 in total
output in the country. This
reflects the fact that the
taxpayer contributions are a
$1.00 minor source of financing for
retirement benefits—the bulk of
contributed by taxpayers to
state and local pensions over $7.89 DB pension benefits come from
investment earnings and
30 years total output
employee contributions.
*Caution should be used in interpreting this number. See the Technical Appendix for details.MEASURING THE ECONOMIC IMPACT OF DB PENSION EXPENDITURES 13
III. MEASURING STATE-LEVEL
ECONOMIC IMPACTS OF STATE AND
LOCAL PENSION BENEFITS
Next, we consider the specific economic impacts of state Because most individual state economies are not as diverse
and local pension benefit expenditures within each state, as the U.S. economy as a whole, the state-level multipliers
accounting for cross-state economic impacts and migration. resulting from this analysis—focused on measuring
economic benefits at the state rather than national level—
Federal and private pension plans are not included in the will be smaller than the national multipliers. However,
analysis because of data limitations. whenever all of the services in any single transaction
are performed by firms and workers in the U.S., they are
The economic impacts and multipliers for individual states accounted for in the national economic impacts.
are collectively smaller than the national impacts and
multipliers, because state economies are smaller and less In addition, we also adjust for net flows of retirees and their
diverse than the national economy as a whole. pension payments across state borders, drawing on Census
data on migration patterns of older households. Retirees
The smaller and more homogeneous a local economy is, the who live and therefore spend their income outside of their
smaller the economic multipliers will tend to be for that state of origin contribute to economic activity in their new
economy. This is because economic impact analysis, based state of residence.
on local production and purchasing patterns, accounts
for economic benefits that leave the state. The economic Thus, each state’s total economic impacts consist of
benefit “lost” to other states or countries is called leakage. net in-state impacts (attributable to pension payment
expenditures originating in the state) and net out-of-state
However, because we are interested in assessing the impacts (attributable to pension expenditures originating
economic impacts of state and local pension benefits from any of the other states). For more information, see the
nationally, i.e., across all states, we employ an approach that Technical Appendix.
accounts for the fact that one state’s “loss” is often another
state’s “gain.” We account for a significant share of the
leakage caused by interstate commerce by utilizing a Multi-
Regional Input-Output (MRIO) analysis for each of the fifty
states and the District of Columbia.
For example, if a consumer in the state of Alabama
purchases a new lawnmower, that purchase is broken
down into its various components of production: the
engineers and designers, the parts manufacturers, and the
retail salesperson all receive a portion of the revenue from
that sale. Because the lawnmower was purchased within
Alabama, the portion of output due the retailer will certainly
be added to Alabama’s total output. If the lawnmower was
designed in Michigan and manufactured in Ohio, however,
output from these services would not be included in
Alabama’s total output, because they were not performed
within the state of Alabama, but in those of Michigan and
Ohio, respectively.PENSIONOMICS 2023 14
IV. RESULTS: STATE-LEVEL IMPACT
OF DB PENSION PLANS
While our model does not fully capture all of the state-level As is the case at the national level, the taxpayer investment
economic impact, the results show that every state gained factors for each state are much larger than the pension
substantial economic benefit from state and local DB expenditure multipliers.
pension payments.
Because state and local pension plans are prefunded, only a
The following series of charts and tables provide the key small portion of the total pension payment in any given year
state-level results of the economic impact analysis. Not is funded through taxpayer dollars. The total impact of state
surprisingly, the state of California—with the largest and local pension benefit expenditures that is attributable to
economy of the 50 states—showed the largest employment, the “taxpayer investment” in these plans is shown in Figure
output, and value added impacts: 381,038 jobs that paid 5. In 2020, the average taxpayer investment factor was 5.20,
$26.0 billion in labor income, $76.1 billion in output, and meaning that for every dollar contributed by taxpayers in a
$47.9 billion in value added supported by state and local single state, $5.20 in total economic output was supported
pension benefit expenditures. But even in smaller states, the within that state, on average.
impacts of state and local pension benefits are substantial.
Note that caution should be used in interpreting the
Figure 4 presents the pension expenditure multipliers for taxpayer investment factor for some states. See the
each state. Pension expenditure multipliers vary somewhat Technical Appendix for details.
by state, but generally speaking, larger states and those with
more diverse economic bases will have larger multipliers
than smaller states and those with a more homogeneous
economic base. These multipliers account for the impact of
pension expenditures originating both from within the state
and those pension dollars that originate from another state
but are spent within the state in question.
In 2020, the average state-level pension expenditure
multiplier was 1.33, meaning that for every dollar paid out
in pension benefits received by a state resident, $1.33 in
total output was supported within that state.MEASURING THE ECONOMIC IMPACT OF DB PENSION EXPENDITURES 15
Table 8: Employment and Labor Income Impacts by State
# Jobs Labor Income # Jobs Labor Income
Alabama 25,817 $1,184,700,257 Nebraska 9,337 $481,756,471
Alaska 10,724 $611,846,333 Nevada 24,364 $1,287,473,622
Arizona 45,433 $2,493,776,975 New 8,234 $514,382,863
Arkansas 13,698 $622,985,254 Hampshire
California 381,038 $26,014,637,864 New Jersey 83,926 $5,739,537,815
Colorado 45,267 $2,570,119,032 New Mexico 17,813 $811,133,991
Connecticut 35,144 $2,439,979,060 New York 181,576 $13,167,110,760
Delaware 7,891 $436,134,348 North Carolina 49,477 $2,537,566,321
DC 2,968 $247,186,014 North Dakota 3,725 $192,334,471
Florida 116,497 $5,930,264,284 Ohio 129,688 $6,965,313,984
Georgia 85,673 $4,333,461,901 Oklahoma 20,499 $959,882,138
Hawaii 11,604 $655,992,164 Oregon 44,263 $2,541,804,591
Idaho 14,302 $678,953,443 Pennsylvania 111,571 $6,816,269,356
Illinois 166,489 $10,376,966,458 Rhode Island 8,282 $469,950,943
Indiana 22,488 $1,209,718,922 South Carolina 26,363 $1,189,777,078
Iowa 18,935 $894,729,915 South Dakota 5,087 $268,409,670
Kansas 15,963 $827,234,785 Tennessee 32,080 $1,876,458,875
Kentucky 33,670 $1,684,811,017 Texas 165,433 $9,090,468,077
Louisiana 43,151 $1,987,465,089 Utah 16,896 $837,699,823
Maine 9,654 $498,912,112 Vermont 5,385 $282,749,561
Maryland 40,039 $2,373,105,393 Virginia 44,476 $2,384,138,660
Massachusetts 61,816 $4,422,240,379 Washington 34,487 $2,304,537,409
Michigan 76,945 $4,152,590,553 West Virginia 9,789 $478,375,591
Minnesota 43,755 $2,632,040,973 Wisconsin 50,368 $2,663,236,809
Mississippi 20,222 $811,456,791 Wyoming 4,481 $182,566,402
Missouri 46,978 $2,435,558,622
Montana 9,314 $446,180,933PENSIONOMICS 2023 16
Figure 3: Employment and Economic Output Impacts by State
Was
hin gton
34,4
87
6.9b
Montan
a North Dakota
9,314 Minnesota
3,725
Oreg 1.4b
on 598.5m 43,755
44,2 Idah 7.6b
63 o
7.4b
14,30 South Dakota Wisconsin
2
2.2b 50,368
Wyomin 5,087
g
827.8m 8.1b
4,481
682.1m Iowa
Neva
da Nebraska
18,935
24,36 2.9b
4 9,337
4.3b Utah Illinois
1.5b
Colorado
Califo 16,89 166,489
rnia 6
2.8b 45,267 30.3b
381,0 Kansas
38 7.9b
76.1b Missouri
15,963
2.6b 46,978
7.5b
Arizon Oklahoma
a
New Me Tenne
45,43 xico 20,499 Arkansas
3
7.6b 17,813 3.2b
13,698
2.8b
2.1b
Mississippi
20,222
Texas Louisiana 2.9b
165,433 43,151
27.8b 6.5bMEASURING THE ECONOMIC IMPACT OF DB PENSION EXPENDITURES 17
Maine 9,654 1.5b
New Hampshire 8,234 1.4b
Vermont 5,385 845m
New
York Massachusetts 61,816 11.7b
Michigan
6
181,57 Rhode Island 8,282 1.4b
35.8b
76,945 Connecticut 35,144 6.8b
12.4b
ylvania
Penns New Jersey 83,926 15.6b
Ohio 111,571
Indiana
18.9b Delaware 7,891 1.3b
22,488 129,688
21.7b West Maryland 40,039 7.1b
3.6b Virgin
ia
9,789 Virginia District of Columbia 2,968 631.4m
6
Kentucky 1 .5 b 44,47
33,670 7.8b
5.2b Carolin
a
North
7
49,47
32,080
essee 8.1b
5.3b
South
a
Carolin
3
26,36
Georgia 4b
Alabama
85,673
25,817
13.9b
3.9b
Florida
Alaska
116,497
25,817
19.1b
1.8b
Hawaii
11,604
2.1bPENSIONOMICS 2023 18
Table 9: Total Output and Value Added Impacts, by State
Output Value Added Output Value Added
Alabama $3.9 b $2.2 b New York $35.8 b $23.7 b
Alaska $1.8 b $1.1 b North Carolina $8.1 b $4.7 b
Arizona $7.6 b $4.5 b North Dakota $598.5 m $326.1 m
Arkansas $2.1 b $1.2 b Ohio $21.7 b $12.6 b
California $76.1 b $47.9 b Oklahoma $3.2 b $1.7 b
Colorado $7.9 b $4.6 b Oregon $7.4 b $4.3 b
Connecticut $6.8 b $4.4 b Pennsylvania $18.9 b $11.2 b
Delaware $1.3 b $822.7 m Rhode Island $1.4 b $857.1 m
DC $631.4 m $443.1 m South Carolina $4 b $2.3 b
Florida $19.1 b $10.8 b South Dakota $827.8 m $470 m
Georgia $13.9 b $8.2 b Tennessee $5.3 b $3.1 b
Hawaii $2.1 b $1.3 b Texas $27.8 b $15.9 b
Idaho $2.2 b $1.2 b Utah $2.8 b $1.6 b
Illinois $30.3 b $18.6 b Vermont $845 m $494.7 m
Indiana $3.6 b $2.1 b Virginia $7.8 b $4.7 b
Iowa $2.9 b $1.7 b Washington $6.9 b $4.3 b
Kansas $2.6 b $1.5 b West Virginia $1.5 b $822.8 m
Kentucky $5.2 b $2.9 b Wisconsin $8.1 b $4.7 b
Louisiana $6.5 b $3.7 b Wyoming $682.1 m $372.1 m
Maine $1.5 b $896.4 m
Maryland $7.1 b $4.4 b
Massachusetts $11.7 b $7.5 b
Michigan $12.4 b $7.1 b
Minnesota $7.6 b $4.5 b
Mississippi $2.9 b $1.6 b
Missouri $7.5 b $4.3 b
Montana $1.4 b $735.1 m
Nebraska $1.5 b $895.2 m
Nevada $4.3 b $2.6 b
New Hampshire $1.4 b $898.8 m
New Jersey $15.6 b $9.8 b
New Mexico $2.8 b $1.6 bMEASURING THE ECONOMIC IMPACT OF DB PENSION EXPENDITURES 19 Figure 4: Pension Expenditure Multipliers by State
PENSIONOMICS 2023                                20

Figure 5: Taxpayer Investment Factors by State
MEASURING THE ECONOMIC IMPACT OF DB PENSION EXPENDITURES                                                  21

Table 10: Tax Impacts by State (in millions)
                Federal    State/Local    Total                       Federal    State/Local    Total

Alabama          $158.7      $304.3      $463.0      Montana           $77.8       $108.3       $186.1

Alaska           $113.7       $60.7       $174.4     Nebraska          $56.9       $158.6       $215.4

Arizona          $355.4      $644.0      $999.4      Nevada            $175.7      $406.5      $582.2

Arkansas         $83.5       $220.9      $304.4      New Hampshire     $72.7       $110.2       $182.9

California      $3,746.8    $8,132.8     $11,879.5   New Jersey       $781.2      $1,526.0     $2,307.1

Colorado         $378.6      $624.0      $1,002.6    New Mexico        $99.7       $292.0       $391.8

Connecticut      $337.7      $834.3      $1,172.0    New York         $1,808.6    $3,489.5     $5,298.1

Delaware         $72.3       $86.8        $159.1     North Carolina   $422.9       $759.9      $1,182.7

DC               $19.8        $83.5       $103.3     North Dakota      $26.3        $37.5       $63.8

Florida          $907.8     $1,334.9     $2,242.7    Ohio             $957.7      $1,809.0     $2,766.7

Georgia          $658.2      $887.9      $1,546.1    Oklahoma          $135.5      $252.1      $387.6

Hawaii           $60.3       $216.7       $277.0     Oregon           $453.7       $786.9      $1,240.6

Idaho            $95.1       $241.4       $336.5     Pennsylvania     $996.4       $1331.9     $2,328.4

Illinois        $1,300.4    $2,740.2     $4,040.6    Rhode Island      $61.0       $145.4      $206.4

Indiana          $169.4      $334.0       $503.4     South Carolina   $180.6       $345.7      $526.3

Iowa             $92.7       $289.7       $382.4     South Dakota      $24.7        $63.7       $88.4

Kansas           $89.4       $226.7       $316.1     Tennessee        $264.6       $328.8      $593.4

Kentucky         $260.8      $364.2       $625.0     Texas            $1,254.7    $1,805.5     $3,060.2

Louisiana        $249.4      $463.0       $712.4     Utah             $120.8       $261.8      $382.6

Maine            $61.7       $167.4       $229.2     Vermont           $33.2        $98.5       $131.6

Maryland         $310.5      $650.2       $960.7     Virginia         $332.8       $771.5      $1,104.3

Massachusetts    $729.6      $772.1      $1,501.7    Washington        $291.3      $679.5      $970.9

Michigan         $599.4      $859.0      $1,458.4    West Virginia     $73.1       $147.6      $220.7

Minnesota       $340.4       $756.7      $1,097.1    Wisconsin        $365.8       $846.9      $1,212.7

Mississippi      $94.3       $265.2       $359.5     Wyoming           $30.6        $51.0       $81.5

Missouri         $354.8      $475.7      $830.4
PENSIONOMICS 2023 22
CONCLUSION
DB pension plans provide a critical source of reliable 6.8 million American jobs that paid $422.2 billion in income
income for 24.6 million Americans. These plans are a cost in that year. Benefits paid by DB pensions supported $157.7
effective way to provide secure lifetime income for retired billion in tax revenue at the local, state, and federal levels.
Americans and their beneficiaries after a lifetime of work.
Moreover, DB pension plans generate economic benefits In supplying a stable source of income to retirees, DB
that reach well beyond those who earned benefits during pension plans support the national economy, as well as local
their working years. economies throughout the country, with jobs, incomes, and
tax revenue. Pension benefits play an important role in
Because pensions supply secure income to retirees, pensions providing a stable, reliable source of income regardless of
provide local economies with stable sources of revenue. economic climate—not just for retired Americans, but also
Retirees who spend their paychecks regularly in their local for the local economies in which their retirement checks are
economies—especially during tough economic times, as spent.
was experienced worldwide in 2020—provide vital revenues
to local businesses and income to local workers.
These economic gains are considerable. Nationwide, over
$1.3 trillion in total economic output resulted from DB
pension expenditures in 2020. DB expenditures supportedMEASURING THE ECONOMIC IMPACT OF DB PENSION EXPENDITURES 23
TECHNICAL APPENDIX
State and local pension benefit payments were taken from Disposable Income and Taxation
the U.S. Census Bureau’s Annual Survey of Public Pensions,
which reports on state and local government-sponsored Before calculating the economic impacts of pension benefit
pension plans in the United States. The survey provides data expenditures, we must account for income taxes that are
on revenues, expenditures, financial assets, and membership paid out of pension benefit payments, as retirees are not
in public employee retirement systems. The Census Bureau spending these tax withholdings in their local economy.
aggregates plan level data up to the state-level, and these
state-level estimates are based on a representative sample To calculate disposable income among retirees, we first
of retirement systems throughout the country, weighted for subtract income taxes from gross pension payments. To
accuracy. We use data for fiscal year 2020, as that was the estimate federal income taxes due from state and local
most recent data available. pension income, we use data from the Congressional
Budget Office on effective federal income tax rates for
Federal pension data used in this study comes from the U.S. elderly households in the United States by income quintiles.
Congressional Research Service. Data on private pension Effective tax rates are different from marginal tax rates in
benefits comes from the U.S. Census Bureau and U.S. Bureau that effective tax rates account for tax deductions, credits,
of Labor Statistics’ Current Population Survey Annual or other alterations that may change the total amount of
Social and Economic Supplement (CPS ASEC), which the tax that individuals actually pay. This is useful to our
reports sources of household income, including pension purposes, because, since we are using aggregated sample
and survivor income. To separate out multiemployer plan data, we cannot assess actual individuals’ federal tax
and single employer plan benefits, we aggregate data on liabilities. The effective tax rate allows us to more accurately
benefit payments from multiemployer plans from the Form estimate the taxes that pension beneficiaries actually pay to
5500 data filings, and then subtract this from the total the federal government.
private plan data from the CPS to report the single employer
payments. To calculate state and local tax rates, use the average nominal
taxes paid by elder households from the National Bureau of
Migration Economic Research, based on their TaxSIM model. We also
use information from AARP and Kiplinger to account for any
Upon retirement, not all workers continue to reside in their public pension exclusions a state may provide. State income
home states. When a pension beneficiary moves out of state, tax exclusions are important to consider, because many
the individual takes the pension payments, spending those states offer full or partial income tax exclusions for pension
pension checks in the new state of residence, rather than in benefits. About half the states either do not subject pension
the state where the pension payment originated. Since our income to income tax, or offer sizeable tax breaks for such
state-level analysis relies on information on where pension income. Because average marginal tax rates are higher than
benefits are spent, we need to account for the movement average effective tax rates, for the remaining states with
of retirees from one state to another. To estimate the net small exclusions or no advantageous tax treatment, our
effects of retiree movement across state borders, we use calculations likely overestimate state income tax receipts, at
data from the 2020 American Community Survey, which the same time that they underestimate net pension income
tabulates current state of residence and current residence and resulting economic benefit.
one year before, by age. From this, we are able to calculate
the recent net migration patterns of people aged 65 and Estimating taxes paid by pensioners requires assuming that
older. We assume that migration patterns for state and beneficiaries are taxed by the state of residence, not the
local government retirees mirror those of all other older state of the pension’s origin. This assumption is consistent
Americans. with the treatment under federal law that was changed
so that after 1995 states’ rights to tax retirement incomePENSIONOMICS 2023 24
generated from work in the state by individuals who are no has increased since the last study, while multipliers at the
longer residents was eliminated for DB and other qualified state level are varied.
retirement plans. For example, a retiree moving from New
York to Arizona would pay Arizona income taxes on her In past iterations of Pensionomics, we were able to utilize
pension benefit, not New York taxes. IMPLAN’s institutional spending pattern feature, which
estimated household spending patterns by income class.
IMPLAN Modeling From there, we would simply assume that every dollar
entered into the model is spent. However, in the newest
This study uses IMPLAN, an input-output modeling version of IMPLAN, the household spending pattern
software and data package, to estimate the economic feature is no longer available. We must input pension
impacts of benefits paid by DB pension plans. IMPLAN money as a “household income” impact, which takes into
was first developed in the 1970s as a part of a USDA Forest account different household income brackets, but not the
Service project to analyze the economic effects of local differences between working-age households and retirees.
land management projects such as timber, mining, and For the purposes of Pensionomics, we assume that retiree
recreation activities. Since that time, IMPLAN has been households have different expenditure patterns in two ways:
used by industry and government analysts throughout the first, that they do not put aside any of this money for future
country to assess economic impacts of highly varied local savings, and second, that their effective tax rates are likely
community development projects; these studies include to be lower than working-age households, and therefore
many recent economic impact studies of pension benefit they will see less tax withholding.
payments. Because of differences in modeling and the data
used, the results of our study may not be comparable with We first calculate what we believe to be the more accurate
these other analyses. Thus, the reader should avoid drawing level of disposable income for state and local retirees
conclusions based on comparisons between our results and as described above. We then must remove IMPLAN’s
those of other studies. embedded assumptions about disposable income by
finding the tax and savings rates within each state’s Social
IMPLAN is an input-output model that uses a matrix to Accounting Matrix. We divide the sum of these figures by
represent the economy of a region in order to estimate the the totals for each social account, and thereby obtain the
effect of events occurring in a single industry or institution percentage of taxation and savings that is assumed. We add
on all other industries, as well as consumers, government, this percentage of money back into the benefit payments for
and foreign suppliers to the economy. IMPLAN uses a Social each state before inputting it into the IMPLAN model.
Accounting Matrix (SAM), which captures all the industry
and institution transactions in the local area; subsections National and state- by- state IMPLAN data for 2020 were
of a SAM describe various structures and functions of a used, as this corresponded with the Census data on public
local economy. The SAM describes a local economy in pension payments, for which 2020 was the most recently
terms of the flow of dollars from purchasers to producers available. For this study, each state’s aggregated, in-state,
within a region, while also accounting for non-industrial disposable pension payments are entered into IMPLAN
transactions such as payment of taxes by businesses and as direct payments to households. IMPLAN estimates
households. This offers a better portrayal of the household household spending patterns by income class. The
income effect portion of local economic events than other household income range used is based on the 2020 median
models. household income among pension-receiving households
age 65 and older, taken from the Current Population Survey
Between when NIRS’ original Pensionomics study was ASEC.
published in 2009 and the release of subsequent updates
to the report, IMPLAN has gone through many modeling Benefits that migrate out of state are assumed to be spent
and assumption changes. Due to these changes, along with in the receiving state. Therefore, each state’s economic
fundamental changes to the US economy that occur each impact includes out of state benefit payments in addition
year, results of the current study are not directly comparable to benefits originating from pension systems in the state.
to those of any of the prior Pensionomics studies, and the Pension benefits, net of migration, are calculated based on
reader should avoid drawing conclusions based on such the migration assumptions described above. Then estimated
comparisons. For example, the reported national multiplier income taxes are subtracted to yield net after-tax pensionYou can also read