Pattern-Induced Visual Discomfort and Anxiety in Migraineurs: Their Relationship and the Effect of Colour
←
→
Page content transcription
If your browser does not render page correctly, please read the page content below

vision
Article
Pattern-Induced Visual Discomfort and Anxiety in Migraineurs:
Their Relationship and the Effect of Colour
Trevor J. Hine * and Yolande B. Z. White
                                          School of Applied Psychology, Griffith University Mt Gravatt Queensland Australia,
                                          Mount Gravatt, QLD 4122, Australia; yolande.white@alumni.griffithuni.edu.au
                                          * Correspondence: t.hine@griffith.edu.au; Tel.: +61-7-37353357

                                          Abstract: In migraineurs, coloured lenses were found to reduce the visual stress caused by an aversive
                                          pattern known to trigger migraines by 70%, but do such patterns also produce a low-level anxiety/fear
                                          response? Is this response lessened by colour? We sought to investigate this in a study comprising a
                                          broad screening component followed by a dot-probe experiment to elicit attentional biases (AB) to
                                          aversive patterns. Undergraduate psychology students completed headache and visual discomfort
                                          (VD) questionnaires (N = 358), thereby forming a subject pool from which 13 migraineurs with high
                                          visual discomfort and 13 no-headache controls with low visual discomfort, matched on age and sex,
                                          completed a dot-probe experiment. Paired stimuli were presented for 500 ms: aversive achromatic
                                          3 cpd square wave gratings vs control, scrambled patterns. These conditions were repeated using the
                                          colour that was most comfortable for each participant. VD was greater in the more severe headache
                                          groups. On all measures, the migraineurs were more anxious than the controls, and a positive
                                          relationship was found between VD and trait anxiety. The 3 cpd gratings elicited an aversive AB in
                                          the migraine group which was somewhat reduced by the use of colour, and this was not seen in the
                                          controls. The results suggest a new role for colour in reducing visual stress via anxiety/fear reduction.

                                          Keywords: migraine; visual discomfort; hypervigilance; avoidance; dot-probe tasks; anxiety; colour


                                          1. Introduction
Citation: Hine, T.J.; White, Y.B.Z.
                                          1.1. Overview
Pattern-Induced Visual Discomfort
and Anxiety in Migraineurs: Their                Repetitive, high-contrast, achromatic square wave patterns, repeating at around three
Relationship and the Effect of Colour.     cycles per degree (cpd), are known to trigger visual discomfort that can lead to migraines
Vision 2022, 6, 1. https://doi.org/        in susceptible people [1]. It is claimed, and has been shown to some extent, that ‘colour
10.3390/vision6010001                      therapy’ reduces visual discomfort and decreases the chance of experiencing a visually
Received: 4 July 2021
                                           triggered migraine [2,3]. For instance, colour-tinted glasses have been found to provide
Accepted: 21 December 2021
                                           therapeutic benefits for both children [3] and adults [4] with visually induced migraines.
Published: 24 December 2021
                                           However, migraines are also associated with anxiety disorders, especially with respect to
                                          perceived triggers of migraines where there is a substantial fear component [5,6], while for
Publisher’s Note: MDPI stays neutral
                                           those with visually triggered migraines, anxiety and neuroticism are associated with visual
with regard to jurisdictional claims in
                                          ‘stress’ or visual discomfort [7]. We tested whether the use of square wave patterns to induce
published maps and institutional affil-
                                          visual discomfort also invokes a pre-conscious aversive response. Additionally, some
iations.
                                           colours have anxiety-reducing properties and exhibit a calming effect on emotions [8], and
                                          we therefore hypothesized that colour may reduce the anxiety and concomitant aversive
                                           response. This would suggest a new role for colour therapy for migraines different from
Copyright: © 2021 by the authors.
                                           that suggested by Wilkins and colleagues [9]. The first aim of the research was to see if
Licensee MDPI, Basel, Switzerland.        visual discomfort was associated with classic migraines (a migraine with aura), especially
This article is an open access article     in terms of the frequency of the migraines. The second aim was to measure if there was an
distributed under the terms and            attentional bias (operationalized as dot-probe task reaction times) in migraineurs versus
conditions of the Creative Commons         controls towards a high-contrast, achromatic, square wave pattern, repeating at 3 cpd,
Attribution (CC BY) license (https://      and whether a colour overlay would reduce this proposed response. The dot-probe task
creativecommons.org/licenses/by/           is commonly used to determine the existence of a pre-conscious emotional salience of a
4.0/).                                    particular visual stimulus [10].

Vision 2022, 6, 1. https://doi.org/10.3390/vision6010001                                                       https://www.mdpi.com/journal/vision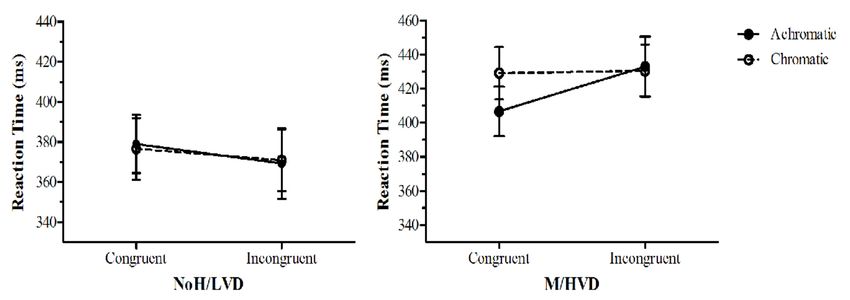
Vision 2022, 6, 1                                                                                            2 of 16

                    1.2. Migraines, Anxiety and Fear
                         Migraines are a headache disorder characterized by intermittent disabling attacks, with
                    various physiological and emotional stressors associated with each episode. With classic
                    migraines, the headache is preceded by 5–60 min of visual aura, e.g., visually perceived
                    light flashes, zig-zag patterns, and geometric colours. The migraine may be aggravated
                    over weeks or months due to psychological stress or environmental factors [11–13]. The
                    headaches can be triggered by various stressors, e.g., anxiety, food, bright lights, or certain
                    visual patterns [14].
                         Autonomic nervous system (ANS) dysfunction is a feature in migraines. When in-
                    dividuals face actual or potential stressors, hormonal and neural mediators are activated
                    via the ANS that help to maintain physiological stability (allostasis). These activated re-
                    sponses can become dysregulated when stressors occur often and/or are severe. Load may
                    be accrued through visual exposure to repetitive light–dark borders, which can induce
                    migraines and pattern-sensitive seizures [7,13,15,16]. Migraineurs score highly on stress
                    susceptibility, with high neuroticism being a known correlate of migraines which can lead
                    to panic disorders [6,17]. This is magnified by the pain of a migraine and may become a
                    conditioned emotional fear response to a trigger [18], which can include repetitive high-
                    contrast patterns. The consequence is a pre-conscious judgment of fear-relevant stimuli
                    which originates in the limbic structures [19,20] where the stimulus features that would
                    activate a fear system are aversive, or a pre-existing state of fear or anxiety would need
                    to be present in the patient [21]. In fact, Nulty, Wilkins and Williams [22] investigated the
                    headache component as a possible exacerbating factor of pattern sensitivity in 15 patients
                    aged 30–60 years with high levels of anxiety and depression. These researchers found
                    pattern-sensitivity in significant numbers of people suffering from headaches as a feature
                    of their chronic anxiety and a relationship between their susceptibility to the patterns and
                    their anxiety.

                    1.3. Colour, Pattern Senstivity and Mood
                          Precision tinted lenses can minimize the impact of visual triggers in migraines [23,24].
                    A range of colours provide therapeutic effects for migraineurs (who experience migraines
                    with and without aura) [25]. Using square wave patterns (at 3 and 12 cpd), Shepherd, Hine
                    and Beaumont [25] investigated early visual pathways (achromatic (black/white), tritan
                    (black/purple, black/yellow), protan/deutan (black/red, black/green)) and found colour
                    and spatial frequency to be related to visual pattern sensitivity in migraineurs. Illusions
                    and distortions were reduced when black/colour patterns were presented as opposed to
                    black/white. It is unclear why colour has reduced the symptoms of visual stress, and it
                    was proposed that ‘glare’ plays a major role [5,26,27]. Historically, Wilkins suggested that
                    pattern glare causes a ‘localized hyper-excitability’ of the visual cortex due to a hypersensi-
                    tivity to contrast, with perceptual distortions occurring through the same mechanisms [15].
                    Wilkins [15] proposed that colour suppresses this hyper-excitability, preventing the spread
                    of the excitation responsible for the distortions. Using fMRI, Huang et al. [2] have shown
                    that coloured ‘precision ophthalmic tints’ for reducing visual discomfort also reduced corti-
                    cal activation in area V1 by 5%, and significantly reduced cortical activation in the V2 to V4
                    areas of the extra-striate cortex by 19% when compared with matched achromatic grey.
                          However, apart from colour’s effect at reducing pattern sensitivity, colour also affects
                    mood, particularly anxiety. Jacobs and Suess [28] investigated the emotional effect of the
                    colours red, yellow, green and blue by projecting colours onto a screen, with State-Trait Anx-
                    iety Inventory scores as the dependent variable. The highest state anxiety scores resulted
                    from red and yellow. Using physiological measures (e.g., skin conductance response),
                    long-wavelength colours (e.g., red) have been demonstrated to be more arousing than
                    short-wavelength colours (e.g., blue [29]). Valdez and Mehrabian [30] concluded that a
                    blue-purple-rose hue gamut was the least aversive and most calming compared to the
                    green-yellow gamut. In fact, in correctional facilities, aggression- and anxiety-reducing
                    effects have been found when inmates were placed in cells/rooms painted in Baker–Miller
Vision 2022, 6, 1                                                                                            3 of 16

                    pink—a bright, low-saturation, red-purple colour [8,31]. What is unknown is whether the
                    positive effect of the colour on pattern sensitivity in migraineurs is, to some extent, emo-
                    tional as well as visual. One of the steps in answering this question is to determine whether
                    this affect response is ‘pre-conscious’, and hence not amenable to cognitive moderation.
                    Measuring attentional biases to aversive stimuli using the dot-probe task is a commonly
                    used method in clinical psychology that can help provide an answer to the question [32].

                    1.4. Unconscious Assessment of Pattern Anxiety—The Dot-Probe Task
                          The dot-probe paradigm reveals how task performance (i.e., detection of the probe)
                    is facilitated or inhibited due to the immediate prior presentation of a stimulus that is
                    related to the concerns (anxiety, fear) of the individual. The reaction time to correctly detect
                    the location of the probe presented in the same location as, but directly after, a priming
                    stimulus see below for detailsis used to measure attentional bias (AB). ‘Hypervigilance’
                    includes an AB towards threat, increased distractibility, elevated environmental scanning,
                    a wide attentional window prior to threat detection, and a narrow window after threat de-
                    tection [33,34] leading to a faster reaction time (RT) as opposed to non-threatening stimuli.
                    Research has provided evidence that individuals that score high on trait anxiety have a
                    selective bias towards threatening stimuli, and that a high state anxiety score appears to
                    magnify this bias [33,35]. However, the results of dot-probe experiments depend critically
                    on the duration of exposure to the priming stimulus presented before the probe. Bar-Haim
                    et al. [36] found that timing plays a moderating role in the differences between anxious and
                    control participants for subliminal and 500 ms exposures, with significance not reached
                    for longer exposures. Furthermore, Mogg and Bradley [37] found that in arachnophobes,
                    the hypervigilance found towards pictures of spiders presented for 200 ms significantly
                    decreased with longer exposures (500 ms, 2000 ms). This supports a ‘hypervigilance avoid-
                    ance’ theory of the dot-probe experiment, whereby the three subcomponents comprising
                    AB are: 1) facilitated attention towards threat (reflecting faster detection of threat-related,
                    compared with neutral stimuli); 2) difficulty disengaging from threat (reflecting slow re-
                    sponses due to slow disengagement from a threat stimulus relative to a neutral stimulus);
                    and 3) attentional avoidance of threat (where attention is allocated towards the location op-
                    posite to the threat stimulus location [38,39]). The last subcomponent—avoidance—results
                    in slower RT compared to non-threatening stimuli.

                    1.5. Current Study
                          There are a number of steps required to achieve the four main aims of the current
                    study. First, to establish whether visual discomfort [40,41] was greatest in migraineurs
                    with aura compared to other headache or no-headache groups and whether the severity
                    of the migraine is related to visual discomfort. Second, to test the link between higher
                    anxiety levels (state and trait [42]) as well as ‘in-the-moment’ distress [43] and visual
                    discomfort in an experimental setting. This was achieved by comparing results from two
                    age- and sex-matched groups, including a migraine group with high visual discomfort and
                    a no-headache group with low visual discomfort.
                          The third aim was to measure the unconscious anxiety effects from being exposed
                    to repetitive pattern stimuli using the dot-probe task. The critical measure here is AB
                    towards aversive striped patterns, which, depending on the presentation duration and type
                    of stimulus, can be hypervigilant (faster RTs) or attentionally avoidant (slower RTs). Finally,
                    the last aim was to determine if the effect of therapeutic colour on this AB would be different
                    for the two groups, i.e., migraineurs vs. no headache controls. To achieve this, we would
                    first determine the most and least uncomfortable of four achromatic spatial frequencies
                    flashed under the same conditions as used in the dot-probe task—viewed for 500 ms, in the
                    same screen locations, and under the same lighting conditions. Furthermore, we would
                    determine the most and least uncomfortable colour (colours matched to Wilkin’s Intuitive
                    Overlays; I.O.O. Marketing) under the same conditions as the spatial frequency task.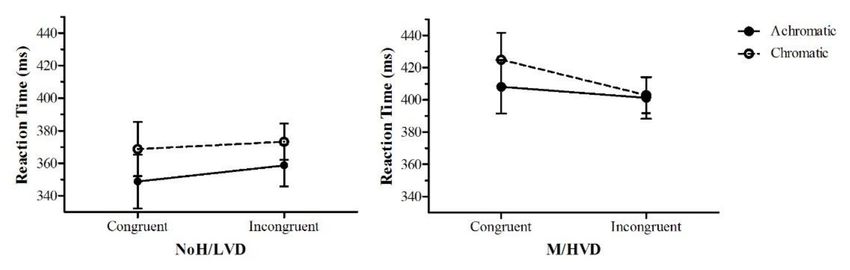
Vision 2022, 6, 1                                                                                               4 of 16

                    2. Materials and Methods
                         The research was approved by the Griffith University Human Research Ethics Com-
                    mittee: GU Ref No: PSY/H9/07/HRC ‘The Effect of Colour and Visual Noise on Dyslexics
                    and Migraineurs’.

                    2.1. Participants and Screening
                         Participants (n = 356) enrolled in Griffith University’s undergraduate psychology
                    program completed two questionnaires eliciting migraine, headache and visual discomfort
                    data. The questionnaires were the Visual Discomfort Survey (VDS [40]) and a self-report
                    check list for migraines (with and without aura) taken from Section 1 of the International
                    Headache Classification Inventory (IHS [12]). This participant pool consisted of 86 males,
                    258 females and 12 of no specified gender. Their mean age was 20.87 years and SD 6.05 years.
                    The IHS was used to separate participants into four groups, which are detailed in Table 1,
                    and together with the VDS was used to create two groups for the experimental phase of the
                    research: migraine (U or D) with high visual discomfort (M/HVD) versus no/low headache
                    and low visual discomfort (NoH/LVD). A VDS score of 29 or above was classified as ‘high’,
                    while a score of 16 and below was classified as ‘low’. Based on these screening criteria, sixty-
                    eight people were invited via email to participate in the experimental phase of the study.
                    Thirty-eight agreed to participate, and they were offered one credit participation point and
                    AUD 10, or AUD 15 for travel expenses and their time if they were not first-year students.

                    Table 1. Four Groups based on Self-report Migraine and Headache Data.

                                Group                                      Selection Basis
                             No Headache                   Participants claiming to not experience headaches.
                              Headache             Participants claiming to experience headaches but not migraines.
                                                  Participants claiming to experience migraines (self-diagnosed) and
                     Migraine Undiagnosed (U)
                                                  meeting classic migraine criteria (with aura) according to the IHS.
                                                  Participants claiming to have been diagnosed with migraines (with
                         Migraine Diagnosed (D)
                                                        aura) by a General Medical Practitioner or Neurologist.

                         Further screening was conducted in the laboratory prior to the experiment. Those
                    who were experiencing, or who had recently experienced (in the last two days) a migraine
                    were excluded. Those who were drowsy due to inadequate sleep or medication were
                    also excluded. Normal or corrected-to-normal vision was required. A test for adequate
                    stereoacuity using the Titmus Fly Stereo-test (Stereo Optical, Chicago, Illinois, [44]) was
                    performed. Finally, normal colour vision was tested using the online Ishihara 38 Plates
                    Colour Vision Deficiency Test (www.color-blindness.com, accessed on 22 May 2015). Those
                    participants with a red-green colour deficiency were also excluded. Each group then com-
                    prised 13 participants who were matched for age and sex (M/HVD: male = 1, female = 12,
                    age range: 17–42, M = 22.46, SD = 6.51; NoH/LVD: male = 3, female = 10, age range: 17–35,
                    M = 22.23, SD = 6.27).

                    2.2. Material and Methods
                    2.2.1. Materials
                    1.     The VDS comprises 23 items for measuring visual discomfort. The items include
                           questions on perceptual, somatic and performance problems when exposed to dif-
                           ferent light sources or when reading, as well as severe headache frequency, effective
                           reading times and experiences of visual difficulties whilst reading. Respondents rated
                           answers on a four-point Likert scale (0 = event never occurs, 3 = event occurs almost
                           always). The scores are added. The VDS has good reliability and validity, with a
                           reliable internal consistency estimate of 0.91 [40].
                    2.     The IHS uses self-report diagnostic criteria to obtain data on migraine and headache
                           type, frequency, duration and symptoms, presence of aura and visual discomfort
                           symptoms, along with dyslexia and epilepsy questions.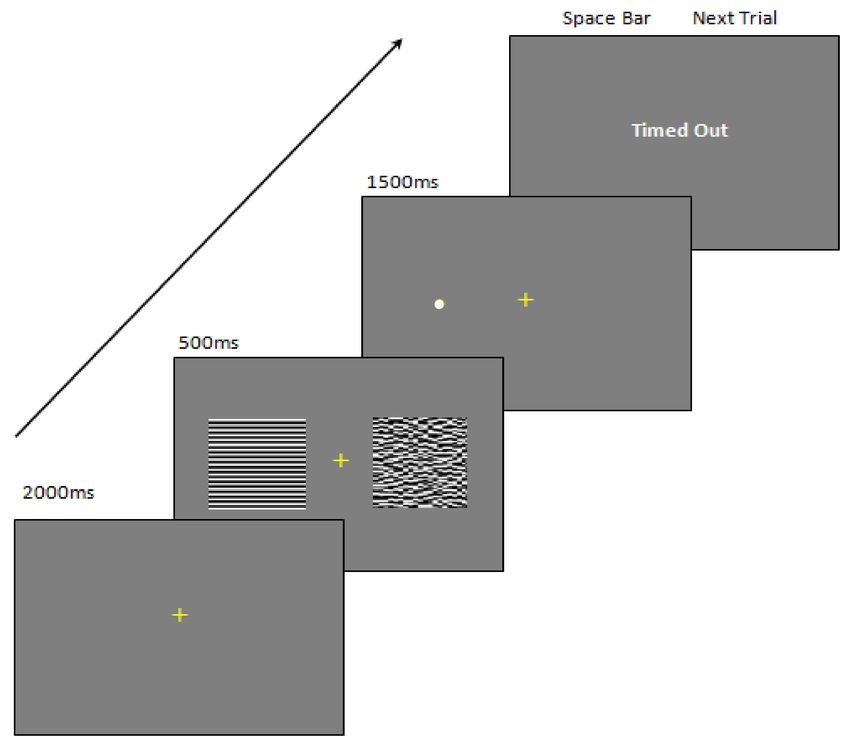
Vision 2022, 6, 1                                                                                            5 of 16

                    3.    State-Trait Anxiety Inventory—Form Y (STAI [42]). Form Y includes 20 items assess-
                          ing state and 20 items assessing trait anxiety. Items are rated on a four-point Likert
                          scale (1 = almost never to 4 = almost always) with some items reverse scored. For
                          trait anxiety, participants were required to respond to how they feel generally, and for
                          state anxiety, how they feel right now. The STAI has high internal consistency and
                          reliability (Cronbach’s α between 0.85 and 0.95 [42]) and convergent validity, with
                          high correlations greater than 0.82 at p < 0.001 with the Anxiety Sensitivity Index [45].
                    4.    Subjective Units of Discomfort Scale (SUDS [43]). This scale was used to measure
                          moment-to-moment participant anxiety on a self-rating scale from 0 to 10 (0 = not
                          anxious at all, to 10 = extremely anxious), where participants imagine having a
                         ‘distress thermometer’ measuring their anxiety. The SUDS has been validated as global
                          measures of physical and emotional discomfort (Tanner, 2012). The SUDS concurrent
                         validity has been supported with empirical data finding moderate correlations of 0.69
                          of the SUDS with the STAI [46]. SUDS ratings were conducted at four times during
                          the experiment.

                    2.2.2. Experimental Apparatus
                         All stimuli used within the experiment were displayed on a gamma-corrected DELL
                    ST2410B 21” colour monitor, with a 1024 × 768 pixel resolution. The program for the
                    experiment was run using Presentation® software (Neurobehavioral Systems, Inc, Berkeley,
                    CA, USA), with a full-screen refresh rate of 90 Hz. The luminance of the gratings was
                    measured and matched using a Minolta CS-100A Luminance and Colour meter with a
                    1◦ probe. The background ambient room lighting around the monitor was 1.2 cd/m2 .
                    On the monitor, the background grey was 19.2 cd/m2 . For the achromatic stimulus, the
                    white bars/region were 69.4 cd/m2 , and the black bars/region were 0.35 cd/m2 , yielding a
                    Michelson contrast of 99%. All stimuli were presented at a fixed viewing distance of 70 cm.

                    2.2.3. Experimental Procedure
                         Following the experimental screening described above, the STAI questionnaires were
                    completed to determine trait and state anxiety. A SUDS rating was completed prior to the
                    experimental phases to establish the baseline measures of current anxiety towards patterns
                    and was repeated at other times during the experiment.
                         The experiment itself was conducted in three further phases. Practice trials were
                    presented at the beginning of each phase to accustom participants to each task. The first
                    phase (P1) consisted of the participant selection of the 50% duty cycle, achromatic square
                    wave gratings from 0.5, 3, 5.87 or 11.77 cpd that caused them the maximum or minimum
                    discomfort. Each trial consisted of a 2000 ms grey screen with a central fixation cross
                    (1◦ per arm) followed by a square region 12◦ × 12◦ filled with one of the spatial frequencies
                    presented 1.5◦ from either the left or right side of the cross for 500 ms (see Figure 1:
                    top). This was then removed, leaving the grey background with five Likert scale choices
                    displayed from left to right (very uncomfortable, uncomfortable, neutral, comfortable and
                    very comfortable). The observer moved the cursor to the left and right using the arrow keys
                    and then pressed the spacebar to record the choice. The responses were converted to digits:
                    ‘very uncomfortable’ = 4, to ‘very comfortable’ = 0. Trials were self-paced. There were
                    24 trials with six presentations of the four frequencies in a random order. The maximum
                    score possible for any spatial frequency was 24 and the minimum 0. A rest was offered
                    after 12 trials.
Vision 2022, 6, 1                                                                                                6 of 16

                    Figure 1. The top image is an example of the type of stimuli displayed in the first phase of the
                    experiment: spatial frequency selection. The bottom image is an example of the type of stimuli used
                    in the second phase of the experiment where each participant’s most uncomfortable spatial frequency
                    was rated when ‘overlain’ with 10 different colours from Wilkin’s Intuitive Overlays.

                          The second phase (P2) of the experiment consisted of the participant’s selection of two
                    colour ‘overlays’ that were the most and least comfortable for them digitally placed over
                    their previously selected most uncomfortable spatial frequency. There were ten colours:
                    rose, purple, aqua, lime-green, orange, grey, yellow, mint-green, blue, and pink, all based on
                    Wilkin’s Intuitive Overlays (Institute of Ophthalmology Marketing [47]). All colours were
                    matched for luminance, and each individual colour displayed on the monitor was matched
                    as closely as possible (within the limits of the gamut of the monitor) to the CIE (x, y) value
                    of the corresponding I.O.O. overlay (see Figure 1: bottom). The display times and Likert
                    methodology for rating the colours were the same as P1. There were 40 self-paced trials
                    with four presentations of the ten colours in a random order, with rests offered after every
                    10 trials. The maximum score possible was 16 and the minimum score was 0.
                          The final phase (P3) of the experiment was a dot-probe task. This task was used to
                    test hypervigilance towards an achromatic horizontal square wave 3 cpd (vs. 0.5 cpd)
                    pattern in the M/HVD group compared to the NoH/LVD group, and to determine a
                    reduction in hypervigilance when the pattern was ‘overlain’ with the colour selected by
                    each participant to be the most comfortable for viewing the patterns (see Figure 1: bottom).
                    The 3 cpd gratings were designed to elicit a much greater aversive response than the 0.5 cpd
                    gratings [2,25,48] and this spatial frequency also produced a large and significant difference
                    in comfort ratings between the groups in P1. Additionally, spatially ‘scrambled’ patterns
                    were used as a control non-aversive stimulus (see below). Participants were informed to
                    keep their eyes focused on the fixation cross that would be presented for 2000 ms, after
                    which a stimulus pair would be displayed for 500 ms. Immediately following this, a
                    0.5◦ white dot would appear in the middle of where one of the patterns had appeared.
                    The task was to locate the dot as quickly as possible by pressing a left response or a right
                    response key (see Figure 2 for more details). The trials were self-paced. Reaction times were
                    recorded in ms and no response after 1500 ms would result in a time-out and these data
                    were not included for analysis. Participants were informed that breaks could be offered if
                    needed at a quarter, half, and three quarters of the way through the experiment, and that
                    the test would last about seven minutes.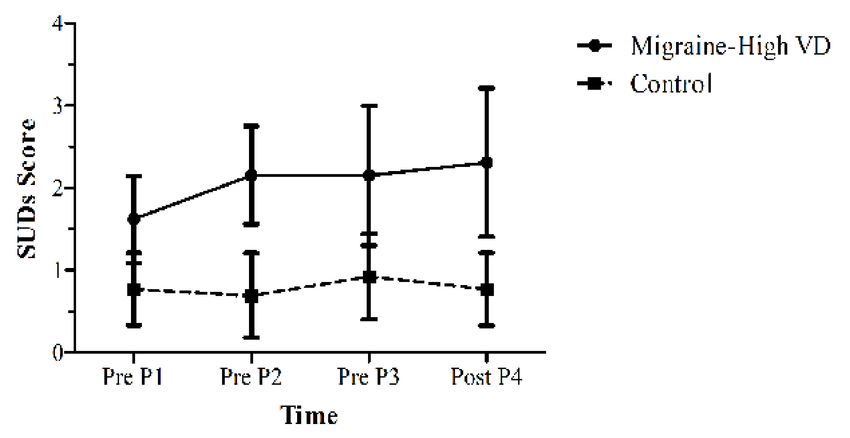
Vision 2022, 6, 1                                                                                                     7 of 16

                    Figure 2. Achromatic dot-probe trial for a stimulus pair of left: 3 cpd, right: scrambled 3 cpd. In
                    the chromatic condition, both stimuli were overlain with one of ten colours matched from Wilkin’s
                    Intuitive Overlays. The pair of stimuli appear for 500 ms side by side. Immediately after, a dot
                    appeared, either on the left or right, centred on the location previously occupied by either stimulus,
                    and participants responded left or right as quickly as possible corresponding to the location of the dot.

                          The stimulus pairs used in P3 are outlined in Table 2. The same three conditions were
                     displayed as either achromatic (see Figure 1: top) or with the preferred colour (see Figure 1:
                     bottom). For both the 0.5 cpd and the 3 cpd, scrambled stimuli were created by dividing
                     each stimulus (12◦ × 12◦ ) into 1600 ‘tiles’ using a 0.3◦ × 0.3◦ mesh, then randomizing
                     the location of each of the tiles within the same area (see Figure 2, second frame from the
                     bottom). The scrambled patterns were used for three reasons. First, disrupting the pattern
                     to reduce the Fourier energy in one direction (vertical) is related to a reduction in visual
                     discomfort [49]. Second, they contained the same spatially averaged luminance as well
                     as areas of black versus white as the intact gratings but did not elicit visual discomfort.
                    Third, if the gratings were to elicit an emotional response, then it was assumed that a
                     scrambled pattern would not elicit as much of an emotional response as it could no longer
                     be identified as a grating. This is analogous to the finding that the emotional effects of
                     faces (e.g., hostile faces) can be differentiated from their low-level visual properties in
                    ‘scrambled’ faces [50,51], where the latter do not elicit an emotional response. Finally, only
                     six conditions were tested and were selected from a potential 28 pairs of stimuli. This was
                    primarily implemented to ensure that the participants, especially in the M/HVD group, did
                     not receive prolonged repetitive exposure to uncomfortable high-contrast grating stimuli.
                     Pilot work using a longer duration experiment led to participants withdrawing from the
                     experiment. For this reason, trials also presented either completely chromatic or achromatic
                     stimuli, and not a mixture of achromatic with chromatic.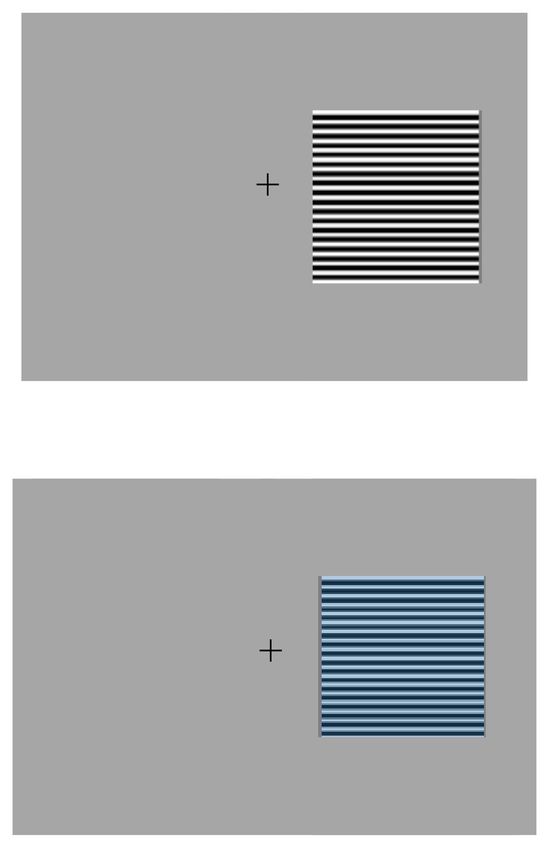
Vision 2022, 6, 1                                                                                                                  8 of 16

                    Table 2. Six stimulus pairs used in the P3: dot-probe experiment.

                            Condition                     Position 1 *                   Position 2                      Colour
                                  1                   0.5 cpd, scrambled                   3 cpd                      achromatic
                                  2                   0.5 cpd, scrambled             3 cpd, scrambled                 achromatic
                                  3                    3 cpd, scrambled                    3 cpd                      achromatic
                                  4                   0.5 cpd, scrambled                   3 cpd                    preferred colour
                                  5                   0.5 cpd, scrambled             3 cpd, scrambled               preferred colour
                                  6                    3 cpd, scrambled                    3 cpd                    preferred colour
                    * ‘Position 1’ could be either left or right of the fixation cross, with ‘Position 2’ the opposite location.

                         There were 12 repeats of each of the six conditions (Table 2). One stimulus was on
                    the left for six trials, and on the right for the other six. Additionally, in six of those repeats,
                    the probe dot was presented on the left, and in the other six, the dot was on the right. The
                    resultant 72 experimental trials were presented in a random order following one minute’s
                    worth of practice. Upon completion, the final SUDS rating was administered. The SUDS
                    rating was also administered before and after P3, to be compared with data gathered before
                    P1 and P2. Participants were debriefed and questioned on their thoughts and feelings
                    experienced during testing.

                    3. Results
                          For all analyses, unless otherwise stated, the assumptions of linearity and homoscedas-
                    ticity were met. When the Mauchly’s test of sphericity showed a significant result (p < 0.05),
                    a Greenhouse–Geisser correction was always applied to the degrees-of-freedom value.

                    3.1. Analyses of Pool’s VDS and IHS Screening Data
                          The VDS data were significantly positively skewed (skewness statistic/SE = 5.25) so
                    these data underwent a square-root transformation to remove the skew (skewness statis-
                    tic/SE = −0.90). One multivariate and one univariate outlier were removed. Significant
                    relationships were found between gender and headache (χ2 (1, N = 220) = 9.42, p = 0.002)
                    and gender and migraine (χ2 (2, N = 180) = 13.43, p < 0.001). Twenty-nine percent of male
                    participants experienced no headaches compared to 12% of the females, 44% of males
                    experienced headaches compared to 49% of the females, and 29% of males suffered from
                    migraines compared to 39% of the females.
                          The four groups from Table 1 were then compared on their VDS scores (Figure 3).
                    There was a significant effect based on the group: (F(3,351) = 30.28, p < 0.001, η p 2 = 0.21).
                    Bonferroni-corrected (α = 0.008) t-tests revealed significant differences between all groups,
                    except for migraine undiagnosed vs. migraine diagnosed, with effect sizes ranging from
                    d = 0.56 to 1.6 [52]. The severity of headaches was operationalized as ‘average number
                    of headaches a year’, bearing in mind the caveat that it is possible to dissociate between
                    frequent minor headaches with less frequent but more severe experiences. However,
                    we had no access to severity of headache data. The relationship between the headache
                    frequency (where clearly quantitatively reported, N = 95) and VDS data was analysed with
                    a Pearson product-moment correlation. These frequency data were skewed (skewness
                    statistic/SE = 11.16), so a square-root transformation was performed to reduce the skew to
                    an acceptable level (skewness statistic/SE = 2.54). Eight outliers were removed. There was
                    a significant positive correlation between SqrtVDS and SqrtHeadache Frequency for these
                    data of moderate effect size (r = 0.31, N = 87, p = 0.004) and this is shown in Figure 4.
Vision 2022, 6, 1 9 of 16
Figure 3. Mean VDS scores for each headache group, with the error bars representing 95% CIs.
Figure 4. Scatterplot of yearly SqrtHeadache Frequency correlated with SqrtVDS for the migraine
headache group showing a correlation of moderate size [52].
3.2. Analyses of Experimental Results
An independent samples t-test was conducted, ensuring that the groups did not differ
on age (t(24) = 0.09, p = 0.93). No participant was greater than three SDs from the mean. A
chi-square test was performed that showed no significant differences in sex ratios between
the groups (χ2 (1,26) = 1.18, p = 2.77).
3.2.1. Anxiety
The SUDS data were analysed to determine the effects of various points during the
experiment on distress levels. No transformation of these data was required. A mixed
model ANOVA was conducted on Time (four levels: PreP1, PreP2, PreP3, PostP4) and
Group (two levels: M/HVD, NoH/LVD) against the SUDS score. Figure 5 displays the
mean SUDS rating for each group at the various times.Vision 2022, 6, 1 10 of 16
Figure 5. Mean SUDS scores for each group (N = 26, 13 per group) across four points, with three
immediately before each test (Pre P1, Pre P2, Pre P3) and one immediately after P3 (labelled Post P4).
The error bars represent 95% CIs.
There was a significant main effect of Group (F(1,24) = 15.71, p = 0.001, η p 2 = 0.40),
showing a higher distress experienced by the M/HVD group overall, but no interaction
with Time (F(3,72) = 1.21, p = 0.31), nor a main effect for Time (F(3,72) = 1.33, p = 0.27).
In addition, the M/HVD group experienced higher trait anxiety according to the STAI-Y
test (M = 42.92, SD = 12.66) than the control NoH/LVD group (M = 33.92, SD = 5.82;
t(16.80) = 2.32, p = 0.017, d = 1.13). Moreover, the M/HVD group experienced higher state
anxiety (M = 35.85, SD = 10.39) than the control group (M = 28.00, SD = 5.30; t(24) = 2.42,
p = 0.012, d = 0.71). When all experimental participants were included, including those not
matched on age and gender, it is interesting to note that there was a significant correlation
with a small effect size (r = 0.28, N = 38, p = 0.044, one tail) between VDS and trait anxiety.
3.2.2. Spatial Frequency and Visual Discomfort
The M/HVD group found all spatial frequencies more uncomfortable than the controls.
A mixed ANOVA was conducted with Group (M/HVD, NoH/LVD) × Spatial Frequency
(four levels: 0.5, 3, 5.9 and 11.8cpd) against the VDS score. The ANOVA yielded a significant
main effect of Group (F(1,24) = 7.27, p = 0.013, η p 2 = 0.23) with t-tests (α = 0.0125) revealing
significant differences between the groups only at 3 cpd (t(24) = 2.4, p = 0.012, d = 0.98) and
5.9 cpd (t(24) = 2.62, p = 0.008, d = 1.07).
3.2.3. Colour and Visual Discomfort
These data are presented in Figure 6. A mixed ANOVA was conducted with Group
(M/HVD, NoH/LVD) × Colour (ten levels) against the VDS score. There was a significant
main effect of colour (F(1,24) = 4.38, p = 0.002, η p 2 = 0.15). Both groups found aqua
and blue to be the least uncomfortable. Since the groups’ discomfort rating diverged for
rose and pink, a post hoc exploratory mixed ANOVA was conducted: Group (M/HVD,
NoH/LVD) × Colour (four levels: rose, pink, blue, aqua). The analyses revealed that
the assumptions of the equality of co-variances and normality were met. There was a
significant Group × Colour interaction (F(1,1.99) = 3.37, p = 0.043, η p 2 = 0.12) with a small
effect size. The significant interaction was followed up with paired samples t-tests looking
at the simple effects of the colours between groups (α = 0.008). There was a large significant
effect between groups for rose (t(24) = 3.3, p = 0.002, d = 1.35), and for pink (t(24) = 2.96,
p = 0.004, d = 1.21). Finally, just within the M/HVD group, there were significant differences
(α = 0.025) between each of rose and aqua (d = 0.61), and rose and blue (d = 0.63).Vision 2022, 6, 1 11 of 16
Figure 6. Total Discomfort score for each Group across the ten colours. The error bars represent ±1
SEM (N = 26, 13 per group).
3.2.4. Dot-Probe Analyses
Reaction time (RT) data for correct trials were analysed to determine AB towards
the aversive 3 cpd grating and to investigate if colour could reduce this AB. Since the RT
data were positively skewed, a geometric mean of the RTs from the trials of each the six
conditions (Table 2) was calculated for each participant, and these averaged scores were
not skewed. In the following, the term ‘aversive’ refers to the 3 cpd intact pattern, whereas
‘non-aversive’ refers to the scrambled patterns. In addition, probe dots appearing in the
location of the aversive 3 cpd pattern were termed ‘congruent’, and dots not appearing in
this location were termed ‘incongruent’. A mixed ANOVA was performed that included
conditions one, three, four and six (Table 2): Group (M/HVD, NoH/LVD) × Colour
(achromatic, chromatic) × Congruency (congruent, incongruent) with averaged RT as the
DV. There was a large significant main effect of Colour (F(1,24) = 9.06, p = 0.006, η p 2 = 0.27),
and Group (F(1,24) = 6.53, p = 0.017, η p 2 = 0.21) (Figure 7). There were no other significant
main effects or interactions; however, there was a trend for the interaction of Colour ×
Congruency with a medium effect size (F(1,24) = 3.51, p = 0.073, η p 2 = 0.13).
Figure 7. Group, Colour and Congruency effects for conditions one, three, four and six. RTs were
averaged over 12 repeat trials for each participant. The error bars represent ±1 SEM.
Conditions two and five (Table 2) were analysed to determine the relative aversive-
ness of the two scrambled patterns, as both were assumed to not be aversive compared
with the intact 3 cpd pattern. Just in this case, probe dots appearing in the location of
the 3 cpd pattern were termed ‘congruent’, and dots not appearing in this location were
termed ‘incongruent’. An ANOVA was conducted: Group (M/HVD, NoH/LVD) × Colour
(achromatic, chromatic) × Congruency (congruent, incongruent), resulting in a large sig-
nificant group × colour interaction (F(1,24) = 12.25, p = 0.002, η p 2 = 0.34), and a mainVision 2022, 6, 1 12 of 16
effect of Group (F(1,24) = 5.94, p = 0.022, η p 2 = 0.20). Figure 8 shows that the M/HVD
group was faster to respond to dots congruent to the achromatic 3 cpd scrambled pattern
than to the achromatic 0.5 cpd scrambled pattern. This difference was not present in the
chromatic patterns. The NoH/LVD group’s RTs were all about the same. Bearing this
potential confound in mind, an ANOVA was conducted on just conditions one and four,
excluding data from trials with the 3 cpd scrambled pattern. There was a main effect for
Congruency (F(1,24) = 11.05, p = 0.003, η p 2 = 0.32) and Group (F(1,24) = 1788.49, p = 0.016,
η p 2 = 0.22), whereby the M/HVD group’s RTs to dots congruent to the aversive achromatic
pattern (mean RT = 406.6 ms) were slower than the RTs to the achromatic scrambled pattern
(mean RT = 386.7). This effect was not seen in the corresponding chromatic conditions:
mean RT = 399.3 vs. M = 395.2. The NoH/LVD group did not show this pattern of results
for the same conditions: all average RTs were between 368 and 378 ms.
Figure 8. Group, Colour and Congruency effects for control conditions two and five. RTs were
averaged over 12 repeat trials. The error bars represent ±1 SEM.
4. Discussion
4.1. Visual Discomfort and Migraines
From the initial screening data, the higher prevalence of migraine in females over
males was in line with previous findings [53]. What was clear though, was that as the
severity of the headache typically experienced in each group (Table 1) increased, the level of
visual discomfort also increased. This has been demonstrated before in migraineurs [27,54].
However, here we show for the first time that the relationship exists, not just in those who
suffer from migraines, but in those suffering from more common types of headaches. In
fact, where we had quantitative data on headaches of any kind and their frequency of
occurrence, the more frequent the headaches, the more the level of visual discomfort. This
supports recently reported results [54] showing a relationship between ‘photophobia’ and
headache severity.
4.2. Visual Discomfort and Anxiety and Colour
As to the relationship between anxiety and migraines/high visual discomfort, the
results from the experiment clearly always show that the M/HVD group had significantly
higher trait, state and in-the-moment anxiety than the control NH/LVD group, further
supporting the results of Nulty, Wilkins and Williams [22]. Intriguingly, and in line with [22],
when all 38 experimental participants were included, a significant correlation was found
between trait anxiety and their VDS score (r = 0.28, p = 0.045).
With respect to the rating of the spatial frequencies producing the most visual stress/
discomfort, 3.0 cpd and 5.9 cpd were rated highest; however, 11.8 cpd was also highly
rated. These results regarding spatial frequency were not as clear cut as initially reported
by Wilkins [15], where 3.0 cpd is reported as clearly the most aversive. The higher spatial
frequency could have introduced ‘jazzing effects’ seen in Op Art, a ‘wavy’ motion which is
reported as irritating [55], and this, in turn, introduces a confound in the interpretation of
the data related to spatial frequency and discomfort. For this reason, and for reasons ofVision 2022, 6, 1 13 of 16
consistency across all participants, we resolved to use 3 cpd as the aversive stimulus in the
dot-probe P3 phase of the experiment.
Regarding P2 of the experiment, the control group consistently rated some colours
as more ‘comfortable’ than others in the blue-purple-pink range. In people suffering from
visual stress, Wilkins [15] found that all colours of his Intuitive Overlays were given equal
preference. On the other hand, for our M/HVD group under the short presentation time
conditions, it was clear that some colours resulted in higher levels of discomfort than
others. Pink and rose colours produced the largest difference between the groups, with the
migraine group rating them as uncomfortable, while blueish colours were more comfortable
for this group. Future studies could explore whether M/HVD require more blue light
stimulation, as there is a slight S-cone (‘blue-violet’) colour discrimination deficiency in
migraineurs [56]. Additionally, further research is needed into the saturation of the colours
that prove to be the most comfortable for the M/HVD group, as recent research has shown
that migraineurs with aura tend to choose more saturated colours as being comfortable [57].
4.3. Unconscious Anxiety Effects and the Effect of Colour in the Dot-Probe Task
The results from this phase of the experiment are not straightforward. Certainly, the
M/HVD group had a different pattern of results from the control. Overall, the M/HVD
group recorded slower RTs than the control group. M/HVD may have found the entire
task to be avoidant, as the exposure duration of 500 ms would have allowed enough time
for avoidance to build. In fact, half a second was chosen as the exposure time even though
such a duration, rather than say, 100 msec, would most likely produce an avoidant AB [36].
It was reasoned that a very short, nearly subliminal exposure time, while temporally more
likely to yield a hypervigilant AB, would not be a long enough exposure for a neural
response to occur [15,58]. Alternatively, the achromatic pattern that was flashed for 500ms
may have created an illusion of an ‘after-image’ that masked the dot temporarily. Having a
higher neural threshold, the NoH/LVD group would be less affected [59].
When the dot is preceded by colour, the overall RTs were slower across both groups.
It could be argued that this may be because colour processing is slower than achromatic
processing [60]. However, the task on which RTs were measured involved the detection of
the same stimuli for both achromatic and chromatic conditions: a white dot. Another possi-
bility is that the colour being present before the detection of the dot calms the participant,
slightly reducing arousal levels, and this in turn results in slower RTs.
A comparison of the putatively non-aversive scrambled control patterns revealed
that for the M/HVD alone, and not for the control group, there were faster RTs to dots
congruent to the 3 cpd scrambled pattern than to the 0.5 cpd scrambled pattern. This
difference was reduced from 26 ms to1 ms in the chromatic condition. Clearly, in terms of
AB, the 3 cpd scrambled pattern was aversive to M/HVD, but this aversion disappeared
with the addition of colour. Why was this the case in what were intended to be the control,
non-aversive stimuli? This may be a result of the scrambling having introduced thin line
sections, as the first experiment found that the finer gratings were also uncomfortable.
Because these problems were only evident in the 3 cpd scrambled stimulus, analyses
were conducted just on the 3 cpd/0.5 cpd scrambled trials. These partial results did show
that the migraine group had a longer RT to the aversive 3 cpd achromatic pattern compared
to the scrambled pattern, but the colour gratings and the control pattern showed no such
difference. The control group did not show this pattern of results. This does suggest that the
3 cpd grating induced an avoidant AB in the migraine group that was ameliorated by colour.
The findings indicate that colour may have the effect of providing better clarity of the image
in M/HVD [27]. It is suggested that colour may help identify threats more rapidly, and
so the avoidant response could be initiated earlier. This would serve a protective function
for the migraineur, shielding them from potential pain, and in this sense it would lower
anxiety. The avoidance may be a homeostatic mechanism for down-regulating cortical
excitability [61]. Future work should assay 50 msec presentation times so that the avoidance
would not have time to build up.Vision 2022, 6, 1 14 of 16
On the other hand, slower responses to the aversive stimuli could reflect an inability
to capture the intervening process because these measures instead allowed the observation
of behavioural (rather than cognitive) processes resulting from anxiety. For instance, the
automatic vigilance and vigilance avoidance hypotheses propose that, whilst threatening
stimuli are visually detected very rapidly due to a secondary process that more thoroughly
evaluates the threat, ongoing activity (e.g., the interpretation of emotion) is temporarily
interrupted, resulting in a slower behavioural response to threat-related stimuli [62]. It is
presumed that anxious individuals direct their attention away from the threat as a strategic
attempt to reduce the anxiety elicited by the threatening stimuli. The automatic vigilance
and vigilance avoidance hypotheses may account for the disparate findings on attentional
processes after threat exposure.
Author Contributions: Conceptualization, Y.B.Z.W. and T.J.H.; methodology, T.J.H. and Y.B.Z.W.;
software design, T.J.H.; validation, T.J.H. and Y.B.Z.W.; formal analysis, Y.B.Z.W.; investigation,
Y.B.Z.W.; resources, T.J.H.; data curation, T.J.H. writing—original draft preparation, T.J.H.; writing—
review and editing, Y.B.Z.W.; visualization, T.J.H.; supervision, T.J.H.; project administration, Y.B.Z.W.
All authors have read and agreed to the published version of the manuscript.
Funding: This research received no external funding.
Institutional Review Board Statement: The study was conducted according to the guidelines of the
Declaration of Helsinki, and approved by the Griffith University Human Research Ethics Committee:
extended approval of GU Ref No: PSY/H9/07/HRC ‘The Effect of Colour and Visual Noise on
Dyslexics and Migraineurs’, approved 24 October 2014.
Informed Consent Statement: Informed consent was obtained from all subjects involved in the study.
Data Availability Statement: The data presented in this study are available on request from the
corresponding author. The data are not publicly available due to participant privacy.
Acknowledgments: Thank you to Connor Reid for coding the experiments on Presentation® and to
Heidi Travers for collapsing the raw data into SPSS® sav files.
Conflicts of Interest: The authors declare no conflict of interest.
References
1. Wilkins, A.J.; Jeanes, R.J.; Pumprey, P.D.; Laskier, M. Rate of Reading Test: Its reliability, and its validity in the assessment of the
effects of coloured overlays. Ophthal Physiol. Opt. 1996, 16, 491–497. [CrossRef]
2. Huang, J.; Zong, X.; Wilkins, A.; Jenkins, B.; Bozoki, A.; Cao, Y. fMRI evidence that precision ophthalmic tints reduce cortical
hyperactivation in migraine. Cephalalgia 2011, 31, 925–936. [CrossRef]
3. Good, P.A.; Taylor, R.H.; Mortimer, M.J. The use of tinted glasses in childhood migraine. Headache J. Head Face Pain 1991, 31,
533–536. [CrossRef] [PubMed]
4. Evans, B.J.W.; Patel, R.; Wilkins, A.J. Optometric function in visually sensitive migraine before and after treatment with tinted
spectacles. Ophthal. Physiol. Opt. 2002, 22, 130–142. [CrossRef] [PubMed]
5. Martin, P.R.; Teoch, H. Effects of visual stimuli and a stressor on head pain. Headache 1999, 39, 705–715. [CrossRef]
6. Hamelsky, S.W.; Lipton, R.B. Psychiatric comorbidity of migraine. Headache 2006, 46, 1327–1333. [CrossRef] [PubMed]
7. Hollis, J.; Allen, P.M.; Fleischmann, D.; Aulak, R. Personality dimensions of people who suffer from visual stress. Ophthal. Physiol.
Opt. 2006, 27, 603–610. [CrossRef]
8. Pelligrini, R.J.; Schauss, A.G.; Miller, M.E. Room colour and aggression in a criminal detention holding cell: A test of the
“tranquilizing pink” hypothesis. Orthomol. Psychiatry 1981, 10, 174–181.
9. Wilkins, A.J.; Patel, R.; Adjamian, R.; Evans, B.J.W. Tinted spectacles and visually sensitive migraine. Cephalalgia 2002, 22, 711–719.
[CrossRef]
10. MacLeod, C.; Mathews, A.; Tata, P. Attentional bias in emotional disorders. J. Abnorm. Psychology 1986, 95, 15–20. [CrossRef]
11. Goadsby, P.J. Pathophysiology of migraine. Genet. Epidemiol. 2009, 27, 335–360. [CrossRef]
12. International Classification of Headache Disorders. Headache Classification Subcommittee of the International Headache Society.
Int. Classif. Headache Disorders Cephalalgia 2013, 33, 629–808.
13. Borsook, D.; Maleki, N.; Becerra, L.; McEwan, B. Understanding migraine through the lens of maladaptive stress responses: A
model disease of allostatic load. Neuron 2012, 73, 219–234. [CrossRef] [PubMed]
14. Burstein, R. Deconstructing migraine into peripheral and central sensitization. Pain 2001, 89, 110–117. [CrossRef]
15. Wilkins, A.J. Visual Stress; Oxford University Press: Oxford, UK, 1995.Vision 2022, 6, 1 15 of 16
16. Fisher, R.S.; Harding, G.; Erba, G.; Barkley, G.L.; Wilkins, A. Photic-and pattern-induced seizures: A review for the Epilepsy
Foundation of America Working Group. Epilepsia 2005, 46, 1426–1441. [CrossRef]
17. Hedborg, K.; Anderberg, U.M.; Muhr, C. Stress in migraine: Personality-dependent vulnerability, life events, and gender are of
significance. Upsala J. Med. Sci. 2011, 116, 187–199. [CrossRef]
18. Annau, Z.; Kamin, L.J. The conditioned emotional response as a function of intensity of the US. J. Comp. Physiol. Psychol. 1961, 54,
428–432. [CrossRef]
19. LeDoux, J.E. The Emotional Brain: The Mysterious Underpinnings of Emotional Life; Simon & Schuster: New York, NY, USA, 1996.
20. Ohman, A.; Mineka, S. Fears, phobias, and preparedness: Toward an evolved module of fear and fear learning. Psychol. Rev. 2001,
108, 483–522. [CrossRef] [PubMed]
21. Öhman, A.; Nordby, H.; d’Elia, G. Orienting and schizophrenia: Stimulus significance, attention, and distraction in a signaled
reaction time task. J. Abnorm. Psychol. 1986, 95, 326–334. [CrossRef]
22. Nulty, D.D.; Wilkins, A.J.; Williams, J.M.G. Mood, pattern sensitivity and headache: A longitudinal study. Psychol. Med. 1987, 17,
705–713. [CrossRef]
23. Harle, D.E.; Evans, B.J.W. The optometric correlates of migraine. Ophthal. Physiol. Opt. 2004, 24, 369–383. [CrossRef]
24. Aldrich, A.; Hibbard, P.; Wilkins, A. Vision and hyper-responsiveness in migraine. Vision 2019, 3, 62. [CrossRef] [PubMed]
25. Shepherd, A.J.; Hine, T.J.; Beaumont, H.M. Colour and spatial frequency are related to visual pattern sensitivity in migraine.
Headache 2013, 1087–1103. [CrossRef] [PubMed]
26. Hamedani, Z.; Solgi, E.; Skates, H.; Hine, T.; Fernando, R.; Lyons, J.; Dupre, K. Visual discomfort and glare assessment in office
environments: A review of light-induced physiological and perceptual responses. Build. Environ. 2019, 153, 267–280. [CrossRef]
27. Harle, D.E.; Shepherd, A.J.; Evans, B.J. Visual stimuli are common triggers of migraine and are associated with pattern glare.
Headache 2006, 46, 1431–1440. [CrossRef]
28. Jacobs, K.W.; Suess, J.F. Effects of four psychological primary colors on anxiety state. Percept. Mot. Ski. 1975, 41, 207–210.
[CrossRef]
29. Wilson, Arousal properties of red versus green. Percept. Mot. Ski. 1996, 23, 947–949.
30. Valdez, P.; Mehrabian, A. Effects of colour on emotions. J. Exp. Psychol. 1994, 123, 394–409. [CrossRef]
31. Profusek, P.J.; Rainey, D.W. Effects of baker-miller pink and red on state anxiety, grip strength, and motor precision. Percept. Mot.
Ski. 1987, 65, 941–942. [CrossRef]
32. Todd, J.; van Ryckeghem, D.M.; Sharpe, L.; Crombez, G. Attentional bias to pain-related information: A meta-analysis of dot-probe
studies. Health Psychol. Rev. 2018, 12, 419–436. [CrossRef]
33. Eysenck, M.W. Anxiety and Cognition: A Unified Theory; Psychology Press: Hove, UK, 1997.
34. Van Bockstaele, B.; Verschuere, B.; Tibboel, H.; De Houwer, J.; Crombbez, G.; Koster, H.W. A review of current evidence for the
causal impact of attentional bias on Fear and Anxiety. Psychol. Bull. 2014, 140, 682–721. [CrossRef]
35. Rosen, J.B.; Schulkin, J. From normal fear to pathological anxiety. Psychol. Rev. 1998, 105, 325–350. [CrossRef]
36. Bar-Haim, Y.; Lamy, D.; Pergamin, L.; Bakermans-Kranenburg, M.J.; van IJzendoorn, M.H. Threat-related attentional bias in
anxious and nonanxious individuals: A meta-analytic study. Psychol. Bull. 2007, 133, 1–24. [CrossRef]
37. Mogg, K.; Bradley, B.P. Time course of attentional bias for fear-relevant pictures in spider-fearful individuals. Behav. Res. Ther.
2006, 44, 1241–1250. [CrossRef]
38. Harvey, A.G.; Watkins, E.; Mansell, W.; Shafran, R. Cognitive Behavioural Processes Across Psychological Disorders: A Transdiag-
nostic Approach to Research and Treatment. Oxford University Press: Oxford, UK, 2004.
39. Salemink, E.; van den Hout, M.A.; Kindt, M. Selective attention and threat: Quick orienting versus slow disengagement and two
versions of the dot-probe task. Behav. Res. Ther. 2007, 45, 607–615. [CrossRef]
40. Conlon, E.G.; Lovegrove, W.J.; Chekaluk, E.; Pattison, P.E. Measuring visual discomfort. Vis. Cogn. 1999, 6, 637–663. [CrossRef]
41. Marcus, D.A.; Soso, J.J. Migraine and stripe-induced visual discomfort. Arch. Neurol. 1989, 1129–1132. [CrossRef] [PubMed]
42. Spielberger, C.D.; Gorsuch, R.L.; Lushene, R.E.; Vagg, P.R.; Jacobs, G.A. The State-Trait Anxiety Inventory for Adults Manual; Mind
Garden: Menlo Park, CA, USA, 1983.
43. Wolpe, J. The Practice of Behaviour Therapy, 4th ed.; Pergamon: Oxford, UK, 1990.
44. Fricke, T.R.; Siderov, J. Stereopsis, stereotests, and their relation to vision screening and clinical practice. Clin. Exp. Optom. 1997,
80, 165–172. [CrossRef]
45. Smeets, G.; Merckelbach, H.; Griez., E. Panic disorder and right-hemisphere reliance. Anxiety Stress Coping 1997, 10, 245–255.
[CrossRef]
46. Kaplan, D.M.; Smith, T.; Coons, J. A validity study of the subjective unit of discomfort (SUD) score. Meas. Eval. Couns. Dev. 1995,
27, 195–199.
47. Wilkins, A.J.; Evans, B.J. Visual stress, its treatment with spectral filters, and its relationship to visually induced motion sickness.
Appl. Ergon. 2010, 41, 509–515. [CrossRef] [PubMed]
48. Wilkins, A.J.; Nimmo-Smith, J.I.; Tait, A.; McManus, C.; Della Sala, S.; Tilley, A.; Arnold, K.; Barrie, M.; Scott, S. A neurological
basis for visual discomfort. Brain 1984, 107, 989–1017. [CrossRef]
49. Penaccio, O.; Wilkins, A. Visual discomfort and the spatial distribution of Fourier energy. Vis. Res. 2015, 108, 1–7. [CrossRef]
[PubMed]Vision 2022, 6, 1 16 of 16
50. Fang, F.; He, S. Cortical responses to invisible objects in the human dorsal and ventral pathways. Nat. Neurosci. 2005, 8, 1380–1385.
[CrossRef]
51. Gray, K.L.; Adams, W.J.; Hedger, N.; Newton, K.E.; Garner, M. Faces and awareness: Low-level, not emotional factors determine
perceptual dominace. Emotion 2013, 13, 537–544. [CrossRef]
52. Cohen, J. A power primer. Psychol. Bull. 1992, 112, 155–159. [CrossRef]
53. Steiner, T.J.; Scher, A.I.; Stewart, W.F.; Kolodner, K.; Liberman, J.; Lipton, R.B. The prevalence and disability burden of adult
migraine in England and their relationships to age, gender and ethnicity. Cephalalgia 2003, 23, 519–527. [CrossRef] [PubMed]
54. Hayne, D.P.; Martin, P.R. Relating photophobia, visual aura, and visual triggers of headache and migraine. Headache 2019, 59,
430–442. [CrossRef]
55. Zanker, J.M.; Hermens, F.; Walker, R. Quantifying and modeling the strength of motion illusions perceived in static patterns.
J. Vis. 2010, 10, 13. [CrossRef] [PubMed]
56. Shepherd, A.J. Colour vision in migraine: Selective deficits for S-cone discriminations. Cephalalgia 2005, 25, 412–423. [CrossRef]
57. Vieira, A.; van der Linde, I.; Bright, P.L.; Wilkins, A. Preference for lighting chromaticity in migraine with aura. Headache J. Head
Face Pain 2020, 60, 1124–1131. [CrossRef] [PubMed]
58. Siniatchkin, M.; Groppa, S.; Jerosch, B.; Muhle, H.; Kurth, C.; Shepherd, A.J.; Siebner, H.; Stephani, U. Spreading photoparoxysmal
EEG response is associated with an abnormal cortical excitability pattern. Brain 2007, 130, 78–87. [CrossRef]
59. Ferrari, M.D. Migraine. Lancet 1997, 9108, 1043–1105.
60. Mollon, J.D.; Krauskopf, J. Reaction time as a measure of the temporal response properties of individual colour mechanisms. Vis.
Res. 1973, 13, 27–40. [CrossRef]
61. Cosentino, G.; Fierro, B.; Vigneri, S.; Talamanca, S.; Paladino, P.; Baschi, R.; Indovino, S.; Maccora, S.; Valentino, F.; Fileccia, E.;
et al. Cyclical changes of cortical excitability and metaplasticity in migraine: Evidence from a repetitive transcranial magnetic
stimulation study. Pain 2014, 155, 1070–1078. [CrossRef]
62. Wentura, D.; Rothermund, K.; Bak, P. Automatic vigilance: The attention-grabbing power of approach- and avoidance-related
social information. J. Personal Soc. Psychol. 2000, 78, 1024–1037. [CrossRef]You can also read