Parametric Modeling of Mass and Volume Effects for Battery Electric Vehicles, with Focus on the Wheel Components
←
→
Page content transcription
If your browser does not render page correctly, please read the page content below

Article
Parametric Modeling of Mass and Volume Effects
for Battery Electric Vehicles, with Focus on the
Wheel Components
Lorenzo Nicoletti * , Andrea Romano , Adrian König , Ferdinand Schockenhoff                       and
Markus Lienkamp
 Institute for Automotive Technology, Technical University of Munich, Boltzmannstr. 15, 85748 Garching, Germany;
 ge73fir@mytum.de (A.R.); adrian.koenig@ftm.mw.tum.de (A.K.); schockenhoff@ftm.mw.tum.de (F.S.);
 lienkamp@ftm.mw.tum.de (M.L.)
 * Correspondence: nicoletti@ftm.mw.tum.de; Tel.: +49-89-289-10495

 Received: 13 August 2020; Accepted: 1 October 2020; Published: 2 October 2020

 Abstract: Defining a vehicle concept during the early development phase is a challenging task,
 since only a limited number of design parameters are known. For battery electric vehicles (BEVs),
 vehicle weight is a design parameter, which needs to be estimated by using an iterative approach,
 thus causing weight fluctuations during the early development phase. These weight fluctuations,
 in turn, require other vehicle components to be redesigned and can lead to a change in their
 size (secondary volume change) and weight (secondary weight change). Furthermore, a change
 in component size can impact the available installation space and can lead to collision between
 components. In this paper, we focus on a component that has a high influence on the available
 installation space: the wheels. We model the essential components of the wheels and further quantify
 their secondary volume and weight changes caused by a vehicle weight fluctuation. Subsequently,
 we model the influence of the secondary volume changes on the available installation space at the
 front axle. The hereby presented approach enables an estimation of the impact of weight fluctuations
 on the wheels and on the available installation space, which enables a reduction in time-consuming
 iterations during the development process.

 Keywords: battery electric vehicles; secondary volume changes; secondary weight changes

1. Introduction
     The CO2 emission limits for manufacturer fleets set by the European Union (EU) have become
increasingly restrictive in recent years: In 2021, the tank-to-wheel limit will be lowered to 95 g CO2 /km [1].
BEVs represent an efficient way to reduce the average fleet consumption since they do not cause any
local CO2 emissions and are accounted as 0 g CO2 /km [2].
     However, for BEVs, there are currently neither established platforms nor predecessor vehicles on
which the development can be based. Therefore, during the developing process of BEVs, many design
parameters have to be estimated [3]. The parameter weight plays a key role because of the low energy
density of lithium-ion-batteries compared to diesel or gasoline fuels. This can be shown by comparing
an internal combustion engine vehicle (ICEV) and a BEV of the same model series (Table 1). To increase
the range by 100 km, the Golf TSI (Table 1) would need an extra 4.1 L tank capacity, which results in
approximately 3 kg additional weight. For the same range increase, the e-Golf would have to store
12.7 kWh more energy in the traction battery, which would result in a weight increase of approximately
127 kg, considering its actual energy density for the battery pack [4]. Correspondingly, the required
battery volume increase is approximately 78 L.

World Electric Vehicle Journal 2020, 11, 63; doi:10.3390/wevj11040063                www.mdpi.com/journal/wevj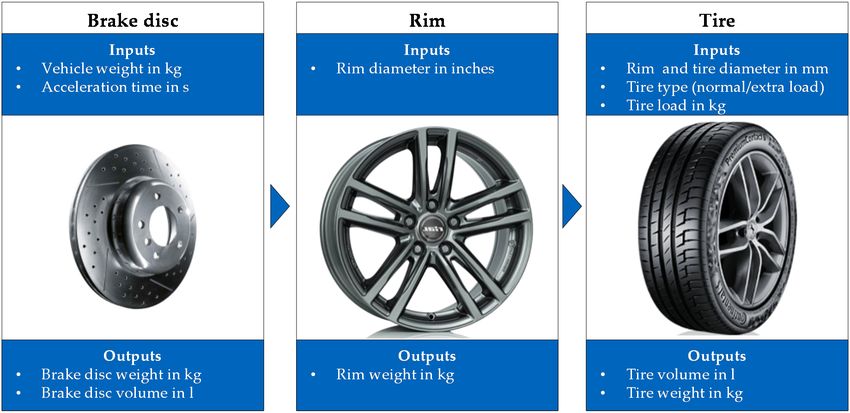
World Electric Vehicle Journal 2020, 11, 63                                                                2 of 24

      Table 1. Comparison between the internal combustion engine vehicle (ICEV) [5] and the battery electric
      vehicle (BEV) [5] variants of the Golf model series.

            Vehicle Characteristic            VW Golf 1.0 TSI BMT    VW Golf (VII) e-Golf         Delta
                  Length                            4258 mm                4270 mm                12 mm
                   Width                            1799 mm                1799 mm                 0 mm
                  Height                            1492 mm                1482 mm                10 mm
          Curb weight (with driver)                  1026 kg                1615 kg               589 kg
                   Power                              63 kW                 100 kW                37 kW
                 Top speed                          180 km/h               150 km/h              30 km/h
                   Range                            1219 km                 231 km               988 km
            Energy consumption                    4.1 L/100 km         12.7 kWh/100 km               -

     The weight increase caused by a larger traction battery does not only affect vehicle consumption
but also impacts other vehicle components. If a component becomes heavier or a new one is added
during the development process, it leads to a primary weight change (PWC) [6] (p. 9). Using the
above-cited example, the 127 kg of added battery weight is the PWC. A PWC, in turn, may require
the resizing of other vehicle components. For example, to ensure the same driving performance, the
drivetrain components must be adapted. The sum of the weight increases caused by this adaptation
is the secondary weight change (SWC). On the other hand, the 78 L of battery increase represents
the secondary volume change (SVC). Furthermore, the PWC, can also impact on further components,
such as the wheels. A greater vehicle weight requires a greater tire volume and therefore new tire
dimensions. The increase in tire volume can, in turn, impact on the available space at the front axle
(SVC on the vehicle).
     The modeling of vehicle weight in the early development design has already been researched by
various authors. Yanni et al. [7], Mau et al. [8], and Felgenhauer et al. [9] present various empirical
equations for vehicle weight estimation. However, these authors do not model SWC.
     Alonso et al. [10] derive an empirical weight model by dividing the vehicle in modules and
quantifying the SWC of each module. The results are further used to evaluate the effects of SWC on
vehicle consumption. Nevertheless, the model considers only ICEVs.
     Wiedemann et al. [11,12] develop a more detailed method for estimating BEVs weight. They derive
a basis weight for the vehicle using the model of Yanni and further add to the basis weight the weight
of the electric powertrain, which comprises traction battery, electric machine, power electronics, and
transmission. The weight of these components is estimated by using empirical models. The Wiedemann
model can estimate the SWCs, but only for the powertrain components.
     Fuchs [6,13] creates a weight model for BEVs, dividing the vehicle into modules, which are, in
turn, subdivided into their subcomponents. The weight of each subcomponent is modeled empirically
or semi-physically. The method can estimate all SWCs.
     Angerer et al. [14,15] and Del Pero et al. [16] focus on the influence of weight on BEVs consumption.
Angerer uses the model of Fuchs to estimate the influence of weight fluctuations on vehicle dynamics
and consumption. Del Pero and al. also focus on the effects of weight reduction on vehicle consumption.
However, the model of Del Pero et al. simply consists of a longitudinal simulation and does not contain
any weight modeling.
     The above-cited authors mainly focus on the SWCs, without considering that a redesign of the
components due to a PWC can trigger a change in the component volumes (i.e., a SVC). The SVC can
further impact on the available installation space. This requires a check to ensure that the package of
the vehicle remains feasible.
     To our knowledge, no automatized method exists to simultaneously estimate both SWCs and
SVCs. Thus, we aim to extend the existing SWC models with a package model that is capable of
estimating the SVC triggered by PWC and SWC. With this method, it is possible, given a PWC, to do
the following:
World Electric Vehicle Journal 2020, 11, 63 3 of 24
• World
Estimate the resulting
Electric Vehicle Journal 2020SWCs;
11, x 3 of 24
• Estimate the SVC of the single components caused by the PWC and triggered SWCs;
• Estimate the SVC on the vehicle installation spaces caused by the components SVCs.
• Estimate the SVC on the vehicle installation spaces caused by the components SVCs.
To show exemplary how this scope can be achieved, we present, in this paper, the developed
modelshow
To for the exemplary
vehicle wheels.how We thisfocus
scopeoncanthebe achieved,
wheels at the we present,
front in this
axle, since paper,
it is the the developed
primary steering
model
axle,for
and,thetherefore,
vehicle wheels.
the wheelsWe greatly
focus on the wheels
influence at the front
the available axle, since
installation it is the
space primary
for the steering
powertrain
axle, and, therefore, the wheels greatly influence the available
components. Therefore, the SVCs triggered by the wheels are particularly relevant.installation space for the powertrain
components. Therefore, the SVCs triggered by the wheels are particularly relevant.
2. Materials and Methods
2. Materials and Methods
We subdivide the wheel into three subcomponents: brake discs (Section 2.2), rims (Section 2.3),
andWetires
subdivide
(Sectionthe 2.4).wheel into three
To describe subcomponents:
these subcomponentsbrake (Figurediscs (Section
1), we employ 2.2), rims (Section
empirical models, 2.3),
and tires require
which (Sectioncreating
2.4). Toa describe
components these subcomponents
database (Figure
(Section 2.1). After1), we employ
explaining howempirical
subcomponentmodels,
which
modelsrequire
operatecreating a components
(Sections 2.2–2.4), wedatabase
combine (Section 2.1). After
them to describe theexplaining
entire wheel howandsubcomponent
conduct an
models operate
evaluation (Sections
of the wheel 2.2–2.4), we combine
model (Section them
3.1). This to describe
allows the entire
an estimation wheel
of SWCs andand conduct
SVCs of thean
wheel, thus
evaluation enabling
of the wheel amodel
quantification of the
(Section 3.1). SVC
This on theaninstallation
allows estimationspace at the
of SWCs andfront
SVCsaxle
of (Section
the wheel,
3.2).
thus enabling a quantification of the SVC on the installation space at the front axle (Section 3.2).
Figure1.1.Overview
Figure Overviewof
ofthe
the subcomponent models,based
subcomponent models, basedon
onReferences
References[17,18].
[17,18].
2.1. Employed Databases and Methods
2.1. Employed Databases and Methods
Due to the limited number of BEVs, it is necessary to include hybrid (HEVs) and plug-in hybrid
Due to the limited number of BEVs, it is necessary to include hybrid (HEVs) and plug-in hybrid
vehicles (PHEVs) in the database. To ensure a homogeneous and up-to-date state of technology,
vehicles (PHEVs) in the database. To ensure a homogeneous and up-to-date state of technology, we
weconsider
consideronlyonlyvehicles
vehicles built
built between
between 2010
2010 andand
2019.2019.
ToTo
derive thethe
derive parametric
parametric models
modelsforfor
thethe
wheel
wheelcomponents,
components, weweemploy
employ two
twodatabases:
databases: A2Mac1
A2Mac1 [19]
and the catalog of the Allgemeine Deutsche Automobil-Club (ADAC) [20].
[19] and the catalog of the Allgemeine Deutsche Automobil-Club (ADAC) [20]. A2Mac1 is an A2Mac1 is an automotive
benchmarking service providerservice
automotive benchmarking and offers preciseand
provider and offers
detailed component
precise and documentation
detailed component for the
vehicles of leadingfor
documentation manufacturers.
the vehicles of The ADAC
leading is Europe’s The
manufacturers. largest
ADACautomobile
is Europe'sclub [20], and
largest its online
automobile
catalog offers an extensive database with 96 current and discontinued brands and
club [20], and its online catalog offers an extensive database with 96 current and discontinued brands a complete list of
their
andvehicles.
a completeThelist
catalog assigns
of their a map
vehicles. to catalog
The each vehicle,
assignswhich
a mapcontains
to eachinformation
vehicle, whichon the overall
contains
information
vehicle level. on the overall vehicle level.
WeWe usethe
use theA2Mac1
A2Mac1 database
databasetotoacquire
acquiredata regarding
data regardingthe dimensions
the dimensionsand weights of the wheel
and weights of the
components. For the modeling of these components, a required variable is the
wheel components. For the modeling of these components, a required variable is the vehicle weight.vehicle weight. In this
In paper, we distinguish
this paper, we distinguishbetween vehicle
between curb weight
vehicle (VCW)(VCW)
curb weight and vehicle gross weight
and vehicle (VGW).(VGW).
gross weight The
Thedifference
difference between
between thethe
twotwoterms is explained
terms below.
is explained In theInautomotive
below. sector,sector,
the automotive the terms
the weight and
terms weight
andvehicle
vehicle weight
weight areare
established
established definitions
definitions[6] [6]
(p.(p.
IV),IV),
which
whichareareused
usedas as
synonyms
synonyms forfor
“mass”.
“mass”.
World Electric Vehicle Journal 2020, 11, 63                                                         4 of 24

Therefore, in the scope of this paper, we employ the term weight when referring to the mass of the
vehicle or one of its components.
      A model series, for example, the Audi e-tron, contains different model variants: quattro, advanced
quattro, and S line Quattro [21]. Each model variant has a different weight, which depends on its
equipment. We dimension the brakes and tires so that they can withstand the weight of the heaviest
model variant of the model series. This ensures that the dimensioned brakes and tires are compatible
with all model variants within the model series. The vehicle models contained in A2Mac1 are not
necessarily the heaviest variant of the model series, and therefore their VCW cannot be used to
dimension the wheel’s components. For this reason, we link each vehicle model of the A2Mac1
database with the corresponding ADAC model series. This step enables us to link the VCW of the
corresponding heaviest model variant to each model documented in A2Mac1. An overview of the
database can be found in Appendix A Tables A1–A3. In the next sections, when referring to the VCW,
we mean the weight of the heaviest model variant of the model series in the vehicle empty state as
defined by Reference [22].
      Following §34 StVZO [23], the VGW is defined as the weight that must not be exceeded, considering
the material stress, engine power, and emergency and long-lasting brake applications. The VGW
is calculated from the sum of the VCW and the maximum vehicle payload, which depends on the
equipment level and, therefore, on the model variant within a single model series. In this paper,
when referring to the VGW, we mean the weight of the heaviest model variant of the model series.
      The following subsections (Sections 2.2–2.5) describe the developed parametric models for
estimating the volume and weight of the wheel components. The content of these subsections is
required to understand the results presented in Section 3.

2.2. Brake Model
      Two types of wheel brakes are used in passenger cars: drum and disc brakes [24] (p. 64). In today’s
vehicles, only front brakes are fitted with disc brakes, and drum brakes are used less often nowadays
for rear-wheel brakes, which often use disc brakes instead [24] (p. 64). Therefore, in this paper, we will
only focus on disc brakes.
      BEVs, PHEVs, and HEVs can recuperate their kinetic energy during deceleration and store it in the
traction battery [25]. During recuperation, the electric machine works like a generator: a deceleration
of up to 0.3 g can be achieved without using the friction brakes [26]. Thus, most car journeys can be
carried out without actuating the wheel brakes. This concept suggests the possibility of downsizing the
brake system, which could reduce weight and costs [26]. However, for safety reasons, BEVs, PHEVs,
and HEVs are tested for braking by using the same criteria as ICEVs [26]. Recuperation is completely
disabled during the performance tests because, when the battery is fully charged or cold, the maximum
regeneration potential is not available [27] (p. 29). The vehicle must always ensure maximum braking
performance [26] under such conditions.
      To provide long-range driving capability, BEVs are equipped with a large battery that can reach a
considerable weight (in the case of the Audi e-tron, almost 700 kg [28]). As a result, BEVs are usually
heavier than ICEVs with comparable exterior dimensions (see Table 1) [29] (p. 8). Moreover, HEVs and
PHEVs are heavier than comparable ICEVs, due to the higher number of required components for
the powertrain. Therefore, to comply with legal requirements, the brakes on these vehicles must be
larger because the kinetic energy is higher compared to that of a similar ICEV traveling at the same
speed [26] (p. 663). Thus, we do not include ICEVs in our database.

2.2.1. Volumetric Model
     For the brake disc dimensions, we derive a linear regression model, which correlates the diameter
of the brake disc (dependent variable) to the vehicle characteristics (independent variables). In order to
identify the vehicle characteristics, which are suitable for modeling the brake disc dimensions, we must
identify the central design focus for dimensioning this component.
World Electric Vehicle Journal 2020, 11, 63 5 of 24
To ensure safe driving, wheel brakes must be able to withstand heavy operating conditions.
An important design criterion for braking systems is the thermal design. The thermal mass of the
brake disc plays an important role in thermal stability: Larger and heavier brake discs have more
heat-storage capacity and cooling properties. They are, therefore, better able to absorb the kinetic
energy of the vehicle that is converted into heat during braking [30] (p. 72). The maximum value of
the kinetic energy is calculated by considering the vehicle VGW mveh max and the maximum attainable
speed vveh max . The VGW and its top speed are, hence, suitable variables for estimating the brake
disc diameter.
The thermal load of the brake discs is also determined by the time it takes to allow the brakes to
cool down between two consecutive brake applications. This amount of time relates to the acceleration
capability of the vehicle. The faster the vehicle can accelerate, the shorter the time available for brake
cooling. This is particularly critical for cases like the AMS consumer test, which tests the braking
performance of the vehicle [31]. For this reason, the acceleration time tveh 0–100 from 0 to 100 km/h is a
suitable vehicle characteristic for modeling the brake disc diameter.
We extract from A2Mac1 the brake disc diameter Dbrake for the vehicles contained in Appendix A
Tables A1–A3. The acceleration time and the VGW are obtained from the ADAC database. We correlate
both variables to the brake disc diameter, thus deriving the linear regression model in Equation (1).
A list of the symbols used in Equation (1) and the following equations can be found in Appendix A
Table A4.
Dbrake = 238.345 mm + (0.053 mm/kg) × mveh max − (5.631 mm/s) × tveh 0-100 (1)
With this variable choice, we can model the thermal load of the vehicle, using the acceleration time,
and the kinetic energy, using the VGW. For the modeling, we only consider ventilated discs, since all
vehicles of the database mount ventilated discs as front brakes. The developed model achieves an R2
of 87.3%, a mean absolute error (MAE) of 9.94 mm. The corresponding normalized mean absolute
error (nMAE) is 3.22%.
2.2.2. Weight Model
The weight of a brake disc is mainly related to its diameter and its thickness. However, our
statistical evaluation showed that the thickness is not a significant variable for weight modeling.
We extract the disc diameter and its weight mbrake for each of the vehicles in Appendix A
Tables A1–A3. The resulting regression model describing the correlation between Dbrake and mbrake is
shown in Equation (2):
mbrake = −12.870 kg + (0.069 kg/mm) × Dbrake (2)
The developed model achieves an R2 of 91.33%, an MAE of 0.52 kg, and an nMAE of 6.42%.
We also model the weight of the brake calipers and brake pads. In both cases, it was not possible
to set up a regression model to link the component’s weight to the vehicle’s characteristics; thus, we use
constant values for the modeling. We extract for the vehicles in Appendix A Tables A1–A3 the weight
values for the front brake calipers and the brake pads from A2Mac1. We derive a mean value of 5.46 kg
for the brake calipers and a standard deviation equal to 1.70 kg. We derive a mean value of 1.02 kg and
a standard deviation of 0.31 kg for the weight of each pair of front brake pads.
2.3. Rim Model
To model the rims, we use the nominal rim diameter, which is specified in inches by the
manufacturer. It is not possible to create an empirical model, which estimates the rim diameter from
dimensions of other components such as the tire diameter. Due to its importance as a design element,
the rim and its dimensions do not depend exclusively on the tire diameter, but rather on the specific
design strategy the manufacturer specifies. Therefore, we choose to use the rim diameter as the
model input.World Electric Vehicle Journal 2020, 11, 63 6 of 24
2.3.1. Minimum Rim Diameter
Since the rim diameter is an input for this model, we do not need to model the rim dimensions.
Nevertheless, it must be guaranteed that the input rim diameter is compatible with the brake disc,
i.e., that no collision occurs between the brake caliper and rim. To model this effect, we derive a
minimum radial clearance, which must be maintained between brake and rim to avoid a collision.
The minimum radial clearance must be calculated, taking as reference the smallest rim offered
in the model series, since this rim size represents the worst-case scenario. However, the vehicles
documented in A2Mac1 are not necessarily the model variant with the smallest rim diameter. Therefore,
we link each model variant of A2Mac1 with the corresponding model series in ADAC and extract
from ADAC the smallest rim diameter offered inside the model series Drim min ADAC . With these data,
we calculate the minimum radial clearance Drim clearance , as shown in Equation (3):
Drim clearance = Drim min ADAC − Dbrake (3)
We calculate the radial clearance for the vehicles in Appendix A Tables A1–A3 and derive a mean
value of 122.24 mm, with a standard deviation of 27.25 mm.
2.3.2. Weight Model
To calculate the rim weight mrim , we develop a regression model, which correlates mrim with the
rim diameter Drim (expressed in inches). Equation (4) shows the resulting linear regression model:
mrim = −13.063 kg + (1.405 kg/inch) × Drim (4)
The model achieves an R2 of 88.48%, an MAE of 0.64 kg, and an nMAE of 5.56%. Initially, we also
tried to employ the rim material (aluminum or steel) as an independent variable, but it was categorized
as statistically irrelevant. The same effect has also been observed by Fuchs [6] (p. 42).
2.4. Tire Model
The European Tire and Rim Technical Organization (ETRTO) defines a tire as a flexible element
made of rubber and reinforcement materials [32] (p. G2). The significant tire parameters are the tire
diameter, Dtire , the nominal aspect ratio, h% , and the section width, wtire , which are described in the
ETRTO manual [32] (pp. G2–G13). In this paper, when referring to the tire diameter, we mean the
outer diameter of the wheel. The tires have a great impact on vehicle design [33], and their diameter
also depends on the design strategy of the individual manufacturer. Thus, we decide to implement the
tire diameter as model input.
2.4.1. Volumetric Model
The volumetric model is implemented as follows: First, the axle load is calculated, thus deriving
the required tire load capacity. Subsequently, the tire volume is estimated, empirically, according to the
required tire load capacity. Finally, using the rim diameter and tire diameter inputs, the empirically
estimated volume is corrected, and the further tire dimensions’ section width and aspect ratio are
derived. The exact implementation of these steps is explained below.
The tire volume, Vtire , is defined as the volume of gas contained between the rim and tire under
pressure. Given the tire diameter, the corresponding volume can be calculated by using Equation (5):
Vtire = 0.25 × π × wtire × (Dtire 2 − Drim 2 ) (5)
To dimension the tire, engineers select the appropriate section width and aspect ratio, which can
provide the air volume needed to support the VGW and is compatible with the desired rim diameter.
Wider tires provide better traction when accelerating: A large contact area helps powerful vehiclesWorld Electric Vehicle Journal 2020, 11, 63 7 of 24
reduce tire slippage when accelerating from standstill and improve acceleration time. Therefore, we set
minimal values for the tire width, depending on the vehicle’s power and drivetrain (front-wheel drive,
rear-wheel drive, or all-wheel drive) according to Reference [34] (p. 22).
The required tire volume depends on the required tire load capacity, which is the maximum load a
tire can carry under specified conditions of use [32] (p. G5) and is coded by the load index. Depending
on the structure of the tire, we need to distinguish between standard and extra-load tires. Tires with
the additional “extra-load” marking are designed for loads and inflation pressures higher than the
standard version [32] (p. G10).
The required tire load capacity depends on the load at the axle. To calculate the axle load and to
select the appropriate tire dimensions, the ETRTO manual defines two loading conditions: the 88% rule
and the 100% rule [32] (pp. P15–P17). The manual further prescribes for each loading condition the
number of passengers aboard and the load stowed in the luggage compartment. Starting with the VCW,
the vehicle must be loaded with the prescribed number of passengers and luggage load, thus yielding
the loaded weight for the 88% rule (m88% ), and the loaded weight for the 100% rule (m100% ).
By applying the described loading conditions and knowing the positions of the rows of seats,
the position of the luggage compartment, and the axle load distribution of the empty vehicle, it is
possible to compute the new axle distribution according to the 100% and 88% rules. We can then
derive the distances lF,88% and lF,100% between the center of mass and the front axle for both load cases.
Finally, by using l to denote the vehicle wheelbase, we can calculate the tire load (in kg) according to
the 88% rule, using Equation (6):
Ltire88% = (m88% × (l − lF, 88% ))/(2 × l × 0.88) (6)
Using the same method, we calculate the tire load for the 100% rule (Equation (7)):
Ltire100% = (m100% × (l − lF,100% ))/(2 × l) (7)
For the following tire dimensioning, we consider the loading condition, which generates the
highest tire load. We then derive a regression that correlates the required tire volume (dependent
variable) to the occurring tire load (independent variable). The data needed for this purpose are
collected from the ETRTO manual [32]. The ETRTO lists for every tire contained in the manual
the corresponding volume and the maximum tire load capacity (in kg), which allows us to set up
calculate a regression linking these two variables. For the modeling, we consider all the standard- and
extra-load tires listed in the manual section “Passenger car tires”. The tire volume, VtireSL , allowing a
standard-load tire to carry a given load, Ltire (in kg), is defined by Equation (8):
VtireSL = −13462233.892 mm3 + (87651.102 mm3 /kg) × Ltire (8)
The developed model achieves an R2 of 98.68% and an nMAE of 2.83%. For extra-load tires,
the tire volume is calculated according to Equation (9). The developed model achieves an R2 of 98.82%
and an nMAE of 2.63%:
VtireEL = −13548645.429 mm3 + (77990.623 mm3 /kg) × Ltire (9)
The main drawback of the empirical models in Equations (8) and (9) is that, although they estimate
a minimum required tire volume, they do not ensure that the resulting volume is realistic. In fact,
the tire volume cannot assume arbitrary values, since the tire dimensions have specific proportions
regarding section width and nominal aspect ratio, which are documented in the ETRTO manual.
Regarding the tire section width, the manual prescribes values ranging between 125 and 355 mm.
The tire section width is always expressed as a multiple of five but not ten, with an interval of 10 mm
between two consecutive values. For the nominal aspect ratio, the manual prescribes values between
25% and 80%. The aspect ratio is always expressed as a multiple of five with an interval of 5% betweenWorld Electric Vehicle Journal 2020, 11, 63 8 of 24
two consecutive values. Therefore, the tire volumes resulting from the regression models have to be
corrected to ensure that the volume can be generated from admissible values of tire width and aspect
ratio. Figure 2 shows the correction method, which is divided into three steps.
In the first step (Figure 2), we combine the input rim diameter, Drim (in mm), with every
possible nominal aspect ratio and section width combination and derive the tire diameter, as shown in
Equation (10):
World Electric Vehicle Journal 2020 11, x Dtire = Drim + (2 × wtire × h% )/100 8 of(10)
24
The result is a tire diameter matrix (Figure 2) containing all the possible diameters that are
The result is a tire diameter matrix (Figure 2) containing all the possible diameters that are
compatible with the input rim size. From this matrix, we use Equation (5) to derive the matrix for the
compatible with the input rim size. From this matrix, we use Equation (5) to derive the matrix for the
corresponding volumes (volume matrix, Figure 2).
corresponding volumes (volume matrix, Figure 2).
In the second step (Figure 2), the diameter and volume matrices are compared with the input
In the second step (Figure 2), the diameter and volume matrices are compared with the input
tire diameter and the minimum tire volume from Equations (8) and (9). Based on this comparison,
tire diameter and the minimum tire volume from Equations (8) and (9). Based on this comparison,
we generate two matrices that describe the percentual deviation from the single elements of the
we generate two matrices that describe the percentual deviation from the single elements of the
diameter
diametermatrix
matrixor orvolume
volume matrix
matrix to
to the
the input
input tire
tire diameter
diameter oror minimum
minimum tire
tire volume.
volume.
Finally, in the third step (Figure 2), we choose from the two deviation matrixes
Finally, in the third step (Figure 2), we choose from the two deviation matrixes thethe
tiretire
that hashas
that the
smallest deviation from the calculated volume and the desired diameter. This results in the
the smallest deviation from the calculated volume and the desired diameter. This results in the final final values
for the tire
values fordiameter and volume,
the tire diameter and as well asasthe
volume, aspect
well ratio
as the and width.
aspect After
ratio and this step,
width. Afterthe thisdimensions
step, the
ofdimensions
the tire areoffully defined.
the tire are fully defined.
Figure 2.
Figure 2. Overview
Overview of
of the
the correction
correction method
method for
for the
thetire
tiredimensions.
dimensions.
2.4.2. Weight Model
For the weight analysis, we implement a regression model that estimates the tire weight, mtire,
based on the tire diameter and its section width. The regression is derived from the evaluation of the
vehicles in Appendix Tables A1–A3 and shown in Equation (11):
mtire = −16.890 kg + (0.023 kg/mm) × Dtire + (0.054 kg/mm) × wtire (11)
The developed model has an adjusted R2 of 85.85%, an MAE of 0.71 kg, and an nMAE of 6.63%.World Electric Vehicle Journal 2020, 11, 63 9 of 24
2.4.2. Weight Model
For the weight analysis, we implement a regression model that estimates the tire weight,
mtire , based on the tire diameter and its section width. The regression is derived from the evaluation of
the vehicles in Appendix A Tables A1–A3 and shown in Equation (11):
mtire = −16.890 kg + (0.023 kg/mm) × Dtire + (0.054 kg/mm) × wtire (11)
The developed model has an adjusted R2 of 85.85%, an MAE of 0.71 kg, and an nMAE of 6.63%.
2.5. Wheelhouse Model
Given the tire dimensions, we can estimate the wheelhouse dimensions. In this paper, we focus
on the wheelhouse width, wwheelhouse . Given the wheelhouse width, the position of the side roll rail
canWorld
be identified.
Electric VehicleThen, knowing
Journal 2020 11, x the vehicle width at the front axle (W106) and the width of the side
9 of 24
roll rail wsrr , we estimate the available space at the front axle, wavailable , as shown in Equation (12):
be identified. Then, knowing the vehicle width at the front axle (W106) and the width of the side roll
rail wsrr, we estimate the availablew space at the front
= (W106 − 2 ×axle,
w wavailable, +
asw
shown
srr )
in Equation (12): (12)
available wheelhouse
wavailable = (W106 − 2 × wwheelhouse + wsrr) (12)
In the further steps of the product specification, wavailable can be compared with the actual space
required In by
the the
further steps of the
powertrain product specification,
components, wavailable
wrequired , to test the canvehicle
be compared with
concept the actualFigure
feasibility. space 3
required by the powertrain components, wrequired, to test the vehicle concept feasibility. Figure 3
illustrates the above-cited measures.
illustrates the above-cited measures.
Figure 3. Overview of the relevant measures at the front end of the vehicle, based on Reference [3].
Figure 3. Overview of the relevant measures at the front end of the vehicle, based on Reference [3].
In the later sections, we consider the wsrr as constant, since our focus is on the wheelhouse
In the later sections, we consider the wsrr as constant, since our focus is on the wheelhouse
dimensions. A change in the wheel dimensions leads to a variation of wwheelhouse , which depends
dimensions. A change in the wheel dimensions leads to a variation of wwheelhouse, which depends on
on the tire diameter, the tire section width, and the maximum wheel steering angle, δmax . If we
the tire diameter, the tire section width, and the maximum wheel steering angle, δmax. If we simplify
simplify the model by assuming that the wheel steers at its center (located at the half of the tire width),
the model by assuming that the wheel steers at its center (located at the half of the tire width), the
thewheelhouse
wheelhouse width
width cancan
be be derived
derived according
according to Equation
to Equation (13):(13):
wwheelhouse = 0.5=×0.5
wwheelhouse w×tirew× × cos
tirecos δmax++0.5
δmax 0.5 ×× Dtire
tire××sin
sinδmax
δmax + 0.5
+ 0.5 × w×
tirew
tire (13)
(13)
The δmax is usually reached when driving slowly or during parking. For this scenario, we assume
The δmax is usually reached when driving slowly or during parking. For this scenario, we assume
an Ackermann characteristic for the steering [35] (pp. 379–380). The inner wheel steering angle is
analways
Ackermann
biggercharacteristic
than that of for
the the steering
outer wheel [35]
and (pp.
thus 379–380).
determinesThe
theinner
widthwheel steering
of the angle is
wheelhouse.
always bigger than that of the outer wheel and thus determines the width of the wheelhouse. Therefore,
Therefore, in Equation (14), we can estimate the δmax from the vehicle turning radius (Rturning),
wheelbase (L101), front overhang (L104), maximum width (W103), and track width (W101):
δmax = atan(L101/(–W103 × 0.5 + (Rturning2 − (L101 + L104)2)0.5 − W101 × 0.5)) (14)
By combining the result of Equation (14) with the wheel dimensions (Section 2.4), it is possible
to estimate the wheelhouse width using Equation (13).World Electric Vehicle Journal 2020, 11, 63 10 of 24
in Equation (14), we can estimate the δmax from the vehicle turning radius (Rturning ), wheelbase (L101),
front overhang (L104), maximum width (W103), and track width (W101):
δmax = atan(L101/(-W103 × 0.5 + (Rturning 2 − (L101 + L104)2 )0.5 − W101 × 0.5)) (14)
By combining the result of Equation (14) with the wheel dimensions (Section 2.4), it is possible to
estimate the wheelhouse width using Equation (13).
3. Model Evaluation and Results
In the first part of this section, we carry out an evaluation based on a vehicle database, to assess
the accuracy of the wheel model. In the second section, we apply a parameter variation to the model in
order to quantify the SWC on the wheel and SVC on the wheel and on the vehicle.
3.1. Model Evaluation
To model the SVCs, the accuracy of the estimation of the tire volume and the tire width must be
tested. To reach this scope, we first need to create an evaluation database.
We set up the evaluation database, using A2Mac1, ADAC, and the ETRTO manual. We extract
from the A2Mac1 database the following information: vehicle axle distribution, the position of the
rows of seats, position of the luggage compartment, and the tire load index. The ETRTO manual lists
every available tire dimension and the related load indexes. Therefore, using the load indexes, we link
the A2Mac1 database with the ETRTO manual, thus identifying which model variants of the A2Mac1
database mount a standard and which an extra load tire. We further link the A2Mac1 models with the
corresponding model series in ADAC, thus identifying the VCW of the heaviest model variant for each
A2Mac1 model and the exact dimensions of the tires. It was not possible to conduct the above-cited
linking for all the vehicles of Appendix A Tables A1–A3 because some information was missing for
some vehicles, or no ADAC model series could be found. Appendix A Table A5 shows an overview of
the evaluation database.
To evaluate the tire volume model, we assign as inputs the vehicle empty axle load, the tire diameter,
the rim diameter, the vehicle’s outer dimensions, the VCW, and the vehicle payload. With these
inputs, we calculate the VGW for each vehicle of the database. We then calculate the tire load as in
Equations (6) and (7), using the positions of the row of seats and the luggage compartment. We suppose
that the axle distribution for the heaviest model variant corresponds to the axle distribution given
in A2Mac1. Subsequently, we estimate the required tire volume according to the mounted tire type,
using Equations (8) and (9). Finally, we conduct the correction method shown in Figure 2. The results
are presented in Figure 4.
The X-axis in Figure 4 presents the tire volume resulting from the model, and the Y-axis shows the
real tire volume. The resulting estimation has an R2 of 91.0%. For most of the vehicles, the volume is
slightly underestimated. This depends on the fact that the different manufacturers use safety factors,
dimensioning the tire by using loads, which are higher than the real load. With this strategy, it is
possible to compensate for weight estimation errors that can occur in the later specification phase.
The volume is overestimated for the BMW 5-Series, the Jaguar I-Pace, and the Kia Niro. Regarding the
BMW and the Kia, the error can be attributed to slightly inaccurate load-distribution data, which lead
to an overestimation of the required tire volume. The reason for overestimating the Jaguar is explained
in the tire-model-width-evaluation section.is slightly underestimated. This depends on the fact that the different manufacturers use safety
factors, dimensioning the tire by using loads, which are higher than the real load. With this strategy,
it is possible to compensate for weight estimation errors that can occur in the later specification phase.
The volume is overestimated for the BMW 5-Series, the Jaguar I-Pace, and the Kia Niro. Regarding
the BMW and the Kia, the error can be attributed to slightly inaccurate load-distribution data, which
Worldlead
Electric Vehicle
to an Journal 2020, 11,
overestimation of63
the required tire volume. The reason for overestimating the Jaguar is 11 of 24
explained in the tire-model-width-evaluation section.
80 Cayenne (9YA)
X5 (F15)
75 Outlander (III) Plug-In
70 XC90 (L)
C-HR (X10)
65 RAV4 (XA5) e-tron (GE)
60 Ampera-E
Kona (OS) Elektro
Real tire volume in l
I-Pace (X590)
55 IONIQ (AE) Hybrid XC60 (U)
50
Auris (E18) 5er-Reihe (G30) Limousine
45
40 Golf (VII) e-Golf 2er-Reihe (F45) Active Tourer
35 Prius (XW3) Plug-In i3
30
up! e-up! Leaf (ZE1)
25
20 Niro (DE)
15 Zoe Prius (XW5) Plug-In
10
10 15 20 25 30 35 40 45 50 55 60 65 70 75 80
Calculated tire volume in l
Figure4.4. Whole-model
Figure Whole-model plot
plotfor the
for tire-volume
the evaluation.
tire-volume evaluation.
We Weuseusethethe
samesame database
databasetoto evaluate the precision
evaluate the precisionofofthethetiretire width
width estimation.
estimation. Our wheel
Our wheel
model calculates the tire dimensions that fulfill the conditions given on the required
model calculates the tire dimensions that fulfill the conditions given on the required tire diameter, thetire diameter,
the calculated
calculated tire volume,
tire volume, and theand the desired
desired rim diameter,
rim diameter, accordingaccording to the method
to the method described
described in 2.4.1.
in Section
Section 2.4.1. The tire width is calculated for each vehicle listed in Appendix Table
The tire width is calculated for each vehicle listed in Appendix A Table A5 and compared with the A5 and compared
World Electric Vehicle Journal 2020 11, x 11 of 24
real values (Figure 5). The tire width model achieves a R2 of 77.0%. The tire width is overestimated
with
for the BMW the real
5-ervalues
(G30),(Figure 5). The
the Jaguar tire (X590),
I-Pace width model
and theachieves
Kia Niroa R(DE).
2 of 77.0%. The tire width is
The slightly overestimated
overestimated
tire volume leads for theoverestimated
to an BMW 5-er (G30), thewidth
tire Jaguarfor
I-Pace (X590),and
the BMW and the
the Kia
Kia.Niro
The(DE). The slightly
required tire volume
overestimated tire volume leads to an overestimated tire width for the BMW and the Kia. The
would be estimated correctly for the Jaguar; however, the calculated value for the tire width of 265 mm
required tire volume would be estimated correctly for the Jaguar; however, the calculated value for
is higher than the real one (245 mm). This result is caused by the constraint on the minimal tire width,
the tire width of 265 mm is higher than the real one (245 mm). This result is caused by the constraint
which is set equal to 255 mm due to the high power of this car’s drivetrain. For the same reason,
on the minimal tire width, which is set equal to 255 mm due to the high power of this car’s drivetrain.
the resulting volume
For the same is also
reason, overestimated.
the resulting volume is also overestimated.
325
315 Outlander (III) Auris (E18) X5 (F15)
305 Plug-In
Cayenne (9YA)
295 Leaf (ZE1)
XC90 (L)
285
275 Ampera-E
Real tire width in mm
e-tron (GE)
265
255 Kona (OS) Elektro XC60 (U)
C-HR (X10)
245 I-Pace (X590)
235 RAV4 (XA5)
225
5er-Reihe (G30) Limousine
215 Golf (VII) e-Golf
205 Prius (XW3) Plug-In
195
i3
185 Niro (DE)
Zoe
175
IONIQ (AE) Hybrid 2er-Reihe (F45) Active Tourer
165
155 up! e-up! Prius (XW5) Plug-In
145
145 155 165 175 185 195 205 215 225 235 245 255 265 275 285 295 305 315 325
Calculated tire width in mm
Figure5.5.Whole-model
Figure Whole-model plot
plotfor
forthe
thetire-width evaluation.
tire-width evaluation.
Another cause
Another of of
cause deviations
deviationsfrom
fromthethe real tirewidth
real tire widthvalues
values is that
is that ourour model
model calculates
calculates the tire
the tire
dimensions
dimensions onlyonly in dependency
in dependency on theon vehicle
the vehicle
weightweight and power
and power withoutwithout considering
considering lateral
lateral dynamic
dynamic requirements.
requirements. We do not We have doenough
not havedataenough data tothe
to model model the dynamic
lateral lateral dynamic requirements;
requirements; therefore,
therefore, we cannot consider
we cannot consider this influence. this influence.
3.2. Quantification of the Secondary Effects on the Wheel Components
In this section, we apply the wheel model to four reference vehicles, each belonging to a different
segment. We intend to evaluate the SVCs and SWCs resulting from a stepwise increase in the VCW,
which is denoted in the following sections as the PWC. The reference vehicles are shown in Table 2;World Electric Vehicle Journal 2020, 11, 63 12 of 24
3.2. Quantification of the Secondary Effects on the Wheel Components
In this section, we apply the wheel model to four reference vehicles, each belonging to a different
segment. We intend to evaluate the SVCs and SWCs resulting from a stepwise increase in the VCW,
which is denoted in the following sections as the PWC. The reference vehicles are shown in Table 2;
the data are collected from the ADAC catalog. Table 2 shows the initial VCW and the tire and rim
diameter, which are simulated. The further vehicle data required for implementing Equations (12) to (14)
are collected from the A2Mac1 database and are not shown in the table.
Table 2. Reference vehicles used for analyzing secondary effects on the wheel components.
Vehicle Model Min–Max Diameter Mean Outer
Initial VCW
(Model Series) Rim Variants Tire Diameter
Renault Zoe 22 kWh
1547 kg 16”–17” 621 mm
(Zoe (06/13-09/19))
Nissan Leaf 40 kWh
1580 kg 16”–17” 640 mm
(Leaf (ZE1) (from 01/18))
Audi e-tron 55 quattro
2565 kg 19”–21” 765 mm
(e-tron (GE) (from 03/19))
Jaguar I-Pace
2208 kg 18”–22” 759 mm
(I-Pace (X590) (from 10/18))
VCW = vehicle curb weight.
Regarding the tire diameter, it can vary of a few mm inside a model series, depending on the
chosen rim. For the simulation, we take for each reference vehicle the mean value of all the offered tire
diameter of the corresponding model series. Therefore, our method dimensions the tire so that the
resulting diameter is as close as possible to the diameter shown in Table 2.
In our analysis, we dimension the tires considering the maximum rim size inside of the model
series (Table 2). If the diameter is kept constant, a bigger rim reduces the tire sidewall and requires a
wider tire to fulfill the volume requirement. Furthermore, the wheel equipped with the biggest rim
is the heaviest wheel variant. Therefore, focusing on the maximum rim size allows us to consider
the worst-case scenario for both volume and weight analysis. Nevertheless, the minimum rim size
cannot be ignored, since the more the PWC increases, the bigger the brake disc diameter becomes,
which could cause incompatibility between the minimum rim size and the brake disc. We discuss this
subject in the next section.
We do not consider the limitation on the minimal tire width, due to the vehicle’s power
(Section 2.4.1), in order to highlight the effects of the weight increase alone.
We subdivide the quantification of the secondary effects in four steps. In the first step (Section 3.2.1),
we analyze the influence of the PWC on the wheel volume, thus quantifying the SVC of the wheel.
In the second step (Section 3.2.2), we quantify the influence of the PWC on the wheel, thus estimating
the SWC. In the third step (Section 3.2.3), we combine the SVC of the wheel with the wheelhouse
model (Section 2.5) and the dimensional chain presented in Equation (12) and Figure 3. This allows an
estimation of the SVC on the wavailable (Section 2.5). Finally, in the last step (Section 3.2.4), we invert
Equation (12) to simulate a strategy, where the SVC of the wheel is compensated by increasing the
vehicle width.
3.2.1. Influence on the Wheel Volume (SVC on Component Level)
An increased PWC leads to a greater tire load, which requires a redesign of the tire, thus affecting
its volume (Figure 6). The X-axis in Figure 6 represents the PWC (in %) with respect to the initial VCW.
For example, for the Audi e-tron, a PWC of 5% with respect to the initial VCW of 2565 kg (see Table 2)
corresponds to a weight increase of approximately 128 kg. The steps in Figure 6 represent the points
where the PWC requires a redesign of the tire, i.e., causes a SVC.World Electric Vehicle Journal 2020, 11, 63 13 of 24
As the model also dimensions the brake disc sizes (Section 2.2.1), we can test if the smallest
rim size offered for the vehicles of Table 2 has enough radial clearance from the brake disc. This is
particularly interesting for the case of the Audi e-tron. The increment of the brake disc diameter caused
by a PWC of approximately 0.7% (corresponding to a VCW increase of 17 kg) causes an incompatibility
with the given minimum rim size of 19”, as the minimum radial clearance (see Equation (3)) is not
fulfilled. To overcome this problem, we distinguish between two possible strategies.
In the first strategy (Audi e-tron 55, two rim variants), the rim size of 19” is simply excluded from
the model series, which means that the customer can configure the vehicle with only two rim sizes
(20” and 21”). With this strategy, the minimum rim size changes to 20”, thus avoiding the collision
between the brake disc and rim. The tire volume does not have to be changed until a PWC of around
8% (Figure 6). The maximum rim size remains unchanged (21”).
In the second strategy (Audi e-tron 55, three rim variants), we impose the requirement that,
despite the unfulfilled radial clearance, the vehicle must be configurable by using three rim variants.
Such a strategy could be imposed for design reasons or to offer a high product range to the customer.
Therefore, since the 19” rim is incompatible with the brake disc after a PWC of 0.7%, it is necessary
to start from a minimum rim of 20” and also offer the variants 21” and 22”, shifting the maximum
rim size from 21” to 22”. Increasing the maximum rim diameter leads to a decrease in tire volume
(because the tire diameter remains constant), which requires a change of the tire section width and
nominal aspect ratio in order to comply with the minimum volume requirement. In this particular case,
it is World
possible to find a section width and aspect ratio combination that comes closer to the13minimum
Electric Vehicle Journal 2020 11, x of 24
required volume than the previous one, which explains the slight volume reduction at 0.7% (Figure 6).
Nevertheless,
0.7% (Figure this
6).tire combination
Nevertheless, thishas
tire acombination
greater sectionhas awidth
greaterthan the width
section initialthan
one.theThe effects
initial one.caused
Theredesign
by this effects caused by this in
are shown redesign
Section are shown in Section 3.2.3.
3.2.3.
Regarding
Regarding thethe other
other vehicles,the
vehicles, thesame
sameeffect
effect as
as the
the Audi
Audie-tron
e-tronoccurs
occursalso
alsoforfor
thethe
Nissan
NissanLeafLeaf at
at a PWC of around 6.5% (corresponding to a weight increase of 102 kg). For
a PWC of around 6.5% (corresponding to a weight increase of 102 kg). For the sake of simplicity, we do the sake of simplicity,
we do not distinguish between two cases for this vehicle and suppose that a strategy corresponding
not distinguish between two cases for this vehicle and suppose that a strategy corresponding to the
to the “Audi e-tron 55, three rim variants” is applied, i.e., the number of offered rim variant does not
“Audi e-tron 55, three rim variants” is applied, i.e., the number of offered rim variant does not change.
change.
TheThe
remaining
remaining volume
volume changes,
changes,such
suchasasthethestep
step atat 5.2% for the
5.2% for theRenault
RenaultZoeZoeororthe
the step
step at at 5.8% for
5.8%
the Jaguar
for the I-Pace,
Jaguar are caused
I-Pace, by an increase
are caused of the tire
by an increase section
of the width, which
tire section width, is required
which to compensate
is required to
for the increase for
compensate of the increase
minimum required
of the minimum tirerequired
volume.tire volume.
70
65
60
55
Calculated tire volume in l
50
45
40
35
30
25
20 Renault Zoe 22 kWh
15 Nissan Leaf 40 kWh
10 Jaguar I-Pace EV 400
Audi e-tron 55, three rim variants
5
Audi e-tron 55, two rim variants
0
0 1 2 3 4 5 6 7 8 9 10
PWC (VCW increase) in %
Figure 6. Interdependency
Figure 6. Interdependencybetween
between secondary volume
secondary volume change
change (SVC)
(SVC) of the
of the wheel
wheel andprimary
and the the primary
weight change
weight (PWC).
change (PWC).
3.2.2. Influence on the Wheel Weight (SWC on Component Level)
For each PWC, we recalculate the dimensions of the brake disc (Section 2.2.1), rim (Section 2.3.1),
and tire (Section 2.4.1). The hereby calculated dimensions can be further employed for the weight
models of Sections 2.2.2, 2.3.2, and 2.4.2, thus allowing an estimation of the total wheel weight. Figure
7 shows the SWC of the wheel caused by the PWC.World Electric Vehicle Journal 2020, 11, 63 14 of 24
3.2.2. Influence on the Wheel Weight (SWC on Component Level)
For each PWC, we recalculate the dimensions of the brake disc (Section 2.2.1), rim (Section 2.3.1),
and tire (Section 2.4.1). The hereby calculated dimensions can be further employed for the weight
models of Section 2.2.2, Section 2.3.2, and Section 2.4.2, thus allowing an estimation of the total wheel
World Electric Vehicle Journal 2020 11, x 14 of 24
weight. Figure 7 shows the SWC of the wheel caused by the PWC.
Figure 7. Interdependency between SWC of the wheel and PWC.
Figure 7. Interdependency between SWC of the wheel and PWC.
The small steps are related to an increase of the brake disc diameter, while the bigger ones are
The small steps are related to an increase of the brake disc diameter, while the bigger ones are
caused by an increase of the tire width. The great SWC at 0.7% for the strategy “Audi e-tron three
caused by an increase of the tire width. The great SWC at 0.7% for the strategy “Audi e-tron three rim
rim variants” results from the change in the maximum rim size needed to offer the same number of
variants” results from the change in the maximum rim size needed to offer the same number of rim
rim variants: Both the weights of tire and rim change significantly. Figure 7 shows how limiting the
variants: Both the weights of tire and rim change significantly. Figure 7 shows how limiting the
maximum rim diameter on the Audi e-tron to 21” allows a wheel weight reduction of approximately
maximum rim diameter on the Audi e-tron to 21” allows a wheel weight reduction of approximately
3 kg (for a VCW increase of 6%) with respect to the 22” variant. Reducing the number of rim variants
3 kg (for a VCW increase of 6%) with respect to the 22” variant. Reducing the number of rim variants
from two to one would also avoid the step at 6.5% for the Nissan Leaf.
from two to one would also avoid the step at 6.5% for the Nissan Leaf.
In conclusion, if we do not consider the cases of the Audi e-tron and the Nissan Leaf, where the
In conclusion, if we do not consider the cases of the Audi e-tron and the Nissan Leaf, where the
rim size must be changed, we can conclude that the SWC caused by a PWC of 6% is comprised in a
rim size must be changed, we can conclude that the SWC caused by a PWC of 6% is comprised in a
range between 0.5 and 1.5 kg per wheel. If we further assume that the vehicles mount the same wheel
range between 0.5 and 1.5 kg per wheel. If we further assume that the vehicles mount the same wheel
components at the front and rear axles, this corresponds to a total SWC between 2 and 6 kg.
components at the front and rear axles, this corresponds to a total SWC between 2 and 6 kg.
3.2.3. Influence on the wavailable (SVC on Vehicle Level)
3.2.3. Influence on the wavailable (SVC on Vehicle Level)
The outer tire diameter is an input of the model and remains constant regardless of PWC.
The outer rim
The maximum tire diameter
diameteralsois anremains
input ofconstant
the model and as
as long remains constant
no collision regardless
between of PWC.
the brake The
disc and
maximum rim diameter also remains constant as long as no collision between the brake
base rim occurs. Therefore, to compensate for the volume increase shown in Section 3.2.1, the tire must disc and base
rim occurs. become
necessarily Therefore, to compensate
wider. A change in forthe
thetire
volume increase
dimensions shown
leads to a in Section of
variation 3.2.1,
the the tire must
wheelhouse
necessarily become wider. A change in the tire dimensions leads to a variation of
width as shown in Section 2.5 and Equation (13). Figure 8 shows the increase of wheelhouse width in the wheelhouse
width
mm, as shown
using in Section
the initial 2.5 andwidth
wheelhouse Equation (13). Figure 8 shows the increase of wheelhouse width in
as reference.
mm, using the initial wheelhouse width as reference.World ElectricVehicle
World Vehicle Journal2020
2020, 11,x 63 15 of2424
World Electric
Electric Vehicle Journal
Journal 2020 11,
11, x 15
15 of
of 24
55
55 Renault
Renault Zoe
Zoe 22
22 kWh
kWh
50 Nissan
Nissan Leaf 40 kWh
Leaf 40
mm
50 kWh
inmm
Jaguar
Jaguar I-Pace
I-Pace EV
EV 400
400
45
45 Audi
Audi e-tron
e-tron 55,
55, three
three rim
rim variants
widthin
variants
wheelhousewidth
40 Audi
Audi e-tron 55, two rim variants
e-tron 55, two rim variants
40
35
35
thewheelhouse
30
30
25
25
20
20
ofthe
15
Increaseof
15
Increase
10
10
55
00
00 11 22 33 44 55 66 77 88 99 10
10
PWC
PWC (VCW increase) in %
(VCW increase) in %
Figure 8. Interdependency between wheelhouse width and PWC.
Figure
Figure 8.
8. Interdependency
Interdependency between
between wheelhouse
wheelhouse width
width and
and PWC.
PWC.
Finally, using the results shown in Figure 8, we evaluate the variation of wavailable caused by
Finally,
Finally, using
using the
thetoresults
results shown
shown in
in Figure
Figure 8,
8, we
we evaluate
evaluate the variation
thedepicted
variationin of w available caused
ofEquation
wavailable caused by
by the
the
the PWC. We apply the four vehicles the dimensional chain (12). For this
PWC.
PWC. We apply
We apply to the
to the four
fourthe vehicles
vehicles the dimensional
the dimensional chain depicted
chaincaused
depicted in Equation
in PWC,
Equation (12).
(12). For this
For this
calculation, we only model wheelhouse width variation by the while keeping the
calculation,
calculation, we only
weandonly model
model the
the wheelhouse
wheelhouse width
width variation
variation caused
caused by by the
the PWC,
PWC, while while keeping
keeping the
the
values W106 wsrr constant. Figure 9 shows the loss, in percentage, of w available , using the initial
values
values W106
W106 and
and w srr constant.
wsrr constant. Figure
Figure 99 shows
shows the the loss,
loss, in
in percentage,
percentage, of of w available,, using
wavailable using the
the initial
initial
wavailable as reference.
w
wavailable
available as
as reference.
reference.
For the reference vehicles, a PWC of approximately 6% leads to a loss in wavailable of up to 12%.
For
For the reference
thethe
reference vehicles, aa PWC PWC of approximately 6% leads to
to aanumber
loss
loss in w available of
of up
up totois12%.
Regarding Nissanvehicles,
Leaf, it is clearly of approximately
shown that keeping 6%the leads
same in of
wavailable
rim variants 12%.
not a
Regarding
Regarding the
the Nissan
Nissan Leaf,
Leaf, it
it is
is clearly
clearly shown
shown that
that keeping
keeping the
the same
same number
number of
of rim
rim variants
variants is
is not
not aa
good strategy, since it can lead to a loss in wavailable greater than 10%. Limiting the Audi e-tron number
good
good strategy,
strategy, since it can lead to a loss in w greater than 10%. Limiting the Audi e-tron number
variantssince it can
canlead to aloss
lossofinapproximately
wavailable greater6%than 10%. Limiting theaAudiPWCe-tron abovenumber
available
of rim to two avoid at the front end (for 8%).
of
of rim
rim variants
variants toto two
two cancan avoid
avoid loss
loss of
of approximately
approximately 6% 6% atat the
the front
front end
end (for
(for aa PWC
PWC above above 8%).
8%).
13
13
Renault
Renault Zoe
Zoe 22
22 kWh
kWh
12
12
Nissan
Nissan Leaf 40 kWh
Leaf 40 kWh
11
11 Jaguar
Jaguar I-Pace
I-Pace EV
EV 400
400
10
10 Audi
Audi e-tron
e-tron 55,
55, three
three rim
rim variants
variants
99 Audi e-tron 55, two rim variants
Audi e-tron 55, two rim variants
%
in%
88
lossin
availableloss
77
66
wavailable
55
w
44
33
22
11
00
00 11 22 33 44 55 66 77 88 99 10
10
PWC
PWC (VCW
(VCW increase)
increase) in
in %
%
Interdependency betweenthe
Figure 9.Interdependency
Figure the SVCatatvehicle
vehicle frontend
end andthe
the PWC.
Figure 9.
9. Interdependency between
between the SVC
SVC at vehicle front
front end and
and the PWC.
PWC.You can also read