Pa#ent blood management et seuils transfusionnels - Arcothova
←
→
Page content transcription
If your browser does not render page correctly, please read the page content below
Pa#ent
  blood
  management
  et

   seuils
  transfusionnels


  Raisonnment
  clinique


                         Pr. Dan Longrois,
      Département dʼAnesthésie-Réanimation Chirurgicale
          Hôpital Bichat-Claude Bernard, APHP, Paris
      Université Paris 7, Denis Diderot, Unité INSERM 1148
                       dan.longrois@aphp.fr

Masterclass
  ARCHOTOVA,
  novembre
  2019
Objec
Anciennement


                                 Transfusion


Anémie

                                 CGR


    Seuils
  transfusionnels

  de
  plus
  en
  plus
  bas
  (7g/dL)
Le
  contexte
  actuel
  de

  connaissances/
  décisions


PATIENT
  BLOOD
  MANAGEMENT
Défini
Best Practice & Research Clinical Anaesthesiology 27 (2013) 43–58

                                 Contents lists available at SciVerse ScienceDirect

                             Best Practice & Research Clinical
                                     Anaesthesiology
                          journal homepage: www.elsevier.com/locate/bean

5

Drivers for change: Western Australia
Patient Blood Management Program
(WA PBMP), World Health Assembly
(WHA) and Advisory Committee on
Blood Safety and Availability (ACBSA)
Shannon L. Farmer, Research Fellow, Consultant,
Adjunct Research Fellow, Adjunct Senior
Research Fellow a, b, c, *, Simon C. Towler, FCICM, FANZCA,
FAMA, Staff Specialist Intensive Care, Medical Advisor,
Adjunct Professor a, c, d, e, h, Michael F. Leahy, MB ChB, FRACP,
FRCP, FRCPath, Clinical Professor, Consultant Haematologist.
Director, Clinical Professor in Medicine a, g, f, i, Axel Hofmann,
ME MD, Medical Economist, Consultant,
Adjunct Associate Professor, Visiting Professor a, b, c, j
a
  Patient Blood Management Program Team, Office of the Chief Medical Officer, Western Australia
Department of Health, Perth, Western Australia, Australia
b
  School of Surgery, Faculty of Medicine Dentistry and Health Sciences, University of Western
Australia, Perth, Western Australia, Australia
c
  Centre for Population Health Research, Curtin Health Innovation Research Institute, Curtin University,
Perth, Western Australia, Australia
d
  Intensive Care Unit, Royal Perth Hospital, Perth, Western Australia, Australia
e
  Edith Cowan University, Perth, Western Australia, Australia
f
  Schools of Medicine and Pharmacology, Pathology and Laboratory Medicine, University of Western
Eviter
Un
plan
Hypovolemie/
DiagnosDéfini?!
B#-+:#0! ;;=;;>?! A=;C>?! 9=D>?!
E%#1+,+,'! ;C=;C>?! D=?>?! F=@>?!
71#!G!9!(%0! !
6+:#0! ;;=;;>?! A=;C>?! 9=D>?!
B#-+:#0! ;;=;;>?! A=;C>?! 9=D>?!
!
Les
mécanismes
de
l’anémie
n’interviennent
pas
dans
les
définiQCM N°1 • Parmi les ques
Prévalence
de
l’anémie
pré-‐
opératoire
38.77O
pa11
g/dL;
52
%;
6074)
Anémie
modérée
(>
8
g/dL;
43,9
%;
5124)
Anémie
sévère
(<
8
g/dL;
4.1
%;
477)
Polycythémie
(1,3
%;
500)
Mortalité
  J30

     Complica
Risque
  très
  élevé
  si
  :
  agé;
  ASA
  >
  3
  ou
  4;
  chirurgie
  majeure;
  anémie
  >
  modérée


(
  Hb
  >
  12
  g/dL
  chez
  les
  hommes
  et
  11
  g/dL
  chez
  les
  femmes)
Messages

• L’anémie
  est
  fréquente
  dans
  la
  popula
  au
  seuils
  transfusionnels)

   – L’anémie
  ferriprive
  (fer
  IV/PO,
  EPO,
  délais)
Message
Le
saignement
est
un
facteur
de
risque
de
morbi-‐mortalité
post-‐
opératoires
Il
faut
minimiser
le
saignement
per-‐
opératoire
(acide
tranexamique,
chirurgie,
hémostase
chirurgicale,
normothermie,
etc.)
Message


La
  transfusion
  (de
  CGR)
  est,
  le

plus
  souvent,
  délétère.
  Elle
  est

          parfois
  bénéfique
Problème
  des
  seuils

  transfusionnels
QCM
  3

• Parmi
  les
  proposi
QCM
  4

• Une
  transfusion
  de
  CGR
  par
  excès
  est
  définie

  par
  le
  critère
  suivant
  (une
  ou
  plusieurs

  réponses
  correctes
  possibles)

    – 1.
  Une
  valeur
  d’Hb
  >
  12
  g/dL
  après
  transfusion
  de

      CGR

    – 2.
  Une
  valeur
  d’Hb
  >
  10
  g/dL
  après
  transfusion
  de

      CGR

    – 3.
  Une
  valeur
  d’Hb
  >
  9
  g/dL
  après
  transfusion
  de

      CGR


    – 4.
  Je
  ne
  sais
  pas
QCM
  5

• Les
  seuils
  transfusionnels
  restric
Seuils
  transfusionnels
  de
  CGR


       Pa
new england
The
journal of medicine
established in 1812 october 9, 2014 vol. 371 no. 15
Lower versus Higher Hemoglobin Threshold for Transfusion
in Septic Shock
Lars B. Holst, M.D., Nicolai Haase, M.D., Ph.D., Jørn Wetterslev, M.D., Ph.D., Jan Wernerman, M.D., Ph.D.,
Anne B. Guttormsen, M.D., Ph.D., Sari Karlsson, M.D., Ph.D., Pär I. Johansson, M.D., Ph.D.,
Anders Åneman, M.D., Ph.D., Marianne L. Vang, M.D., Robert Winding, M.D., Lars Nebrich, M.D.,
Helle L. Nibro, M.D., Ph.D., Bodil S. Rasmussen, M.D., Ph.D., Johnny R.M. Lauridsen, M.D., Jane S. Nielsen, M.D.,
Anders Oldner, M.D., Ph.D., Ville Pettilä, M.D., Ph.D., Maria B. Cronhjort, M.D., Lasse H. Andersen, M.D.,
Ulf G. Pedersen M.D., Nanna Reiter, M.D., Jørgen Wiis, M.D., Jonathan O. White, M.D., Lene Russell, M.D.,
Klaus J. Thornberg, M.D., Peter B. Hjortrup, M.D., Rasmus G. Müller, M.D., Morten H. Møller, M.D., Ph.D.,
Morten Steensen, M.D., Inga Tjäder, M.D., Ph.D., Kristina Kilsand, R.N., Suzanne Odeberg-Wernerman, M.D., Ph.D.,
Brit Sjøbø, R.N., Helle Bundgaard, M.D., Ph.D., Maria A. Thyø, M.D., David Lodahl, M.D., Rikke Mærkedahl, M.D.,
Carsten Albeck, M.D., Dorte Illum, M.D., Mary Kruse, M.D., Per Winkel, M.D., D.M.Sci.,
and Anders Perner, M.D., Ph.D., for the TRISS Trial Group* and the Scandinavian Critical Care Trials Group
From the Department of Intensive Care
A BS T R AC T (L.B.H., N.H., L.H.A., U.G.P., N.R., J. Wiis,
J.O.W., L.R., K.J.T., P.B.H., R.G.M., M.H.M.,
BACKGROUND M.S., A.P.), Copenhagen Trial Unit, Center
for Clinical Intervention Research (J. Wetter-
Blood transfusions are frequently given to patients with septic shock. However, the slev, P.W.), and Section for Transfusion
benefits and harms of different hemoglobin thresholds for transfusion have not Medicine (P.I.J.), Rigshospitalet and Uni-
been established. versity of Copenhagen, Copenhagen,
METHODS This
arTable 1. Characteristics of the Trial Patients at Baseline.*
Lower Hemoglobin Higher Hemoglobin
Threshold Threshold
Characteristic (N = 502) (N = 496)
Age — yr
Median 67 67
Interquartile range 57–73 58–75
Male sex — no. (%) 272 (54.2) 259 (52.2)
Chronic cardiovascular disease — no. (%)† 75 (14.9) 66 (13.3)
Chronic lung disease — no. (%)‡ 111 (22.1) 102 (20.6)
Hematologic cancer — no. (%) 39 (7.8) 36 (7.3)
Admission to a university hospital — no. (%) 323 (64.3) 324 (65.3)
Surgery during index hospitalization — no. (%)
Emergency 191 (38.0) 217 (43.8)
Elective 59 (11.8) 53 (10.7)
Source of ICU admittance — no. (%)
Emergency department 90 (17.9) 79 (15.9)
General ward 268 (53.4) 257 (51.8)
Operating or recovery room 113 (22.5) 121 (24.4)
Other ICU 31 (6.2) 39 (7.9)
Source of sepsis — no. (%)§
Lungs 267 (53.2) 259 (52.2)
Abdomen 206 (41.0) 198 (39.9)
Urinary tract 58 (11.6) 61 (12.3)
Soft tissue 59 (11.8) 59 (11.9)
Other 50 (10.0) 47 (9.5)
Positive culture from blood or sterile site 188 (37.5) 160 (32.3)
Interval from ICU admission to randomization — hr
Median 23 20
Interquartile range 7–50 7–43
SAPS II¶
Median 51 52
Interquartile range 42–62 44–64
This
arHemoglobin Threshold for Tr ansfusion in Septic Shock
Table 1. (Continued.)
Lower Hemoglobin Higher Hemoglobin
Threshold Threshold
Characteristic (N = 502) (N = 496)
SOFA score∥
Median 10 10
Interquartile range 8–12 8–12
Renal-replacement therapy — no. (%)** 68 (13.5) 53 (10.7)
Mechanical ventilation — no. (%)†† 345 (68.7) 350 (70.6)
* None of the differences between the two groups were significant (P≥0.05). Additional details regarding baseline char-
acteristics are provided in Table S1 in the Supplementary Appendix. The lower hemoglobin threshold was defined as
a hemoglobin level of 7 g per deciliter or less, and the higher hemoglobin threshold as a hemoglobin level of 9 g per
deciliter or less. ICU denotes intensive care unit.
† Patients were considered to have chronic cardiovascular disease if they had any history of myocardial infarction, sta-
ble or unstable angina pectoris, chronic heart failure (defined as New York Heart Association class III or IV), cerebral
infarction or transitory cerebral ischemia, previous treatment with nitrates, percutaneous coronary intervention, coro-
nary-artery bypass grafting, or noncoronary vascular interventions.
‡ Patients were considered to have chronic lung disease if they had any history of chronic obstructive pulmonary dis-
ease, asthma or other chronic lung disease, or any treatment with a drug indicated for chronic lung disease.
This
arcating more severe organ failure. One variable was missing for 51 patients in the higher-threshold group and for 64 in
the lower-threshold group, so their values were not included here.
** Renal-replacement therapy was defined as therapy for acute or chronic kidney failure at randomization.
†† Mechanical ventilation was defined as invasive or noninvasive ventilation in the 24 hours before randomization.
11
Higher hemoglobin threshold
10
Blood Hemoglobin (g/dl)
9
8
7
Lower hemoglobin threshold
6
0
Base- 1 2 3 4 5 6 7 8 9 10 11 12 13 14 15 16 17 18 19 20 21 22 23 24 25 26 27 28
line
Days since Randomization
Figure 2. Blood Hemoglobin Levels in Patients in the ICU at Baseline and after Randomization.
The graphs show the median daily lowest levels of blood hemoglobin in the lower-threshold group and the higher-
threshold group. Baseline values were the lowest blood hemoglobin level measured in the 24 hours before random-
ization. Day 1 was defined as the time of randomization to the end of that day and lasted a median of 15 hours in
the lower-threshold group and 14 hours in the higher-threshold group. The I bars indicate the 25th and 75th percentiles.
n engl j med 371;15 nejm.org october 9, 2014 1387
This
arThe n e w e ng l a n d j o u r na l of m e dic i n e
Table 2. Primary and Secondary Outcome Measures.*
Lower Hemoglobin Higher Hemoglobin Relative Risk
Outcome Threshold Threshold (95% CI) P Value
Primary outcome: death by day 90 — no./total no. (%) 216/502 (43.0) 223/496 (45.0) 0.94 (0.78–1.09) 0.44†
Secondary outcomes‡
Use of life support — no./total no. (%)§
At day 5 278/432 (64.4) 267/429 (62.2) 1.04 (0.93–1.14) 0.47†
At day 14 140/380 (36.8) 135/367 (36.8) 0.99 (0.81–1.19) 0.95†
At day 28 53/330 (16.1) 64/322 (19.9) 0.77 (0.54–1.09) 0.14†
Ischemic event in the ICU — no./total no. (%)¶ 35/488 (7.2) 39/489 (8.0) 0.90 (0.58–1.39) 0.64∥
Severe adverse reaction — no./total no. (%)** 0/488 1/489 (0.2) — 1.00
Alive without vasopressor or inotropic therapy — 73 75 — 0.93
mean % of days††
Alive without mechanical ventilation — mean % 65 67 — 0.49
of days††
Alive without renal-replacement therapy — mean % 85 83 — 0.54
of days††
Alive and out of the hospital — mean % of days†† 30 31 — 0.89
* CI denotes confidence interval.
† Logistic-regression analyses were adjusted for the stratification variables (study site and presence or absence of hematologic cancer). The
results of the unadjusted outcome analyses are provided in Table S11 in the Supplementary Appendix.
‡ A total of 21 patients — 14 in the lower-threshold group and 7 in the higher-threshold group — did not wish to be included in the follow-
This
arHemoglobin Threshold for Tr ansfusion in Septic Shock
A Time to Death
1.0
0.8
Probability of Survival
Lower hemoglobin threshold
0.6
Higher hemoglobin threshold
0.4
0.2
P=0.41
0.0
0 10 20 30 40 50 60 70 80 90
Days since Randomization
No. at Risk
Lower hemoglobin threshold 502 334 306 286
Higher hemoglobin threshold 496 321 287 273
B Relative Risk of the Primary Outcome
Lower Higher P Value
Hemoglobin This
ar0.0
0 10 20 30 40 50 60 70 80 90
Days since Randomization
No. at Risk
Lower hemoglobin threshold 502 334 306 286
Higher hemoglobin threshold 496 321 287 273
B Relative Risk of the Primary Outcome
Lower Higher P Value
Hemoglobin Hemoglobin for Hetero-
Subgroup Threshold Threshold Relative Risk (95% CI) geneity
no. of events/no. of patients in subgroup
Age 0.85
>70 yr 93/173 98/185 0.98 (0.79–1.18)
≤70 yr 123/329 125/311 0.94 (0.75–1.14)
Chronic cardiovascular 0.25
disease
Yes 42/75 33/66 1.08 (0.75–1.40)
No 174/427 190/430 0.90 (0.75–1.06)
SAPS II at baseline 0.06
>53 112/207 139/226 0.83 (0.64–1.04)
≤53 104/295 84/270 1.10 (0.91–1.30)
All patients 216/502 223/496 0.94 (0.78–1.09)
0.5 0.7 1.0 1.5 2.0
Lower Higher
Hemoglobin Hemoglobin
Threshold Threshold
Better Better
Figure 3. Time to Death and Relative Risk of Death at 90 Days.
Panel A shows the survival curves, with data censored at 90 days, in the two intervention groups in the intention-to-
treat population. Kaplan–Meier analysis showed that the survival time did not differ significantly between the two groups
(P = 0.41 by Cox regression analysis, with adjustment for the stratification variables). Panel B shows the relative risks
(black boxes) with 95% confidence intervals (horizontal lines) for the primary outcome measure of death by day 90 in
the lower-threshold group, as compared with the higher-threshold group, among all the patients and in the three pre-
specified subgroups, as assessed by means of logistic-regression analysis, with adjustment for the stratification vari-
ables. The size of each black box is proportional to the size of the corresponding subgroup. Chronic cardiovascular
disease was defined as any history of myocardial infarction, any history of stable or unstable angina pectoris, previous
treatment with nitrates, percutaneous coronary intervention, coronary-artery bypass grafting or noncoronary vascular
interventions, any history of chronic heart failure (defined as New York Heart Association class III or IV), or any history
of cerebral infarction or transitory cerebral ischemia. The Simplified Acute Physiology Score (SAPS) II25 is calculated
from 17 baseline variables; scores range from 0 to 163, with higher scores indicating higher severity of disease. A total
of 1 or 2 of the 17 variables were missing for 77 patients in the higher-threshold group and for 99 in the lower-threshold
group. In this analysis, these missing variables were considered to be within the normal range, thereby not contributing
to the composite SAPS II of these patients.
n engl j med 371;15 nejm.org october 9, 2014 1389
This
arSeuils transfusionnels Chirurgie cardiaque adulte Pa
new england
The
journal of medicine
established in 1812 March 12, 2015 vol. 372 no. 11
Liberal or Restrictive Transfusion after Cardiac Surgery
Gavin J. Murphy, F.R.C.S., Katie Pike, M.Sc., Chris A. Rogers, Ph.D., Sarah Wordsworth, Ph.D., Elizabeth A. Stokes, M.Sc.,
Gianni D. Angelini, F.R.C.S., and Barnaby C. Reeves, D.Phil., for the TITRe2 Investigators*
a bs t r ac t
BACKGROUND
Whether a restrictive threshold for hemoglobin level in red-cell transfusions, as From the British Heart Foundation, De-
compared with a liberal threshold, reduces postoperative morbidity and health partment of Cardiovascular Sciences,
University of Leicester, and Glenfield
care costs after cardiac surgery is uncertain. General Hospital, Leicester (G.J.M.),
Bristol Heart Institute, School of Clinical
METHODS Sciences, University of Bristol, Bristol
We conducted a multicenter, parallel-group trial in which patients older than 16 years Royal Infirmary, Bristol (K.P., C.A.R.,
N
Engl
J
Mcardiac
of age who were undergoing nonemergency ed
2015;372:997-‐1008.
surgery were recruited from G.D.A., B.C.R.), and Health Economics
Research Centre, Nuffield Department of
17 centers in the United Kingdom. Patients with a postoperative hemoglobin level Population Health, University of Oxford,
of less than 9 g per deciliter were randomly assigned to a restrictive transfusion Oxford (S.W., E.A.S.) — all in the United
Kingdom. Address reprint requests to Dr.
threshold (hemoglobin level£427 ($713) in the libera
Liberal-threshold group Restrictive-threshold group Other cost component
11 to 3 months after surg
groups (£10,636 [$17,76
old group and £10,814
Mean Hemoglobin (g/dl)
10
threshold group) (Tab
tary Appendix).
9
Disc
8
In the TITRe2 trial,
that the use of a rest
7
pared with a liberal t
0
0 1 2 3 4 5 6 7 8 9 10 Final sion of red cells after
Days since Randomization
reading would reduce postoper
No. at Risk We observed no signi
Liberal- ference with respect t
threshold group 994 967 894 773 732 501 405 338 245 204 170 998
Restrictive- outcome. This finding
threshold group 998 971 894 758 713 502 401 303 226 175 147 1003 the possibility that th
quate power, since th
Figure 1. Mean Daily Nadir in Hemoglobin Level. greater than that plann
I bars indicate standard deviations, which were calculated independently at than-expected frequen
each time point. were also no significa
according to hemoglo
fied subgroup analyse
N
Sensitivity
Engl
J
Med
2015;372:997-‐1008.
and Subgroup Analyses sistent with the view t
When additional acute kidney injury events, iden- moglobin in red-cellTable 3. Outcomes.
Restrictive Liberal
Transfusion Threshold Transfusion Threshold
Outcome (N = 1000) (N = 1003) Estimated Treatment Effect
Odds Ratio or
Hazard Ratio
(95% CI) P Value
Serious infection or ischemic event:
primary outcome
Overall 331/944 (35.1) 317/962 (33.0) 1.11 (0.91–1.34)* 0.30
Infectious event† 238/936 (25.4) 240/954 (25.2) 1.02 (0.83–1.26)* 0.83
Sepsis 210/982 (21.4) 214/983 (21.8)
Wound infection 55/921 (6.0) 46/936 (4.9)
Ischemic event 156/991 (15.7) 139/99 (114.0) 1.16 (0.90–1.49)* 0.26
Permanent stroke 15/989 (1.5) 17/985 (1.7)
Myocardial infarction 3/987 (0.3) 4/981 (0.4)
Gut infarction 6/987 (0.6) 1/982 (0.1)
Acute kidney injury 140/989 (14.2) 122/989 (12.3)
Stage 1 49/989 (5.0) 40/989 (4.0)
Stage 2 39/989 (3.9) 35/989 (3.5)
Stage 3 50/989 (5.1) 46/989 (4.7)
Secondary outcomes
No. of hours in ICU or high-
dependency unit‡
Median 49.5 45.9 0.97 (0.89–1.06)§ 0.53
N
Engl
J
Med
2015;372:997-‐1008.
Interquartile range 21.9–99.7 20.1–94.8
No. of days in hospital¶
Median 7.0 7.0 1.00 (0.92–1.10)§ 0.94
Interquartile range 5.0–10.0 5.0–10.0
All-cause mortality at 90 days 42/1000 (4.2) 26/1003 (2.6) 1.64 (1.00–2.67)§ 0.045
Clinically significant pulmonary 127/979 (13.0) 116/982 (11.8) 1.11 (0.85–1.45)* 0.45
complications
All-cause mortality at 30 days 26/1000 (2.6) 19/1003 (1.9)
* This value is an odds ratio.
† Since the amount of missing data was greater than 5% (owing primarily to missing data on posthospital discharge), a
separate treatment estimate was estimated for infections that occurred before hospital discharge (according to the
rules regarding missing data outlined in the statistical analysis plan in the study protocol). For this treatment effect, we
estimated an odds ratio of 1.07 (95% CI, 0.85 to 1.36; P = 0.55).
‡ The duration of stay in the intensive care unit (ICU) or high-dependency unit after randomization was 0 days for 63 pa-
tients in the restrictive-threshold group and 61 patients in the liberal-threshold group; data were censored for 23 pa-
tients in the restrictive-threshold group and 15 patients in the liberal-threshold group. In addition, 37 patients in the re-
strictive-threshold group and 32 patients in the liberal-threshold group had more than one admission to the ICU or
high-dependency unit.
§ This value is a hazard ratio.
¶ The duration of hospital stay after randomization was 0 days for 4 patients in the restrictive-threshold group and 2 pa-
tients in the liberal-threshold group; data were censored for 25 patients in the restrictive-threshold group and 17 pa-
tients in the liberal-threshold group.The n e w e ng l a n d j o u r na l of m e dic i n e
No. of P Value for
Subgroup Patients Restrictive Liberal Odds Ratio (95% CI) Interaction
no. of events/total no. (%)
Surgery type 0.64
CABG 400 77/192 (40.1) 85/208 (40.9) 0.92 (0.61–1.40)
Non-CABG 1487 251/743 (33.8) 229/744 (30.8) 1.17 (0.94–1.46)
Age 0.45
60 1535 246/763 (32.2) 232/772 (30.1) 1.13 (0.90–1.41)
Sex 0.27
Male 583 114/270 (42.2) 129/313 (41.2) 1.01 (0.72–1.42)
Female 1323 217/674 (32.2) 188/649 (29.0) 1.19 (0.94–1.51)
LV function 0.33
Good 1145 218/569 (38.3) 204/576 (35.4) 1.14 (0.89–1.46)
Moderate or poor 761 113/375 (30.1) 113/386 (29.3) 1.04 (0.76–1.42)
0.5 0.67 1.0 1.5 2.0
Restrictive Group Liberal Group
Better Better
Figure 2. Subgroup Analyses.
The gray vertical lines represent the overall treatment estimate (solid line) and the 95% confidence interval (dashed lines) for the prima-
ry outcome as calculated for the entire analysis cohort. The sizes of the circles designating the point estimates reflect the sizes of the
subgroups. The restrictive transfusion threshold for hemoglobin was less than 7.5 g per deciliter, and the liberal transfusion threshold
was less than 9 g per deciliter. CABG denotes coronary-artery bypass grafting, COPD chronic obstructive pulmonary disease, GFR glo-
merular filtration rate, and LV left ventricular.
N
Eanalyses
sisted in sensitivity ngl
J
M ed
2S11015;372:997-‐1008.
(Table in the transfusion before randomization were excluded
Supplementary Appendix), is a cause for con- and one in which additional acute kidney injury
cern. It is not clear in what way anemia that was events, as determined on the basis of serial data
attributable to the restrictive threshold may have on creatinine levels, were included. These find-The n e w e ng l a n d j o u r na l of m e dic i n e
The n e w e ng l a n d j o u r na l of m e dic i n e
Original Article Original Article
ctive or Liberal Red-Cell Transfusion
Restrictive or Liberal Red-Cell Transfusion
for Cardiac Surgery
for Cardiac Surgery
r, R.P. Whitlock, D.A. Fergusson, J. Hall, E. Belley-Cote, K. Connolly,
n, A.J. Gregory, É. de Médicis, S. McGuinness, A. Royse, F.M. Carrier,
C.D. Mazer,
g, J.C. Villar, H.P. Grocott, M.D. Seeberger, S. Fremes,R.P. Whitlock, D.A. Fergusson, J. Hall, E. Belley-Cote, K. Connolly,
F. Lellouche,
Byrne, S.M. Bagshaw, N.C. Hwang,B.C.Khanykin,
Mehta, T.W. Painter, C. Royse, É. de Médicis, S. McGuinness, A. Royse, F.M. Carrier,
A.J. Gregory,
ma, G.M.T. Hare, A. Cohen, K.E. Thorpe, P. Jüni, and N. Shehata,
P.J. Young,
CS Investigators and Perioperative Anesthesia J.C.Trials
Clinical Villar, H.P. Grocott, M.D. Seeberger, S. Fremes, F. Lellouche,
Group*
S. Syed, K. Byrne, S.M. Bagshaw, N.C. Hwang, C. Mehta, T.W. Painter, C. Royse,
A BS T R AC T
S. Verma, G.M.T. Hare, A. Cohen, K.E. Thorpe, P. Jüni, and N. Shehata,
for the TRICS Investigators and Perioperative Anesthesia Clinical Trials Group*
D
a restrictive versus liberal red-cell transfusion strategy on clinical out- The authors’ full names, academic de-
ients undergoing cardiac surgery remains unclear. grees, and affiliations are listed in the Ap-
A BS T R AC T
pendix. Address reprint requests to Dr.
Mazer at the Department of Anesthesia,
St. Michael’s Hospital, 30 Bond St., To-
center, open-label, noninferiority trial, we randomly assigned 5243 adults ronto, ON, M5B 1W8, Canada, or at
BACKGROUND
cardiac surgery who had a European System for Cardiac Operative Risk mazerd@smh.ca.
The from
EuroSCORE) I of 6 or more (on a scale effect 0 toof
47,awith
restrictive versus
higher scores liberallistred-cell
*A complete of the TRICStransfusion
investiga- strategy on clinical out- The authors’ full names, aca
higher risk of death after cardiaccomes in patients undergoing cardiac surgery remains unclear.
surgery) to a restrictive red-cell tors is provided in the Supplementary grees, and affiliations are listed
hreshold (transfuse if hemoglobin level wasRed-Cell Tr ansfusion for Cardiac Surgery
Table 1. Baseline and Operative Characteristics.*
Restrictive Threshold Liberal Threshold
Characteristic (N = 2430) (N = 2430)
Preoperative characteristics
Age — yr 72±10 72±10
T h e n e w e ng l a n d j o u r na l o f Male
m e dic
sex —i nno.
e (%) 1553 (63.9) 1586 (65.3)
Body-mass index† 28.1±6.0 28.0±5.2
EuroSCORE I‡ 7.9±1.8 7.8±1.9
Original Article Previous cardiac surgery — no. (%) 307 (12.6) 280 (11.5)
Myocardial infarction in previous 90 days — no. (%) 562 (23.1) 601 (24.7)
Left ventricular function — no./total no. (%)§
Good 1485/2430 (61.1) 1523/2427 (62.8)
ctive or Liberal Red-Cell Transfusion Moderately reduced 733/2430 (30.2) 710/2427 (29.3)
for Cardiac Surgery Poor
Very poor
166/2430 (6.8)
46/2430 (1.9)
156/2427 (6.4)
38/2427 (1.6)
Diabetes mellitus — no. (%) 646 (26.6) 686 (28.2)
r, R.P. Whitlock, D.A. Fergusson, J. Hall, Treated
E. Belley-Cote, K. Connolly,
hypertension — no. (%) 1797 (74.0) 1803 (74.2)
n, A.J. Gregory, É. de Médicis, S. McGuinness, A. Royse,
Emergency surgery F.M.
— no.Carrier,
(%) 37 (1.5) 34 (1.4)
g, J.C. Villar, H.P. Grocott, M.D. Seeberger, S. Fremes, F. Lellouche,
Renal function — no./total no. (%)¶
Byrne, S.M. Bagshaw, N.C. Hwang, C. Mehta, T.W. Painter, C. Royse,
Normal 1090/2332 (46.7) 1071/2348 (45.6)
ma, G.M.T. Hare, A. Cohen, K.E. Thorpe, P. Jüni, and N.
Moderately Shehata,
impaired 857/2332 (36.7) 866/2348 (36.9)
CS Investigators and Perioperative Anesthesia Clinical
Severely Trials Group*
impaired 355/2332 (15.2) 385/2348 (16.4)
Use of dialysis 30/2332 (1.3) 26/2348 (1.1)
Use of aspirin — no./total no. (%) 1274/2428 (52.5) 1293/2423 (53.4)
A BS T R AC T
Hemoglobin — g/dl 13.1±1.8 13.1±1.7
Operative characteristics
D Type of surgery — no./total no. (%)
a restrictive versus liberal red-cell transfusion CABGstrategy
only on clinical out- The authors’ full names, academic de- (25.6)
622/2429 645/2430 (26.5)
ients undergoing cardiac surgery remains unclear. grees, and affiliations are listed in the Ap-
CABG and valve surgery pendix. Address reprint requests464/2429to Dr. (19.1) 472/2430 (19.4)
CABG and other, nonvalve surgery Mazer at the Department of Anesthesia, 205/2429 (8.4) 203/2430 (8.4)
Valve surgery only St. Michael’s Hospital, 30 Bond St., To- (28.9)
center, open-label, noninferiority trial, we randomly assigned 5243 adults ronto, ON, M5B 1W8, Canada,703/2429 or at
716/2430 (29.5)
cardiac surgery who had a European System Other, non-CABG surgery
for Cardiac Operative Risk mazerd@smh.ca. 433/2429 (17.8) 394/2430 (16.2)
Duration of cardiopulmonary bypass — min 120±59 121±57
EuroSCORE) I of 6 or more (on a scale from 0 to 47, with higher scores *A complete list of the TRICS investiga-
Intraoperative tranexamic acid — no./totaltors is provided in the Supplementary (91.4)
no. (%) 2219/2428 2235/2428 (92.1)
higher risk of death after cardiac surgery) to a restrictive red-cell
Appendix, available at NEJM.org.
hreshold (transfuse if hemoglobin level* wasThe n e w e ng l a n d j o u r na l of m e dic i n e
15
Liberal threshold Restrictive threshold
Mean Hemoglobin Concentration (g/dl)
14
The n e w e ng l a n d j o u r na l of m e dic i n e
13
12
Original Article
11
10
ctive or Liberal Red-Cell Transfusion
9
for Cardiac Surgery
8
r, R.P. Whitlock, D.A. Fergusson, J. Hall, E. Belley-Cote, K. Connolly,
n, A.J. Gregory, É. de Médicis, S. McGuinness, 7 A. Royse, F.M. Carrier,
0 Fremes, F. Lellouche,
g, J.C. Villar, H.P. Grocott, M.D. Seeberger, S.
Byrne, S.M. Bagshaw, N.C. Hwang, C. Mehta, T.W. Painter, C.2Royse,4 6 8 10 12 14 16 18 20 22 24 26 28
Ad era e
iss e
n
U p tiv
m tiv
io
ma, G.M.T. Hare, A. Cohen, K.E. Thorpe, P. Jüni, and N. Shehata,
IC trao era
Days since Surgery
In eop
CS Investigators and Perioperative Anesthesia Clinical Trials Group*
Pr
No.Aat
BSRisk
T R AC T
Liberal threshold 2428 2435 2015 1354 731 443 327 233 153 122 112 76 69 57 51
Restrictive threshold 2429 2454 2007 1431 841 527 376 305 215 165 131 117 91 77 76
D
a restrictive versus liberal red-cell transfusion strategy on clinical out- The authors’ full names, academic de-
ients undergoing cardiac grees, and affiliations are listed in the Ap-
Figure surgery remains unclear.
1. Hemoglobin Concentration during the Trial Period. pendix. Address reprint requests to Dr.
The restrictive transfusion threshold was less Mazer thanat7.5
the Department of Anesthesia,
g per deciliter intraoperatively and postoperatively, and the
St. Michael’s Hospital, 30 Bond St., To-
center, open-label, noninferiority trial, we randomly
liberal transfusion thresholdassigned 5243than
was less adults9.5ronto,
g perON,deciliter
M5B 1W8,intraoperatively
Canada, or at or postoperatively in the intensive care
cardiac surgery whounit
had(ICU)
a European System for Cardiac Operative Risk mazerd@smh.ca.
or less than 8.5 g per deciliter on the non-ICU ward. I bars indicate the standard deviation.
EuroSCORE) I of 6 or more (on a scale from 0 to 47, with higher scores *A complete list of the TRICS investiga-
higher risk of death after cardiac surgery) to a restrictive red-cell tors is provided in the Supplementary
hreshold (transfuse if hemoglobin level wasRed-Cell Tr ansfusion for Cardiac Surgery
Table 2. Transfusion Outcomes in the Per-Protocol Population.
Restrictive Threshold Liberal Threshold Odds Ratio or Rate Ratio
Characteristic (N = 2430) (N = 2430) (95% CI)
Red-cell transfusions after randomization
≥1 Unit of red cells — no. (%) 1271 (52.3) 1765 (72.6) 0.41 (0.37–0.47)
No. of units of red cells transfused
Median 2 3 0.85 (0.82–0.88)*
Interquartile range 1–4 2–5
Distribution — no. (%)
sion 0
1
1159 (47.7)
383 (15.8)
665 (27.4)
366 (15.1)
2 283 (11.6) 367 (15.1)
3 174 (7.2) 267 (11.0)
onnolly, 4 140 (5.8) 225 (9.3)
. Carrier, ≥5 291 (12.0) 540 (22.2)
louche,
Intraoperative red-cell transfusion
C. Royse,
No. of patients with transfusion (%) 674 (27.7) 1259 (51.8) 0.36 (0.32–0.40)
hata,
Group* Median no. of units transfused 2 2 0.88 (0.82–0.95)*
Interquartile range 1–3 1–3
Postoperative red-cell transfusion in ICU
No. of patients with transfusion (%) 867 (35.7) 1253 (51.6) 0.52 (0.46–0.58)
Median no. of units transfused 2 2 0.98 (0.93–1.04)*
Interquartile range 1–3 1–3
inical out- The authors’ full names, academic de-
grees, and affiliations are listed in the Ap- Postoperative red-cell transfusion not in ICU
pendix. Address reprint requests to Dr.
No. of patients with transfusion (%) 278 (11.4) 229 (9.4) 1.24 (1.03–1.49)
Mazer at the Department of Anesthesia,
St. Michael’s Hospital, 30 Bond St., To- Median no. of units transfused 1 1 0.78 (0.60–1.03)*
243 adults ronto, ON, M5B 1W8, Canada, or at
Interquartile range 1–1 1–2
rative Risk mazerd@smh.ca.
Protocol suspension at any time — no. (%) 348 (14.3) 270 (11.1) 1.34 (1.13–1.58)
her scores *A complete list of the TRICS investiga-
ve red-cell tors is provided in the Supplementary Other transfusions
Appendix, available at NEJM.org.
iter, start- Plasma — no. (%) 571 (23.5) 658 (27.1) 0.83 (0.73–0.94)
old (trans- This article was published on November Platelets — no. (%) 700 (28.8) 716 (29.5) 0.97 (0.86–1.10)
12, 2017, at NEJM.org.
r intensive Cryoprecipitate — no./total no. (%) 275/2334 (11.8) 275/2349 (11.7) 1.01 (0.84–1.20)
mary com- DOI: 10.1056/NEJMoa1711818
Prothrombin complex concentrate — no./total no. (%) 73/2334 (3.1) 61/2349 (2.6) 1.21 (0.86–1.71)
Copyright © 2017 Massachusetts Medical Society.
e, or new-
ever came * This value is a rate ratio. For all ratios, the restrictive-threshold group is in the numerator and the liberal-threshold group in the denominator.
outcomes.
nal function, anemia, and pulmonary disease were DiscussionThe n e w e ng l a n d j o u r na l of m e dic i n e
Table 3. Primary and Secondary Outcomes in the Per-Protocol Population.
Restrictive Threshold Liberal Threshold Odds Ratio or Hazard Ratio
Characteristic (N = 2430) (N = 2430) (95% CI)
Primary outcome
Composite-outcome event — no./total no. (%) 276/2428 (11.4) 303/2429 (12.5) 0.90 (0.76–1.07)
Death — no./total no. (%) 74/2427 (3.0) 87/2429 (3.6) 0.85 (0.62–1.16)
Stroke — no./total no. (%) 45/2428 (1.9) 49/2429 (2.0) 0.92 (0.61–1.38)
Myocardial infarction — no./total no. (%) 144/2428 (5.9) 144/2429 (5.9) 1.00 (0.79–1.27)
New-onset renal failure with dialysis — no./total no. (%) 61/2428 (2.5) 72/2429 (3.0) 0.84 (0.60–1.19)
Secondary outcomes
Length of stay in ICU
No. of patients with data 2422 2418
Median — days 2.1 1.9 0.89 (0.84–0.94)*
Interquartile range — days 1.0–4.0 1.0–3.9
Length of stay in hospital
No. of patients with data 2419 2419
Median — days 8.0 8.0 0.93 (0.88–0.99)*
Interquartile range — days 7.0–13.0 7.0–12.0
Duration of mechanical ventilation
No. of patients with data 2416 2421
Median — days 0.38 0.36 0.94 (0.89–1.00)*
- The authors’ full names, academic de- Interquartile range — days 0.22–0.75 0.22–0.71
grees, and affiliations are listed in the Ap- Prolonged low-output state — no./total no. (%)† 994/2429 (40.9) 987/2430 (40.6) 1.01 (0.90–1.14)
pendix. Address reprint requests to Dr.
Mazer at the Department of Anesthesia, Infection — no./total no. (%) 121/2428 (5.0) 101/2429 (4.2) 1.21 (0.92–1.58)
St. Michael’s Hospital, 30 Bond St., To- Bowel infarction — no./total no. (%) 6/2428 (0.2) 5/2429 (0.2) 1.20 (0.37–3.94)
s ronto, ON, M5B 1W8, Canada, or at
k mazerd@smh.ca. Acute kidney injury — no./total no. (%) 792/2332 (34.0) 797/2348 (33.9) 1.00 (0.89–1.13)
s *A complete list of the TRICS investiga- Seizure — no./total no. (%) 50/2428 (2.1) 42/2429 (1.7) 1.20 (0.79–1.81)
l tors is provided in the Supplementary Delirium — no./total no. (%) 306/2428 (12.6) 264/2429 (10.9) 1.18 (0.99–1.41)
Appendix, available at NEJM.org.
- Encephalopathy — no./total no. (%) 26/2428 (1.1) 22/2429 (0.9) 1.18 (0.67–2.10)
- This article was published on November
12, 2017, at NEJM.org.
e * This value is a hazard ratio. For all ratios, the restrictive-threshold group is in the numerator and the liberal-threshold group in the denomi-
nator.
- DOI: 10.1056/NEJMoa1711818
† A prolonged low-output state was defined as the infusion of two or more inotropes for 24 hours or more, the use of an intraaortic balloon
Copyright © 2017 Massachusetts Medical Society.
- pump postoperatively, or the use of a ventricular assist device postoperatively, as described in the Supplementary Appendix.
e
.
modified intention-to-treat analyses as well across has been some discrepancy between randomized
subgroups and sensitivity analyses. Fewer pa- trials on the one hand and observational studies
28,29Red-Cell Tr ansfusion for Cardiac Surgery
No. of Restrictive Liberal P Value for
Subgroup Patients Threshold Threshold Unadjusted Odds Ratio (95% CI) Interaction
no. of patients with event/total no. (%)
Age 0.004
2.26 mg/dl 172 23/80 (28.7) 26/92 (28.3) 1.02 (0.53−1.99)
Chronic pulmonary 0.67
disease
, No 4057 229/2023 (11.3) 249/2034 (12.2) 0.92 (0.76−1.11)
r, Yes 800 47/405 (11.6) 54/395 (13.7) 0.83 (0.55−1.26)
Surgery category 0.22
Non-CABG 2247 111/1138 (9.8) 136/1109 (12.3) 0.77 (0.59−1.01)
e,
CABG only 1266 57/621 (9.2) 51/645 (7.9) 1.18 (0.79−1.75)
CABG+ other 1344 108/669 (16.1) 116/675 (17.2) 0.93 (0.70−1.24)
* Left ventricular function 0.78
Very poor 84 6/46 (13.0) 6/38 (15.8) 0.80 (0.24−2.72)
Poor 322 21/166 (12.7) 21/156 (13.5) 0.93 (0.49−1.78)
Moderate 1441 88/731 (12.0) 89/710 (12.5) 0.95 (0.70−1.31)
Good 3010 161/1485 (10.8) 187/1525 (12.3) 0.87 (0.69−1.09)
Preoperative hemoglobin 0.54
concentration
ut- The authors’ full names, academic de-Seuils transfusionnels chez les pa
Docherty and Walsh Critical Care (2017) 21:61
DOI 10.1186/s13054-017-1638-9
REVIEW Open Access
Anemia and blood transfusion in the
critically ill patient with cardiovascular
disease
Annemarie B. Docherty1,2* and Timothy S. Walsh1,2
delivered by coronary blood flow [5], and there is there-
Abstract fore little reserve when myocardial oxygen consumption is
This article is one of ten reviews selected from the increased in critical illness. Atheroma‐related flow limita-
Annual Update in Intensive Care and Emergency tion further compromises myocardial oxygen delivery.
Medicine 2017. Other selected articles can be
found online at http://ccforum.com/series/ Anemia and outcomes in patients with cardiovascular
annualupdate2017. Further information about the disease
Annual Update in Intensive Care and Emergency Anemia is associated with worse outcomes in patients
Medicine is available from http://www.springer. with CVD, both in terms of severity of illness, and
com/series/8901.Docherty and Walsh Critical Care (2017) 21:61
mortality. Anemia is a significant risk factor in ische-
mic heart disease (IHD), correlating with advanced
IHD, chronic heart failure, rhythm disturbance and
Background
higher mortality rate in comparison to non‐anemic pa-
Anemia and cardiovascular disease
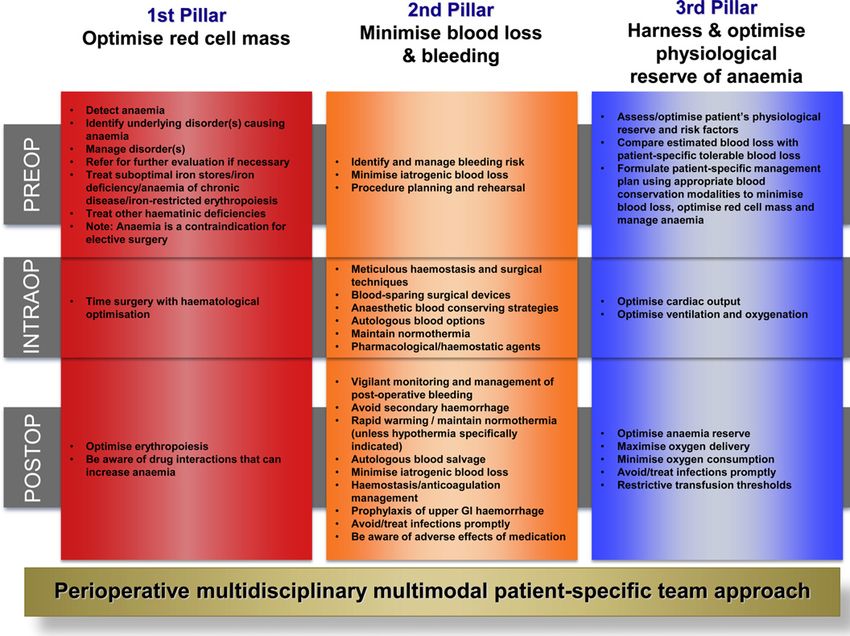
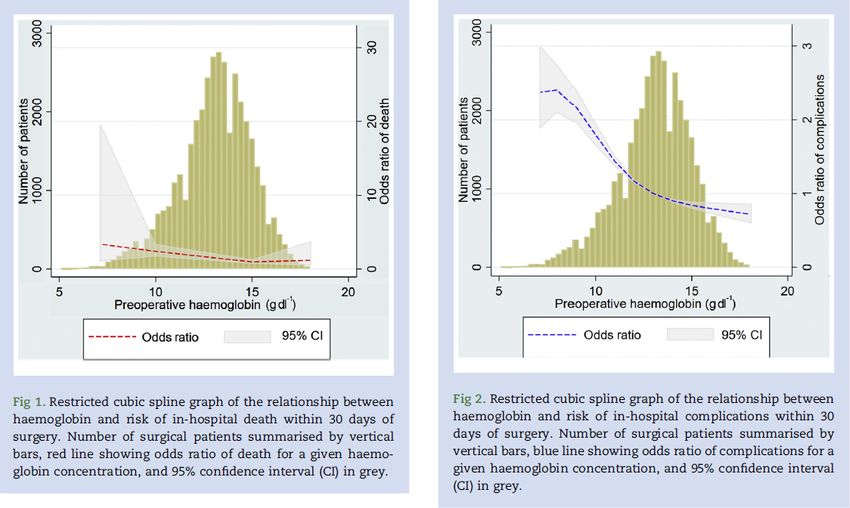
tients [6]. Anemia is also an independent predictor ofFig. 2 Systematic review: Blood transfusion thresholds in patients with cardiovascular disease (CVD). Forest plot showing risk ratios for 30‐day
mortality, and risk of bias assessment for each study. *Additional risk of bias assessed as to completeness of patients recruited into clusters (this
was graded as low risk). Modified from [21] with permission
Docherty and Walsh
Clinician variability in decision making
Critical
the difficultiesCare
a future (2017)
misalignment. Using the ‘PICO’ model, we address
some of
Audits of blood transfusion practice in the UK have con- 21:61
trial might encounter
sistently shown that around 20% of blood product usage and offer some potential solutions.Fig. 3 Systematic review: Blood transfusion thresholds in patients with cardiovascular disease (CVD). Forest plot showing risk ratios for adverse
cardiovascular events and risk of bias assessment for each study. Modified from [21] with permission
more manageable. If no difference is found, then we It is physiologically appealing to design a trial that
Docherty and Walsh Critical Care (2017) 21:61
could say with confidence that patients with CVD do individualizes transfusion based on patient risk of
not benefit from higher transfusion thresholds. However, mortality or ACS. Those patients at high risk wouldless critically ill or have milder co‐existing CVD. A sub- [31]. An adaptive trial design, allowing the risk algo-
sequent trial would potentially need to be undertaken in rithm to be informed by previous participants in the
this group. trial would reduce the risk to patients of being
Table 1 Table of guidelines for red blood cell transfusion in patients with cardiovascular disease
Organization Year Recommendation Recommendation for CVD
for general
British Committee for Standards 2013 7.0 g/dl, target Stable angina should have a Hb maintained > 7.0 g/dl
in Haematology [38] 7.0–9.0 g/dl
NICE: National Institute for Health 2015 7.0 g/dl, target ACS: transfusion threshold of 8.0 g/dl, target of 8.0–10.0 g/dl
and Clinical Excellence [51] 7.0–9.0 g/dl Chronic: further research
Association of Anaesthetists of Great Britain 2016 7.0 g/dl Uncertainty remains for patients with ischemic heart disease,
and Ireland [52] higher thresholds (8.0 g/dl) may be appropriate
American Association of Blood Banks (AABB) [53] 2016 7.0 g/dl Patients with symptoms or a Hb level of 8.0 g/dl or less
ACS acute coronary syndrome, CVD cardiovascular disease, Hb hemoglobin
Docherty and Walsh Critical Care (2017) 21:61JOURNAL OF THE AMERICAN COLLEGE OF CARDIOLOGY VOL. 64, NO. 8, 2014
ª 2014 BY THE AMERICAN COLLEGE OF CARDIOLOGY FOUNDATION ISSN 0735-1097/$36.00
PUBLISHED BY ELSEVIER INC. http://dx.doi.org/10.1016/j.jacc.2014.05.040
Blood Transfusion During
Acute Myocardial Infarction
Association With Mortality and Variability Across Hospitals
Adam C. Salisbury, MD, MSC,*y Kimberly J. Reid, MS,* Steven P. Marso, MD,*y Amit P. Amin, MD, MSC,z
Karen P. Alexander, MD,x Tracy Y. Wang, MD, MHS, MSC,x John A. Spertus, MD, MPH,*y Mikhail Kosiborod, MD*y
ABSTRACT
BACKGROUND Blood transfusion is controversial for anemic patients with acute myocardial infarction (AMI), with
some previous studies reporting increased risk of transfusion-associated mortality.
OBJECTIVES The goal of this study was to examine variability in blood transfusions across hospitals and the
relationship between blood transfusion and in-hospital mortality in a large, contemporary cohort of consecutive
AMI patients.
J
Am
Coll
Cardiol
2014;64:811–9
METHODS Among 34,937 AMI hospitalizations from 57 centers, patients receiving at least 1 packed red blood cell
transfusion were compared with those who were not transfused. Using 45 disease severity, comorbidity, laboratory,
and in-hospital treatment variables, we propensity matched patients who did and did not receive a packed red blood
cell transfusion. A conditional logistic regression model was used to identify the association between transfusion and
in-hospital mortality.
RESULTS A total of 1,778 patients (5.1%) had at least 1 transfusion. In unadjusted analyses, transfusion was associatedshock, septic shock, cardiog
AMI diagnosis + elevated hospital mechanical ventilat
cardiac biomarkers
propensity scores for the likeli
N=40,699
each patient, propensity score
Hospital enrolling < 20pts
(n=59), LOS > 31 days (n=411)
without transfusion during AM
examined for overlap. Compa
n=40,229
overlapping region of the prop
CABG during admission were then stratified according
(n=4,089), Valve surgery
during admission (n=41) and those who were transfus
n=36,099 1-to-many fashion with those n
a larger proportion of AMI pati
No Hgb recorded (n=588),
Length of stay < 1 day (n=574)
not receive a transfusion), us
0.5. This caliper width is 0.5 ti
N = 34,937 of the propensity score for tr
from 57 hospitals
the maximum difference in pro
treated and untreated patients
F I G U R E 1 Patient Population
matching. The adequacy of pro
then assessed by calculating po
Inclusions and exclusions. AMI ¼ acute myocardial infarction; differences and examining p
CABG ¼ coronary artery bypass grafting; Hgb ¼ hemoglobin; post-matching. A significant i
LOS ¼ length of stay.
ered to be present if a >10% s
was present between the 2 gr
matching (15).
J
Am
Coll
recorded Cardiol
2014;64:811–9
hemoglobin assessment and any patient Another clinically importan
with a length of staythe present
ith nonover- Unadjusted Multivariable Adjusted
reserving the OR (95% CI) OR (95% CI)
ly important
0.52 (0.32, 0.84) 0.59 (0.31, 1.11)
ot possible in Hgb < 7 g/dl
us study did
0.73 (0.60, 0.90) 0.65 (0.51, 0.82)
ansfused; in Hgb 7 - 8.9 g/dl
d that trans-
mortality (11). 0.97 (0.64, 1.47) 0.74 (0.47, 1.16)
Hgb 9 - 10.9 g/dl
emoglobin in
to adjust for 6.28 (2.12, 18.59) 1.97 (0.42, 9.24)
Hgb > 11 g/dl
ompleted. In
dized differ- 0.5 1 2 4 8 0.5 1 2 4 8
Lower Mortality Higher Mortality Lower Mortality Higher Mortality
se who were
ng prognostic
F I G U R E 3 Transfusion and Mortality Stratified According to Nadir Hgb
anemia, not
ity matching Association of transfusion with mortality stratified according to lowest in-hospital Hgb
e prognostic value. A total of 227 (42.3%) of 537 patients with nadir Hgb 10% regard to transfusion practices in AMI (24). Regard-domized to a
10 g/dl, Hebert
ence in 30-day
ference in the
morbidity com- 20%
ve transfusion
Proportion Transfused (%)
ts in the TRACS
15%
c Surgery) trial
n a trial of pa-
ary disease risk 10%
A recent meta-
fusion to date
nd a modestly 5%
ients managed
ral transfusion
0%
1 3 5 7 9 11 13 15 17 19 21 23 25 27 29 31 33 35 37 39 41 43 45 47
o 0.95]) but no
tive risk: 0.85 Hospital (Ranked from Lowest to Highest)
ntrast, a recent
F I G U R E 4 Variation in Blood Transfusion Rates Across Health Facts Hospitals
gastrointestinal
es among pa- Shrinkage-adjusted rates of blood transfusion at the time of acute myocardial infarction
fusion strategy across participating hospitals in Health Facts, ranked from lowest to highest transfusion
ize to patients incidence.
and practice
J
Am
Coll
Cardiol
2014;64:811–9
64111. E-mail: asalisbury@saint-lukes.org.
ical
sfu-
           PERSPECTIVES
rget
tely
een        COMPETENCY IN MEDICAL KNOWLEDGE:                                    L’anémie
  est
  fréquente
  chez
  les
  pa
Le
problème
des
seuils
transfusionnels
• Li[érature
(staConclusions
sur
les
seuils
transfusionnels
• Pas
de
preuves
que
les
seuils
“libéraux”
améliorent
la
survie
– Seuil
libéral:
>
8
mais
<
9
g/dL
• Il
est
probable
que
les
pa
8
mais
<
10
g/
dL
– Aucun
bénéfice
pour
Hb
>
10
g/dL
Conclusions
  sur
  les
  seuils

             transfusionnels

• Les
  seuils
  bas
  sont
  associés
  sta
Le
problème
des
seuils
transfusionnels
• Li[érature
(staL’anémie d’hémodilution • Est définie par une diminution de la valeur de l’Hb (donc anémie) • Avec une diminution de la masse globulaire rouge soit nulle soit moins importante que l’augmentation du volume plasmatique • Les calculs du CaO2 et du TaO2 peuvent être faux • Quand la valeur d’Hb (anémie d’hémodilution) est proche du seuil transfusionnel, indication théorique de transfusion de CGR
Calculs du CaO2 et du TaO2
• TaO2 = (VES= 45 ml) x (FC = 100 bpm) x 0,00134 x
   (Hb = 10.5 g/dL x Saturation = 1 ) x 10
   = 633 ml/min (9 ml/kg/min; 70 kg)

• Après optimisation hémodynamique :
  TaO2 = (VES= 55 ml) x (FC = 90 bm ) x 0,00134 x (Hb = 9.5 g/dL x
   x Saturation= 1 ) x 10 = 630 ml/min (9 ml/kg/min)

• Après optimisation hémodynamique avec valeur Hb
   inchagée (la masse globulaire rouge n’a pas changé) :
  TaO2 = (VES= 55 ml) x (FC= 90bpm) x 1,34 (Hb = 10,5 g/dL x
   x Saturation= 1 ) x 10 = 696 ml/min (10 ml/kg/min)
Scénario
  clinique

• Pa
Scénario
  clinique

• Pa
Scénario
  clinique

• Pa
Les questions qu’il faut poser avant de
       prescrire une transfusion de CGR

     Seuil
transfusionnel
                     Hb = Seuil – 0,2 g/dL

       Pour cette patiente: Hb = 6,8 g/dL
Le
problème
des
seuils
transfusionnels
pour
un
paLes questions qu’il faut poser avant de
prescrire une transfusion de CGR
Pertes sanguines
Par rapport aux pertes
Acceptables calculées
Historique/tendances de Hémodilution
la valeur d’Hb Expansion volémique
Seuil
transfusionnel Hb = Seuil – 0,2 g/dL
Tolérance de Anticipation (temps, Alternatives
l’anémie pertes sanguines) Transfusion CGRQCM
6
• Concernant le bruit de mesure de l’hémoglobine
(plusieurs réponses correctes possibles)
– 1. Il ne dépend que de la technique de mesure (bruit
analytique)
– 2. Il peut être en relation avec des variations
physiologiques circadiennes de l’hémoglobine
– 3. Il est inférieur à 0,1 g/dL quelle que soit la
technique de mesure
– 4. Il est > 1 g/dL quelle que soit la technique de
mesure
– 5. Je ne sais pas vraimentLes questions qu’il faut poser avant de
prescrire un transfusion de CGR
Pertes sanguines
Bruit de mesure Hb ? Par rapport aux pertes
Acceptables calculées
Historique de Hémodilution Expansion
la valeur d’Hb volémique
Seuil
transfusionnel Hb = Seuil – 0,2 g/dL
Tolérance de Anticipation (temps, Alternatives
l’anémie Pertes sanguines) Transfusion CGRBruit de la mesure de l’Hb
Quel
est
le
bruit
de
la
mesure
de
l’Hb
?
Quelles
sont
les
sources
du
bruit
de
la
mesure
?
Comment
faut-‐il
gérer
le
bruit
de
la
mesure
?
Site de Erreurs pré-‐ prélèvement analy
Exemple d’erreur pré-analytique
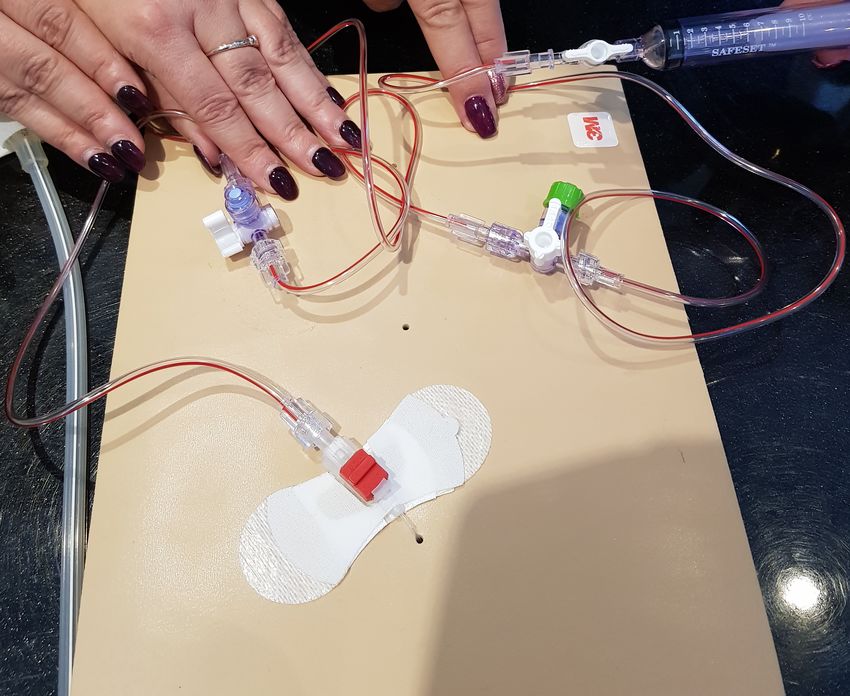
dans la mesure de l’HbMontage: Quel est le volume mort ?
Montage: Quel est le volume mort ?

                      3 ml
              1 ml                  5 ml

            Purge: Vol mort x 2-3
Le bruit analytique (mesure
sur le même échantillon)
Avec la même technique
Avec des techniques différentesQui peut énumérer les conditions de
qualité de mesure avec lʼHemocue ?
TRANSFUSION 2016;00;00–00Les conditions de qualité de
mesure avec lʼHemocue ?
• Ponction sur la face latérale du médian,
sans pression
• Bras non-dominant
• Troisième goutte
• Position assise ?
TRANSFUSION 2016;00;00–00Sources de variabilité (bruit) de la
mesure
• La peau plus foncée diminue la variabilité
(méthodes non-invasives et invasives)
• Le fait de fumer diminue la différence
entre non-invasif et laboratoire.
– Carboxyhémoglobine diminue la sensibilité en
non-invasif
– La saturation en O2 mieux mesurée ?
• Anomalies des doigts (callosités)Charpentier et al. BMC Medical Research Methodology (2016) 16:7
DOI 10.1186/s12874-016-0107-5
RESEARCH ARTICLE Open Access
Meta-analytic estimation of measurement
variability and assessment of its impact on
decision-making: the case of perioperative
haemoglobin concentration monitoring
Emmanuel Charpentier1* , Vincent Looten1 , Björn Fahlgren1 , Alexandre Barna1 and Loïc Guillevin2
Abstract
Background: As a part of a larger Health Technology Assessment (HTA), the measurement error of a device used to
monitor the hemoglobin concentration of a patient undergoing surgery, as well as its decision consequences, were to
be estimated from published data.
Methods: A Bayesian hierarchical model of measurement error, allowing the meta-analytic estimation of both central
and dispersion parameters (under the assumption of normality of measurement errors) is proposed and applied to
published data; the resulting potential decision errors are deduced from this estimation. The same method is used to
assess the impact of an initial calibration.
BMC
Medical
Research
Methodology
(2016)
16:7
Results: The posterior distributions are summarized as mean ± sd (credible interval). The fitted model exhibits a
modest mean expected error (0.24 ± 0.73 (−1.23 1.59) g/dL) and a large variability (mean absolute expected errorFor example
threshold T
of false nega
would have
• Similarly, a
importance
mode.
The anesthesi
able” region for
g/dL; the choice
patient depends
factors.
It was therefo
extension to “li
choose a mode.
A better choic
tion of tHb of m
excluding the sy
Fig. 5 Decision error risks. Mean values and 95 % credible intervals
The source pape
mation in any us
BMC
Medical
Research
Methodology
(2016)
16:7
Conclusions
  des
  auteurs

• A
  cause
  du
  bruit
  de
  la
  mesure
  de
  l’Hb
  (en

  situa
Messages

• Le bruit de la mesure de l’Hb est souvent
  > 1 g/dL
• Les conséquences de ce bruit de mesure
  (biologique, pré-analytique et analytique)
  sont:
  – Une valeur d’Hb autour du seuil est
    “incertaine” par définition
  – Il faut prendre en considération l’incertitude de
    la valeur dans la décision de transfuser
  – Evaleur la tolérance de l’anémie
Exemple d’algorithme décisionnel pour une Hb
proche du seuil transfusionnel en normovolémie
Hb proche du seuil (ex. 6,9 g/dL)
Historique des valeurs d’Hb
Saignement actif Expansion volémique (non CGR)
Comparer pertes mesurées
avec pertes maximum acceptables (PMA)
pour passer de l’Hb initiale à l’Hb Oui
actuelle
Pertes mesurées < < PMA pour Hb actuelle
Anémie d’hémodiltuionMessages de fin (1) • Dans beaucoup d’études observa
Messages
  de
  fin
  (2)

• Pour
  relier
  ces
  données
  sta
You can also read