Optimization of epilepsy surgery through virtual resections on individual structural brain networks
←
→
Page content transcription
If your browser does not render page correctly, please read the page content below

www.nature.com/scientificreports
OPEN Optimization of epilepsy surgery
through virtual resections
on individual structural brain
networks
Ida A. Nissen1, Ana P. Millán1*, Cornelis J. Stam1, Elisabeth C. W. van Straaten1,
Linda Douw2, Petra J. W. Pouwels3, Sander Idema4, Johannes C. Baayen4, Demetrios Velis1,
Piet Van Mieghem5 & Arjan Hillebrand1
The success of epilepsy surgery in patients with refractory epilepsy depends upon correct identification
of the epileptogenic zone (EZ) and an optimal choice of the resection area. In this study we developed
individualized computational models based upon structural brain networks to explore the impact of
different virtual resections on the propagation of seizures. The propagation of seizures was modelled
as an epidemic process [susceptible-infected-recovered (SIR) model] on individual structural networks
derived from presurgical diffusion tensor imaging in 19 patients. The candidate connections for the
virtual resection were all connections from the clinically hypothesized EZ, from which the seizures
were modelled to start, to other brain areas. As a computationally feasible surrogate for the SIR
model, we also removed the connections that maximally reduced the eigenvector centrality (EC)
(large values indicate network hubs) of the hypothesized EZ, with a large reduction meaning a large
effect. The optimal combination of connections to be removed for a maximal effect were found using
simulated annealing. For comparison, the same number of connections were removed randomly,
or based on measures that quantify the importance of a node or connection within the network. We
found that 90% of the effect (defined as reduction of EC of the hypothesized EZ) could already be
obtained by removing substantially less than 90% of the connections. Thus, a smaller, optimized,
virtual resection achieved almost the same effect as the actual surgery yet at a considerably smaller
cost, sparing on average 27.49% (standard deviation: 4.65%) of the connections. Furthermore, the
maximally effective connections linked the hypothesized EZ to hubs. Finally, the optimized resection
was equally or more effective than removal based on structural network characteristics both regarding
reducing the EC of the hypothesized EZ and seizure spreading. The approach of using reduced EC as a
surrogate for simulating seizure propagation can suggest more restrictive resection strategies, whilst
obtaining an almost optimal effect on reducing seizure propagation, by taking into account the unique
topology of individual structural brain networks of patients.
Resective epilepsy surgery is the treatment of choice for refractory epilepsy in carefully selected patients who
undergo a rigorous presurgical evaluation1. Often, patients with a good surgical outcome are not only free of
disabling seizures, but also experience an improvement in their cognitive abilities and quality of l ife2. Even though
most patients achieve an improvement in the seizure burden, epilepsy surgery is not always successful and may
require repeat s urgery3. Approximately one-third of patients do not become seizure-free after s urgery4. The
success of surgery depends on successful localization of the epileptogenic zone and the choice of the resection
area. In the last decade, a rethinking of the concept of the epileptogenic zone has taken place. The epileptogenic
1
Department of Clinical Neurophysiology and MEG Center, Amsterdam Neuroscience, Vrije Universiteit Amsterdam,
Amsterdam UMC, Amsterdam, The Netherlands. 2Department of Anatomy and Neuroscience, Amsterdam
Neuroscience, Vrije Universiteit Amsterdam, Amsterdam UMC, Amsterdam, The Netherlands. 3Radiology and
Nuclear Medicine, Amsterdam Neuroscience, Vrije Universiteit Amsterdam, Amsterdam UMC, Amsterdam, The
Netherlands. 4Department of Neurosurgery, Amsterdam Neuroscience, Vrije Universiteit Amsterdam, Amsterdam
UMC, Amsterdam, The Netherlands. 5Faculty of Electrical Engineering, Mathematics and Computer Science, Delft
University of Technology, Delft, The Netherlands. *email: a.p.millanvidal@amsterdamumc.nl
Scientific Reports | (2021) 11:19025 | https://doi.org/10.1038/s41598-021-98046-0 1
Vol.:(0123456789)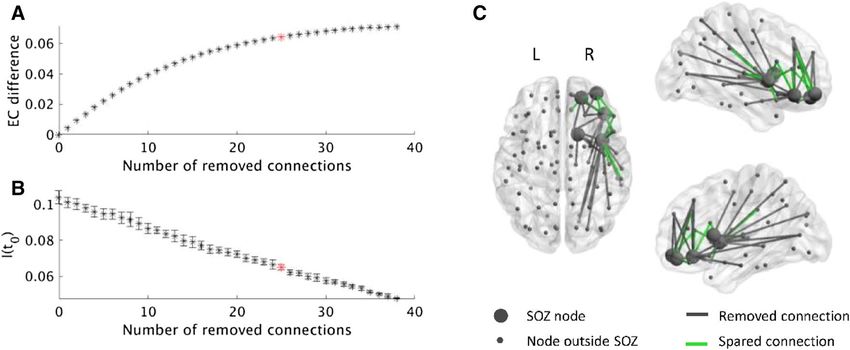
www.nature.com/scientificreports/
zone is defined as a circumscribed area that needs to be removed or disconnected to achieve seizure f reedom5.
However, current views advocate the existence of an epileptogenic network instead of a locally confined epi-
leptogenic zone6–10. In a network, local resections can have widespread effects, even at remote locations, that
cannot be directly predicted from the location of the removed region itself11,12. Similarly, a local resection of
pathological tissue might not prevent the epileptogenic network from forming a new seizure onset zone (defined
as the regions where seizures s tart5) over t ime13. The brain network varies from one patient to the n ext14,15, but
the network itself and its variability between patients are not taken into account in current surgical procedures.
To find the area in a network that should be resected requires imaging modalities that cover the entire brain, as
well as ways to evaluate the effect of a local resection on activity in the entire network at the level of the individual
patient (precision medicine).
Side-effects and cognitive complaints often occur after surgery, depending on the brain areas involved, but
these complaints vary between patients and are difficult to p redict4. Some of the side-effects and complaints could
potentially be avoided with a smaller resection area. Resection areas are often larger than n ecessary16, sometimes
because healthy tissue is removed to access the pathologic tissue (as in mesial temporal resections), but also
because the risk of not removing all of the pathological tissue, resulting in recurrent seizures, often outweighs
the benefits of fewer side-effects after s urgery17. A priori tailoring of resection areas would be feasible if different
resection strategies could be tested beforehand and network effects predicted reliably.
Individualized computer models to aid epilepsy surgery could overcome many of the above mentioned chal-
lenges and thereby improve surgical o utcome18–20. The main advantages are (1) surgery can be individualized by
modelling activity, and in particular the propagation of seizures, on a patient-specific structural brain network,
and (2) competing resection strategies can be tested in silico before the actual surgery, thereby demonstrating
which strategy would be the most effective at the lowest ‘cost’ in terms of removed tissue. The individualization
of the model can be based on some important interpersonal differences for epilepsy: the location of the seizure
onset zone (SOZ) and the pathways of propagation of seizure activity. The propagation strongly depends on the
structural brain network of the patient21, which maps the anatomical connections between the different brain
regions. It is conceivable that in many patients resections can be smaller than is currently the case, as the model
can test which tissue/connection needs to be removed and which can safely remain in place whilst still achieving
a satisfactory control of seizures. In addition, more effective resections can also be searched for, for example at
different locations or when there are multiple hypotheses about the EZ location.
Several recent studies have applied computer models to smaller groups of patients with e pilepsy22–32. Most
model studies identify epileptogenic areas using their model and predict surgery outcome25,26,29,32–34. For example,
both Sinha et al.29 and Goodfellow et al.33 found epileptogenic areas in their model, virtually resected them, and
predicted surgery outcome based on the effect on the model with an accuracy of 81%29 or an area-under-the-
curve (AUC) of 0.8733. Another study calculated the overlap of the epileptogenic nodes identified by the model
with the actual resection and found larger overlap in patients with a good outcome24. In a recent study, Sip
et al.32 modelled the propagation of ictal activity (as recorded via invasive EEG) on patient-specific structural
networks, and found a link between the excitable regions inferred by the model and the clinically found epilep-
togenic zone32. In ictal functional networks, the elevated ability to generate s eizures26 as well as the fraction of
virtually resected rich-club nodes25 correlated with surgery success. Other studies used computer models to find
epileptogenic nodes and evaluated their properties. The virtual resection of those epileptogenic nodes reduced
the epileptogenic activity31, and had a larger effect compared to a standard clinical resection in temporal lobe
epilepsy (TLE) p atients23.
Another approach is to test the actual surgery in the model: Steimer et al.30 removed the areas that were
resected during the actual surgery in their model and found that the developing seizure could be stopped in
seizure-free (SF) but not in not seizure-free (NSF) p atients30. Olmi and c olleagues27 used the actually resected
connections as reference and showed that removing fewer connections in their model achieved the same effect
as the actual s urgery27. Thus, instead of removing the EZ, the seizure propagation pathways were severed to
ensure seizure freedom. The same group compared the areas of propagation in the model to those in SEEG and
concluded that the overlap predicted surgery outcome28. Removing the propagation pathways to limit seizure
propagation is an effective approach in cases where the epileptogenic zone involves eloquent cortex and therefore
would be i noperable22.
These studies have used different models (see Junges et al.18 for detailed description): models based on neural
masses22,27,28,31,33, theta models—an approximation of neural masses in n etworks24–26, bistable m odels23,29,35, and
a distributional clustering m odel30. All these models are complicated with several (often nonlinear) parameters
that need to be estimated beforehand. This hampers the accurate estimation of the optimal resection strategy,
as every parameter needs to be adjusted to the optimal range in order to give an accurate and reproducible pre-
diction for each tested resection strategy. Simpler models with few parameters might prove more reproducible,
especially if the behavior of the model is understood mathematically. A full mathematical understanding of a
model aids the application and especially the interpretation of the results.
In a model, the brain activity is typically simulated on the backbone of a network23–29, 33. Such a network can
be derived for each patient from functional24–26,29,33 or structural22,23,27,28 data. However, as the function (brain
activity) is simulated using the model, it is more intuitive to use a structural network on which the dynamics take
place. Some of the previous studies have used whole brain n etworks22,23, 27, 28, whereas others have studied partial
networks derived from intracranial r ecordings24–26,29,33. The limitation of partial networks is that network-wide
effects beyond the assessed brain areas are not taken into account. It is therefore preferable to study structural
and entire brain networks, as they map the main pathways of all lobes of the brain upon which the functional
activity unfolds.
A recent study performed virtual resections based on a network framework, such as our surrogate a pproach36.
Their measure to estimate the effect of the virtual surgery was synchronizability, which is a measure of the ability
Scientific Reports | (2021) 11:19025 | https://doi.org/10.1038/s41598-021-98046-0 2
Vol:.(1234567890)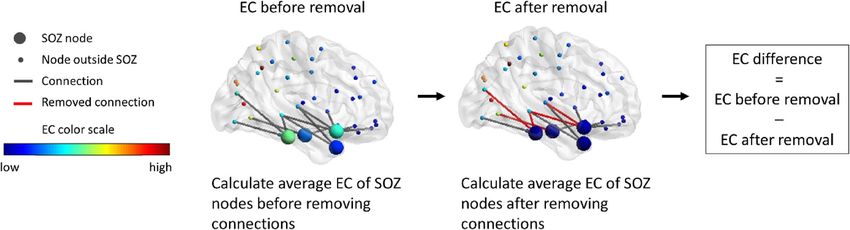
www.nature.com/scientificreports/
Age at surgery Age at epilepsy Years epilepsy at MRI radiologic
Patient no (years) Gender onset (years) resection Resection area diagnosis Pathology results Engel score Surgery outcome
1 32 F 4 28 R Front FCD FCD; Gliosis 1A SF
Abnormal WM
2 20 F 4 17 R Temp signal R temporal mMCD; Gliosis 1A SF
pole
Neoplasm—
5 25 M 3 22 R Front FCD 1A SF
benign tumor
No classified
6 27 F 6 21 R Front FCD 1A SF
diagnosis
7 33 F 18 14 R Temp MTS MTS 1B SF
8 49 M 16 33 R Temp MTS MTS 1A SF
9 19 M 11 12 R Temp MTS MTS 1A SF
10 22 F 12 10 R Temp MTS MTS 1A SF
11 25 M 16 8 R Temp MTS Gliosis 1A SF
12 47 F 35 13 L Temp MTS MTS 1A SF
13 54 F 21 33 R Temp MTS MTS 1A SF
14 53 M 47 6 R Temp Unknown Gliosis 1A SF
16 32 F 2 30 R Temp MTS MTS 1A SF
Cerebral abscess;
17 24 F 8 17 L Temp MTS 1A SF
MTS
Cavernoma;
3 40 M 35 6 R Temp Cavernoma 2B NSF
Gliosis
4 26 F 11 15 R Temp Unknown mMCD 2A NSF
Polymicrogyria;
15 47 M 26 21 R Front Polymicrogyria 4B NSF
Heterotopy
18 25 M 18 7 R Temp MTS Negative 4A NSF
19 54 F 23 31 R Temp MTS Gliosis 2D NSF
Table 1. Patient characteristics of the seizure-free (upper part) and not seizure-free patients (lower part).
F = female, M = male, R = right, L = left, Front = frontal, Temp = temporal, FCD = focal cortical dysplasia,
WM = white matter, MTS = mesial temporal sclerosis, mMCD = mild malformation of cortical development,
SF = seizure-free, NSF = not seizure-free.
to maintain global s ynchronization37. The authors calculated synchronizability on functional networks derived
from electrocorticography (ECoG) measurements and found that the change in synchronizability after virtually
removing the resection area predicted surgical outcome, although this result was not significant after multiple
comparisons corrections. However, synchronizability is defined for structural networks and requires several
assumptions that are not fulfilled in brain data, such as identical dynamical units38. Its application to functional
brain networks leaves the interpretation unclear and without theoretical foundation.
Here we introduce a personalized computer model, based upon individual structural brain networks, to guide
epilepsy surgery and improve surgical outcome. The dynamic model is derived from the field of epidemics and
has the advantage that it is mathematically well-understood, simple and only has two free p arameters39,40. The
model captures one aspect of the epileptic brain that is relevant for surgery, namely the propagation of seizures
over the network, rather than the underlying biology. We chose an epidemic model to simulate this process,
because there is a striking similarity in the way an infectious disease spreads in a population and how a seizure
spreads in a brain network. Furthermore, many definite results have been obtained in the study of spreading of
infections on g raphs40. This knowledge can be used to guide model choice and interpretation. We applied this
model to the whole-brain network derived from diffusion tensor imaging (DTI) for each individual patient,
thereby personalizing the optimal virtual resection. The model was tested retrospectively in a preliminary study
with 19 patients who had been operated, and of whom the surgical outcome at least 1 year after surgery was
known.
Methods
Patients. We retrospectively analyzed 19 patients (11 females) with refractory epilepsy (Table 1). All patients
underwent epilepsy surgery at the Amsterdam University Medical Center, location VUmc, between 2013 and
2016. We included all patients who for their presurgical evaluation had received a clinical DTI scan and mag-
netoencephalography (MEG) recording since 2010 (the MEG data was not used in this study). We excluded
patients with previous epilepsy surgery, an infiltrating tumor or absence of a signed informed consent. The
patient group was heterogeneous with temporal and extratemporal resection locations and different etiology,
the most common being mesial temporal sclerosis (MTS), malformations of cortical development (MCD), and
gliosis. Surgical outcome was classified according to the Engel classification at least one year after the operation.
Patients with Engel class 1 were labelled as SF, and patients with Engel class 2–4 were labelled as NSF. All patients
gave written informed consent and the study was in accordance with the Declaration of Helsinki and approved
by the VUmc Medical Ethics Committee.
Scientific Reports | (2021) 11:19025 | https://doi.org/10.1038/s41598-021-98046-0 3
Vol.:(0123456789)
www.nature.com/scientificreports/
Individualized structural networks. DTI and T1 acquisition. The individualized computer model was
based on the structural brain network of each patient, which was reconstructed from the patient’s DTI scans.
The magnetic resonance imaging (MRI) scans (T1 and DTI) were acquired on a 3T whole-body MR scanner
(Discovery MR750, GE Healthcare, Milwaukee, WI, USA) using an eight-channel phased-array head coil. Ana-
tomical 3D T1-weighted images were obtained at 1 mm isotropic resolution with a fast spoiled gradient-recalled
echo sequence (repetition time: 4.6 ms, echo time: 2.0 ms, inversion time: 650 ms, flip angle: 15°). The DTI were
obtained with a 2D echo-planar sequence (repetition time: 7200 ms, echo time: 80 ms, 70 slices, 2 mm isotropic
resolution, 24 diffusion gradient directions (b = 750 s/mm2) and 4 non-diffusion-weighted measurements. Dur-
ing reconstruction, images were interpolated to 1 × 1 mm in-plane resolution.
DTI and T1 processing. The following processing steps of the MR images were performed using the Functional
MRI of the Brain (FMRIB) software library (FSL), version 5.0.1041. Structural connectivity matrices were derived
from probabilistic tractography between 92 pre-defined regions-of-interest (ROIs). We used 78 cortical R OIs42
from the automated anatomical labeling (AAL) atlas43 defined in MNI standard space and 14 subcortical ROIs
from FIRST44 defined in T1-space. The pre-operative T1 scan was registered to the MNI template of the AAL
atlas, and the inverse transformation was used to convert the AAL ROIs to T1 subject space. Subsequently, the
cortical and subcortical ROIs were combined in T1 space. The rim of each ROI (i.e. the border between grey and
white matter) was used as a seed as well as a target point for probabilistic tracking. For the cortical ROIs, the
white matter mask was obtained using S IENAX45, and a rim of two voxels thickness was obtained by first dilating
the white matter mask and subsequently subtracting an eroded white matter mask. The resulting rim was mul-
tiplied with the AAL atlas in subject space to get rim masks for each cortical ROI. Rim masks of the subcortical
ROIs were calculated by eroding the subcortical masks by two voxels and subtracting this eroded mask from
the original subcortical masks. For the DTI images, head motion and eddy currents were corrected using EDDY
from FMRIB’s Diffusion Toolbox (FDT). The default of three fiber orientations were modelled per voxel using
BEDPOSTX46, and probabilistic tracking was done using PROBTRACKX2 in DTI space46. From each voxel in
the seed ROIS 5000 tracts were started (with a curvature threshold of 0.2 and step length of 0.5 mm) and were
terminated if one of the 91 target ROIs was reached. We discarded tracts with interhemispheric crossings outside
the corpus callosum or the fornix. The number of tracts between ROIs were not corrected for the size of the seed
or target region, as it is realistic that larger regions have more tracks than smaller regions.
Structural network. The sum of all tracts from each ROI to all other ROIs resulted in a weighted DTI con-
nectivity matrix. The tract counts were averaged in both directions to get a symmetrical matrix. The matrix was
binarized and thresholded to a connection density of 11%, to match the connection density of a literature-based
structural matrix obtained from 80 healthy s ubjects42. Additionally, we obtained an average matrix by averag-
ing all individual full weighted matrices and thresholded it to 11% connection density, and compared the main
results of using the individual matrices to results using the average matrix. We also compared the main results
using the binarized and thresholded matrices to results obtained using the weighted matrix without a threshold.
SIR model. To simulate the propagation of seizure activity on individualized structural brain networks we
used the susceptible-infected-recovered (SIR) model. The SIR model was initially derived to describe the spread-
ing of a pathogen or disease in a population modeled as a contact network. However, it has since been applied to
a variety of scenarios, from biological to social networks, as it captures the fundamental mechanisms involved
in spreading processes, whilst being computationally and mathematically simple. Thus, we applied it here to
model the propagation of ictal activity on a brain network from a set of seed nodes acting as the epileptogenic
region (see Supplementary Figure S.1A, B). Each brain region (nodes in the network) can be in one of three
states (S-I-R). Initially, all regions are susceptible (inactive, state S), except for a few active regions in the infected
state (active state, I) that constitute the hypothesized epileptogenic zone (EZ). The active regions can propagate
the activity to susceptible regions with probability β, but only if they are structurally connected. Thus, the prob-
ability that a certain region switches from susceptible to active at a given time step depends not only on β, but
also on its number of active neighbors (neighbors are connected regions). Active regions can turn inactive again
at each time step with probability γ, thereby becoming refractory such that they cannot be activated again (state
R). Eventually, after many time steps the dynamics will reach a steady-state and all regions will be inactive (either
in S or R states).
For a given network, the emerging behavior of the model depends only on the two control parameters β
(probability of transition S → I) and γ (probability of transition I → R). Moreover, the dynamic behavior of the
model is well known over a variety of network substrates, with a strong theoretical b asis40,42,47,48. Whilst the SIR
model is too simplistic to reproduce actual brain activity, it has been shown in the past that the SIS dynamics
near the critical point is enough to reproduce relevant characteristics of functional brain networks49. In the case
of seizure propagation, ictal activity can be regarded as an anomalous (infected) state that propagates over the
system taking advantage of the existing connectivity. In fact, highly detailed models of ictal activity and seizure
propagation usually introduce a slow variable to account for the propagation of the epileptic state throughout
the brain. This is then coupled with one or more fast variables mimicking the activity of each r egion27–29,32,50.
Considering the SIR model, we focus our analysis only on the propagation of ictal-like activity on the network,
and analyze the effect of different virtual resections on propagation.
The overall progression of the seizure can be measured by the fraction of active nodes at each time step, I(t).
I(t) follows a characteristic curve (a hyperbolic secant) when the spreading rate λ = β/γ is above the epidemic
threshold λc of the network40. Initially, I(t) increases exponentially when the process is dominated by the propaga-
tion of ictal activity. Eventually, I(t) reaches a maximum and decreases as most nodes fall into the inactive state.
Scientific Reports | (2021) 11:19025 | https://doi.org/10.1038/s41598-021-98046-0 4
Vol:.(1234567890)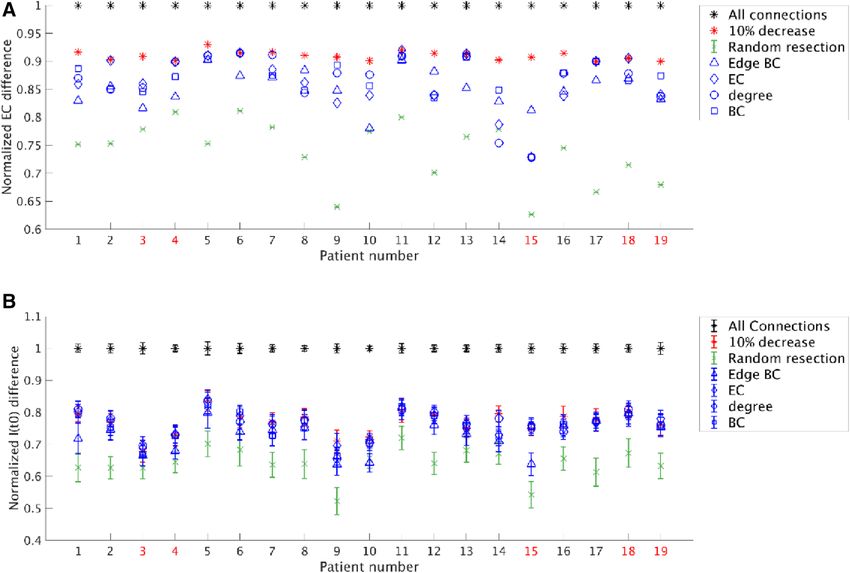
www.nature.com/scientificreports/
The height of the maximum I max characterizes the severity of the epidemic/seizure and, for a given network, it is
correlated to the initial propagation speed51. We therefore characterized the severity of seizure propagation by
the fraction of infected nodes at an early point of the propagation I(t0), with t0 = 10. I(t0) captures how steep the
slope of the propagation curve is at the beginning and indicates how fast the activity propagates.
Here, we ran the SIR model 10,000 times for 200 discrete time steps and averaged the number of active nodes
at each time step over the runs. The parameters were chosen such that the activity propagated to the entire brain
in most runs, i.e. on average 98% of the nodes were in the R state at the end of the run. We fixed γ = 0.03 and
increased β in steps of 0.001 until this criterion was met. β varied between 0.027 and 0.038 for the analyzed
patient cohort. The model was programmed and run in MATLAB (version R2012a and 2018b, The MathWorks
Inc., Natick MA, USA).
Surrogate for SIR model: Eigenvector centrality (EC) difference. We simulated the propagation
of seizure activity as an epidemic process using the SIR model, and quantified the effect of a resection using
the fraction of active nodes at time step 10. However, although this approach has a direct conceptual link with
clinical practice, it was computationally too expensive in combination with the optimization method used to
find optimal virtual resection strategies (see the section “Selecting connections: simulated annealing”). We have
therefore used an alternative, faster approach to quantify the effect of a resection on seizure propagation based
on a network metric, namely the reduction in centrality (after the virtual resection) of the hypothesized EZ
nodes. In the following paragraph we explain the theoretical foundation for this choice.
The temporal evolution of I(t) in the SIR model depends both on the model control parameters—namely β
and γ—and in the structure of the underlying network. For a given β and γ, I(t) is initially given (for very small
t) by the degree (defined as the number of neighbors) of the seed n odes40,52, so that a larger degree results in a
faster propagation. After a few steps, however, the degrees of the neighboring nodes, and of their neighbors and
so on, also influence the dynamics as they become infected. Thus, not only the degree of the seed but also the
topology of the network affects I(t). This global structure is reflected in another centrality measure: the Eigenvec-
tor centrality53 (EC). The EC of each node in the network indicates its participation in the dominant eigenmode
of the adjacency matrix. In particular, for a diffusion process such as a random walk, the EC of a node indicates
the probability that said node is occupied at a given t ime51. Although spreading and diffusion processes differ,
they do share many similarities and the EC can be related to the speed of spreading of an epidemic starting at
node I, as can be shown by the introduction of the pseudoinverse of the Laplacian54 (see also the SI, Sect. 2, for
details). Therefore, in this study we used the EC as a surrogate for how ictal activity propagates on the network.
In order to explicitly validate the use of EC as a surrogate metric of seizure propagation on our patient-specific
networks, we compared, for all patients, the EC of each node with the propagation at time t 0 = 10 (i.e. It=10)
when the same node was use as the (single) seed for the SIR model (see Fig. 7). Moreover, we also compared the
propagation using the whole resection area as the seed, with the EC of the seed, for all patients (Supplementary
Figure S.2). The strength of the correlations was measured with Pearson’s correlation.
Removing connections. Candidate connections for resection. The hypothesized EZ for each patient was
based on the location of the resection area. The 3-month post-operative T1-MRI of each patient was linearly co-
registered to a pre-operative T1-MRI using FSL FLIRT (version 5.0.10 with 12 parameter affine transformation).
The AAL ROIs were overlaid on the co-registered post-operative scan. The ROIs that by visual assessment fell
entirely or more than 50% within the resection area were labelled as hypothesized EZ nodes. To eliminate spread
in the SIR model, all connections from infected to susceptible nodes should be removed55. Our aim was to keep
the propagation of activity from the hypothesized EZ nodes to nodes outside the hypothesized EZ (hereafter
called neighboring nodes) minimal from the start. Therefore, we considered all binarized DTI connections from
hypothesized EZ nodes to neighboring nodes as candidate connections for removal in the virtual resections.
Note that all these candidate connections had been removed during the actual surgery.
Measure of effect. The choice of which connections to remove from the candidate connections was based on the
effect of their removal, quantified here as the EC difference of the hypothesized EZ (Fig. 1). The EC difference is
the difference in average EC of the hypothesized EZ nodes after removal of connections compared to the aver-
age EC before the removal. The EC difference, quantifying the reduction in centrality of the hypothesized EZ,
was used as a surrogate measure of the reduction in speed with which a seizure propagates. In order to compare
between different patients, we also used the normalized EC difference, defined as the fraction between the EC
difference for a given resection and that for a total resection. Once an optimal virtual resection for a given size
had been found using this surrogate approach (see below), the actual effect of the virtual resection was measured
as the change in seizure propagation, given by I(t0). Similar as for the EC difference, we also defined the normal-
ized change in seizure propagation, namely as the change in I(t0) after the resection was applied, divided by the
change in I(t0) following a full resection. Note that, given that the seed remains in the network after the virtual
resection, and is infected, I(t0) > 0 also for complete seed disconnection.
Selecting connections: simulated annealing. Generally, a large number of virtual resections are possible, mean-
ing that many different combinations of connections can be removed. Testing each of these combinations con-
stitutes an intractable combinatorial problem and we have therefore used simulated a nnealing56 as optimization
method to find the optimal combination, i.e. the one resulting in the largest effect (the largest EC difference as a
surrogate measure of largest reduction in the speed of seizure propagation). We used a MATLAB implementa-
tion of simulated annealing (J. Vandekerckhove, general simulated annealing algorithm, version 1.0.0.0., MAT-
LAB Central File Exchange) to optimize for a large EC difference. As we aimed to maximize the EC difference,
Scientific Reports | (2021) 11:19025 | https://doi.org/10.1038/s41598-021-98046-0 5
Vol.:(0123456789)www.nature.com/scientificreports/
Figure 1. Illustration of the EC difference of the SOZ. The EC of each node is based on the full network (nodes
inside and outside the SOZ). First, the EC is averaged over the nodes in the SOZ. After removing connections,
the EC per node is re-calculated based on the resected network. Subsequently, the EC is averaged over the SOZ
nodes again. The difference in EC of the SOZ nodes is the EC before removal minus the EC after removal. Parts
of the figure were visualized with the BrainNet Viewer toolbox (Xia et al. 2013) (http://www.nitrc.org/projects/
bnv/).
the algorithm minimized the negative value of the EC difference (object function = − EC difference). Simulated
annealing optimized the combination of a fixed number of candidate connections (i.e. for a fixed resection
size), after it was given an initial guess containing a random selection among all candidate connections. The
algorithm considered neighboring states that were generated from the previous state, in our case by changing
one of the currently selected connections. We used the default parameters of the implemented algorithm (initial
temperature: 1, stopping temperature: 10–8, annealing schedule: f(T) = 0.8 T, maximum number of consecutive
rejections: 1000, maximum number of tries within one temperature: 300, maximum number of successes within
one temperature: 20).
Simulated annealing was repeated for different resection sizes, hence an optimal EC difference was obtained
for each resection size. The largest global EC difference is achieved when removing all candidate connections,
which equals the EC of the hypothesized EZ in the un-altered network. This trivial solution with an effect of 100%
was used as the reference point. However, the relation between the resection size and optimal EC difference was
non-linear: the first removed connections contributed more to the effect than the last removed connections. In
fact, for larger resection sizes the EC difference grew sub-linearly, until increasing the size led to only a small
subsequent increase in the EC difference. This means that we can accept for instance a 10% decrease in effect,
while sparing substantially more than 10% of the connections. Here, we chose a resection with a slightly smaller
effect (10%), but where several connections could be spared (Fig. 2). We defined the optimal resection (with a
given number of connections, referred to here as the optimal size) as the one that achieved 90% of the effect of a
full resection. The actual threshold is thus arbitrary, chosen here to take advantage of the non-linear dependence
of the EC difference on the resection size and to maintain most (90%) of the effect of the full resection. Small
changes in this threshold also would lead to small quantitative changes in the results, but would not affect the
main findings. To summarize, the goal was to reduce seizure propagation by removing connections and at the
same time sparing the brain as much as possible.
Comparison to other selection methods that are based on network measures or random selec-
tion. So far, the effect that removal of a connection (i, j)—where i is a node in the hypothesized EZ and j a
neighboring node that does not belong to the EZ—had on the EC of the hypothesized EZ (in combination with
the removal of other connections) determined whether that connection was included in the optimal resection.
Other criteria could be used to determine the importance of a connection in the structural network based on
different centrality measures:
1. Betweenness centrality of the edge (i, j) (edge BC), defined as the number of shortest paths in the network
that go through the edge (i, j)57,58,
2. Eigenvector centrality (EC) of the neighboring node j 53,
3. Degree (defined as the number of neighbors) of the node j37, and
4. Betweenness centrality (BC)59, of the neighboring node j.
The brain connectivity toolbox in MATLAB (version 2017-15-01)60 was used for calculating edge BC, EC and
BC. We determined the effect of a resection with the optimal size (the same size as found by the simulated anneal-
ing algorithm), but choosing the connections based on these network measures. For comparison, the effects of
resections with the same number of randomly selected connections among the candidate connections were also
computed (average and standard deviation for 100 random selections). For the comparison, we used both the
actual effect of a resection, as given by I(t0), and the surrogate metric given by EC difference of the resection.
Scientific Reports | (2021) 11:19025 | https://doi.org/10.1038/s41598-021-98046-0 6
Vol:.(1234567890)www.nature.com/scientificreports/
Figure 2. Workflow of selecting the connections to remove for each patient. The patient’s DTI connectivity
matrix of white matter tract density between 92 ROIs is thresholded and binarized to a connectivity density
of 11%. This connectivity matrix is the basis for the structural network. Subsequently, the connections from
SOZ nodes to nodes outside the SOZ are identified—they were all severed in the surgery. Those connections
are candidates for the virtual resection in our model. For each number of removed connections, the optimal
choice of connections is found using simulated annealing. Simulated annealing optimizes for those connections
that upon removal result in the largest EC difference of the SOZ. After the maximal achievable EC difference
has been found for each number of removed connections, the number of connections yielding 90% of the
EC difference compared to the maximum (when removing all connections) is found and removed. Because
removing the first few connections has a larger effect than removing further connections, a relatively large
number of connections can be spared yet still achieving an almost maximal effect. The rationale behind the
method is illustrated with the propagation of activity (red brain regions indicate active regions at the same time
after seizure onset): removing the connections that decrease the EC of the SOZ results in a decrease in speed
with which activity propagates. Parts of the figure were visualized with the BrainNet Viewer toolbox (Xia et al.
2013) (http://www.nitrc.org/projects/bnv/).
Statistics. The network characteristics of the connections from the hypothesized EZ that were spared were
compared to those that were removed using an unpaired Student’s t test. We compared the (i) edge BC, and the
(ii) EC, (iii) degree, and (iv) BC of the node outside the hypothesized EZ to which a removed/spared edge was
connected. The p-values were corrected for multiple comparisons using the false-discovery rate (FDR)61.
We also compared the efficacy of the resections found by different resection strategies, as given by both the
EC difference and the propagation I(t0), using a paired Student’s t test (significance level: 0.05). Finally, we used
an unpaired Student’s t test to compare the initial propagation I(t0) (before any resections), the EC of the seed
(equal to the EC difference of a full resection) and the propagation I(t0) after the optimal resection of the seizure-
free patients to those for the patients who were not seizure-free. The two surgical outcome groups were also
compared for size (unpaired Student’s t test) and location (Chi-square test) of the hypothesized EZ, as indicated
by the number of removed nodes and the indices (in the AAL atlas) of these nodes, respectively.
Scientific Reports | (2021) 11:19025 | https://doi.org/10.1038/s41598-021-98046-0 7
Vol.:(0123456789)www.nature.com/scientificreports/
Figure 3. Example of selecting the connections to remove for patient 15. (A) The selection was found separately
for each number of connections using simulated annealing and the EC difference. After the removal of some
connections from the SOZ to the rest of the brain, the EC difference of the SOZ increased. Removing all
connections as in the surgery resulted in the highest EC difference. However, a 10% smaller decrease in EC
was achieved by removing only 25 of the 38 connections, thereby sparing 13 connections (red star). (B) We
calculated the actual effect of each resection on the seizure propagation model by measuring I(t0) after the
resection took place. I(t0) decreases in a roughly linear manner with the number of removed connections.
The red star indicates the resection corresponding to a 90% decrease in EC difference. Errorbars indicate the
standard deviation among 10 iterations of the SIR model averaged over 1000 realizations. (C) The connections
from the SOZ to the brain regions outside the SOZ are displayed, including the 13 spared connections (green).
Parts of the figure were visualized with the BrainNet Viewer toolbox (Xia et al. 2013) (http://www.nitrc.org/proje
cts/bnv/).
Results
The structural brain networks of 19 patients with temporal (n = 15) and extratemporal (n = 4 frontal) epilepsy
were analyzed. After surgery, 14 patients were classified as Engel class 1 and were labelled as SF, whereas 5 patients
were classified as Engel class 2–4 and labelled as NSF. First, the analysis was applied to all patients individually,
followed by a comparison of the two surgical outcome groups.
For each patient, the virtual resection was optimized by simulated annealing, for each resection size. An
example of the analysis for one of the patients is shown in Fig. 3. The optimal EC difference increased non-linearly
as more connections were removed (Fig. 3A); this was the case for all patients. Seizure propagation (given by
I(t0)) decreased with the resection size, in an approximately linear manner (Fig. 3B). The non-linearity in EC
difference meant that the first removed connections had a greater contribution to the total effect than the last
removed connections. Trivially, the largest EC difference was achieved when all connections were removed, i.e.
corresponding to the resection that was performed during the actual surgery. Accepting a 10% smaller EC dif-
ference compared to the maximal EC difference spared 13 of the 38 connections (34.21%, which is substantially
more than 10%) in this example. This meant that 90% of the effect was obtained by removing only 25 (65.79%)
of the candidate connections. The spared and removed connections are displayed in Fig. 3C. To conclude, the
virtual resection was one-third smaller in this patient than the actual surgery, whilst achieving almost the same
(90%) effect in terms of reducing the EC of the seed.
Analysis of optimal virtual resections: EC. The optimization results for all patients are shown in
Fig. 4A. Our optimization approach of sparing connections whilst achieving a 90% effect (average: 90%, stand-
ard deviation: 0.8%) was compared to other resection strategies based on network characteristics, or random
resections. On average, 27.49% (standard deviation: 4.65%) of the connections were spared when allowing for
a 10% reduction in effect. The optimization strategy performed better (obtaining a larger reduction in EC) than
a random resection of the same size in all patients which, on average, led to a 36% (standard deviation: 6%)
decrease in effect. The difference (90% effect-random = 0.170) was significant (t(18) = 13.80, p = 5e–11). How-
ever, the effect varied between patients: in some patients optimizing the resection strategy yielded much better
results than in others.
The removal of connections on the basis of their, or their connected neighboring nodes’, network characteris-
tics was also more effective on average than a random resection [mean decrease in effect (and standard deviation):
edge BC: 0.15 ± 0.30, EC: 0.14 ± 0.05, degree: 0.13 ± 0.13, BC: 0.13 ± 0.04], and the difference was significant: edge
BC-Random = 0.112, t(18) = 8.02, p = 2e–7; EC-Random = 0.125, t(18) = 10.65, p = 3e–9; degree-Random = 0.125,
t(18) = 9.64, p = 1.6e–8; BC-Random = 0.128, t(18) = 10.60, p = 4e–9. Moreover, the removal based on the network
metrics performed better than the random removal for most individual patients (edge BC: 18/19 patients; EC:
17/19 patients; degree: 17/19 patients; BC: 18/19 patients).
In all patients, our approach performed better than or equally to optimization based on the network char-
acteristics of the connections or their connected neighboring nodes. On average, the optimization approach
Scientific Reports | (2021) 11:19025 | https://doi.org/10.1038/s41598-021-98046-0 8
Vol:.(1234567890)www.nature.com/scientificreports/
Figure 4. Comparison of various resection strategies for all patients as measured by the normalized EC
difference and the normalized difference in I(t0), respectively in panels (A) and (B). (A) The normalized EC
difference for a resection is defined as the ratio between the EC difference for the optimal resection and the EC
difference for a full resection. Removing all connections resulted in the largest EC difference (100%, black stars).
A 10% decrease in the EC difference was accepted (red stars), using simulated annealing to optimize which
connections to remove, and thereby sparing connections. This method performed better than the average of
100 random resections (green cross with standard deviation), using the same number of removed connections
chosen randomly from the candidate connections. For comparison, the same number of removed connections
were also chosen using network measures: edge BC (blue triangles), EC (blue diamonds), degree (blue circles),
and BC (blue squares). The three latter measures were based on the property of the connected node outside the
SOZ. (B) The normalized I(t0) difference for a resection is defined as the difference between I(t0) before and
after the resection, normalized by this difference for a full resection. Similarly to the EC difference, removing all
connections (black stars) resulted in 100% decrease of I(t0). The optimal resection given by the surrogate model
(red stars) performed marginally better than the resections based on network metrics (blue markers) for some
patients. Random resections (green markers) performed the worst. All values correspond to the same resections
used in panel A. The error bars were calculated as in Fig. 3. The not seizure-free patients are marked in red in
both panels.
performed significantly better than all network metrics (optimal-edge BC = 0.058, t(18) = 9.16, p = 3e–8; optimal-
EC = 0.045, t(18) = 4.11, p = 7e–4; optimal-degree = 0.045, t(18) = 4.00, p = 8e–4; optimal-BC = 0.042, t(18) = 4.56,
p = 2e–4). However, there were differences among the network measures in the effect that could be achieved.
In one patient (patient 11), all of the network measures performed equally to our optimization approach. In all
other patients, the largest effects among the network measures were achieved when the resection strategy was
based on the EC of neighboring nodes to which outgoing edges of the hypothesized EZ connected (note: not to
be confused with the EC difference of the hypothesized EZ), followed by BC, degree and edge BCs. The resec-
tion strategies based on network measures achieved the same effect as our optimized strategy in 8 patients. This
shows that some connections, or the neighboring nodes to which they are connected, are more important than
others in achieving a large effect. The most important connections are those that connect the hypothesized EZ
to a neighboring node with high EC. There were no significant differences in the average performance of the
edge BC, EC, degree and BC based resections.
Analysis of optimal virtual resections: I(t0). We repeated the comparison with random resections and
resections based on network metrics for the actual effect of the resection (measured as the decrease in I(t0)). The
results for all patients and resection strategies are shown in Fig. 4B. On average, the optimal resection achieved
a 77% ± 4% decrease in propagation, random resections achieved a 64% ± 5% decrease, whereas the network
metric based resections achieved a 73% ± 5%, 76% ± 4%, 76% ± 4% and 76% ± 5% decrease, respectively for the
edge BC, EC, degree and node BC.
Scientific Reports | (2021) 11:19025 | https://doi.org/10.1038/s41598-021-98046-0 9
Vol.:(0123456789)www.nature.com/scientificreports/
Figure 5. Do the network characteristics of the spared and removed connections differ? A 10% decrease in
EC difference spared several connections (compared to a full resection). The network characteristics of the
connections that were spared were compared to those that were removed. The network characteristics were
edge BC of the connection (A), as well as EC (B), degree (C), and BC (D) of the node outside the SOZ that
was connected to a SOZ node with the connection in question. Connections to hub nodes were removed
significantly more often than they were spared. The p-values were corrected for multiple comparisons using
FDR.
As in the previous analysis, we found that the optimal resection performed better than a random resec-
tion for all patients, and significantly better on average (optimal-random = 0.127, t(18) = 13.25, p = 1.0e–10).
It also performed better on average than the network metrics based resections, although the difference was
only significant for the edge BC and nodal BC metrics (optimal-edge BC = 0.039, t(18) = 5.12, p = 7e–5; opti-
mal-EC = 0.006, t(18) = 1.36, p = 0.19; optimal-degree = 0.005, t(18) = 1.23, p = 0.2; optimal-nodal BC = 0.012,
t(18) = 2.53, p = 0.021). Moreover, resections based on edge BC performed on average significantly worse than
resections based on other network metrics (EC-edge BC = 0.033, t(18) = 4.20, p = 5e–4; degree-edge BC = 0.033,
t(18) = 4.38, p = 4e–4; nodal BC-edge BC = 0.026, t(18) = 3.45, p = 3e–3). Overall, resections based on the nodal
degree or the EC had a larger effect on propagation than resections based on BC, as expected from theory: the
node’s degree and EC strongly influence SIR dynamics (Barrat et al., 2009; Pastor-Satorras et al., 2015) (although
the differences among the performance of the resections based on the EC, degree and BC of the neighboring
node were not significant).
The resections based on the network metrics also performed better than random resections for all patients,
and significantly better on average (edge BC-Random = 0.088, t(18) = 8.98, p = 5e–8; EC-Random = 0.121,
t(18) = 11.87, p = 6e–10; degree-Random = 0.121, t(18) = 12.85, p = 1.7e–10; BC-Random = 0.114, t(18) = 11.39,
p = 1.2e–9).
Characteristics of removed connections. These results lead to the question: do the network measures
differ between the spared and removed connections? To this end, we compared the network characteristics of
the spared versus the removed connections (Fig. 5). All network measures were significantly different between
the two groups of connections: edge BC (t(546) = − 6.20, 95% CI = (− 14.68, − 7.62), p = 1.09e-9), EC of the
neighboring node (t(546) = − 18.24, 95% CI= (− 0.09, − 0.07), p = 8.94e-58), degree of the neighboring node
(t(546) = − 18.15, 95% CI= (− 6.57, − 5.29), p = 1.12e-57), and BC of the neighboring node (t(546) = − 11.63, 95%
CI= (− 0.03, − 0.02), p = 5.66e-28 ). Hence, central connections and connections from the hypothesized EZ to
hubs were removed significantly more often than they were spared. This makes sense intuitively: removing hub
nodes or central connections limits the propagation of activity across the network. Thus, the network measures
indicated that connections to neighboring hubs, or central connections, should be removed.
Scientific Reports | (2021) 11:19025 | https://doi.org/10.1038/s41598-021-98046-0 10
Vol:.(1234567890)www.nature.com/scientificreports/
Figure 6. Seizure-free (SF) compared to not seizure-free (NSF) patients. (A) The seizure propagation as
measured by I(t0) before the virtual resection was not different between the SF (n = 14) and NSF (n = 5) patient
groups. (B) The EC of the seed (which is equal to EC difference for a full resection) was marginally larger for
the NSF group than for the SF group, although the difference was not significant (t(17) = 1.95, p = 0.07). (C)
The seizure propagation after the optimal resection that led to a 90% EC difference, measured by I(t0) after the
resection, did not differ between the groups. The groups did not differ in the size or location of the SOZ.
Surgery outcome. We compared the surgical outcome groups to differentiate between the success of the
optimized resection plans. The previous analysis (Fig. 4) did not indicate any obvious differences between SF
and NSF with regards to the performance of different resection strategies. In Fig. 6 we compared the two groups
with respect to seizure propagation (as measured by I(t0), panels a and c) and EC of the hypothesized EZ (panel
b). Initially (before any resections), there was no difference in propagation between the groups (Fig. 6a), but we
found a marginal, non-significant difference (p = 0.07) in the EC of the hypothesized EZ (which is equal to the
EC difference, Fig. 6b), with the NSF group having a larger EC difference than the SF group. Consequently, the
absolute decrease in EC difference for a total resection and for the optimal resection was also (not significantly)
larger for the NSF group compared to the SF group (data not shown), since these metrics equal respectively
100% and 90% of the EC of the seed itself. We did not find a significant difference between the two groups in
propagation I(t0) for the optimal resection either (Fig. 6c). The two groups did not differ in the size (t(17) = 0.26,
95% CI = (− 2.09, 2.69), p = 0.78 or location (temporal versus extratemporal: χ2(1) = 0.0045, p = 0.95) of the
hypothesized EZ.
Effect of the network backbone. Using the averaged structural matrix, the number of candidate connec-
tions was 26.89 ± 6.81, compared to 28.84 ± 7.79 using the individual matrices (see Supplementary Information
Sect. 3, Supplementary Figure S.3 and Supplementary Table S.1). There were no significant differences between
using the average or individual matrices in the fraction of connections that had to be removed to achieve a 90%
effect (paired t-test: t(18) = − 2.09, p = 0.51) or in the achieved EC difference at 90% (paired t-test: t(18) = − 1.38,
p = 0.19).
Using the weighted structural matrix without thresholding, the number of candidate connections increased
from an average of 28.84 ± 7.79 in the thresholded and binarized network to an average of 312.68 ± 109.59 in the
weighted network without threshold, as all connections were included (see Supplementary Information Section 4,
Supplementary Figure S.4 and Supplementary Table S.2). The EC difference at 90% did not differ significantly
between the two analyses (paired t-test: t(18) = 1.38, p = 0.18). However, a significantly smaller fraction of con-
nections had to be removed for the weighted network (0.04 ± 0.01) compared to the binary network (0.72 ± 0.05)
(paired t-test: t(18) = 60.55, p = 2.94e-22). This result is not surprising, given that in a weighted network the
strongest candidate connections have an unproportionally high influence on the EC and, consequentially, the
removal of the few strongest ones suffices to decrease the EC to 90% of the full effect. To alleviate this unpropor-
tional contribution to the EC, we took the logarithm of the weights and repeated the analysis. For the weighted
log networks (see Supplementary Information Section 4, Supplementary Figure S.5 and Supplementary Table S.3),
there was no significant difference in the fraction of removed connections (0.74 ± 0.07) compared to the binary
networks (0.72 ± 0.05) (paired t-test: t(18) = − 1.08, p = 0.30). Additionally, the weighted resection was mostly
included in the binary resection (average: 83%).
Validation of surrogate model. For the validation of the EC of the hypothesized EZ as a surrogate for
seizure propagation, we compared, for all patients, the EC of each node with the initial speed of propagation
(It=10) in the SIR model (Fig. 7), which revealed a strong correlation with an average of 0.95 ± 0.02. Moreover, we
also compared in the Supplementary Information (Supplementary Figure S.2) the propagation I t=10 when using
the whole resection area as the seed with the EC of this seed, rescaled by the seed size, for all patients. We found
a strong correlation of 0.78 despite the fact that each data-point corresponded to a different patient-network set.
Scientific Reports | (2021) 11:19025 | https://doi.org/10.1038/s41598-021-98046-0 11
Vol.:(0123456789)www.nature.com/scientificreports/
Figure 7. Correlation of the nodal EC with the SIR model for all patients. The EC was calculated for each of
the 92 nodes in the structural network. For the SIR model, each node was activated separately at the start (only
one seed) and the number of active nodes at time 10 ( It=10) was averaged over 10,000 runs. The correlation was
measured independently for each patient (thin coloured lines); on average the Pearson’s correlation coefficient
was 0.95 ± 0.02. When considering all data points together, the correlation decreased to 0.88 but was still strong.
It is therefore valid to use the EC difference of the hypothesized EZ as a proxy for the speed of seizure propaga-
tion in the SIR model.
Taken together, the effect of our approach varied among patients and certain connections contributed more
than others. Removal of connections to hub nodes or central connections resulted in a larger effect, as this prob-
ably limits the propagation of activity. NSF patients showed a larger decrease in EC than SF patients after con-
nection removal (although the difference was not significant), which was due to a large EC of the hypothesized
EZ before the resection.
Discussion
Summary. We presented a computational model based on structural brain networks of individual patients
and evaluated the effect of virtual resections on seizure propagation in a preliminary study. Together with the SIR
model, we developed a surrogate, namely the EC difference, which correlated strongly with the SIR model results
and was computationally feasible. Additionally, we solved the computational problem of not being able to test all
possible combinations of connections by using simulated annealing, which selected the optimal combination of
connections. We found that, when allowing for a 10% decrease in effect compared to removing all connections
as in the actual surgery, substantially more than 10% of the connections could be spared. This means that we
were able to make smaller resections with almost the same effect as the actual surgery in our patient cohort. This
approach performed better than a randomly selected removal of the same number of connections, and better or
equal to removal based on network measures. For the network measures, the best performance was achieved by a
selection based on the EC of the neighboring node outside the hypothesized EZ to which a removed connection
was connected. Importantly, the effect of our approach varied per patient. Some connections contributed more
to the effect than others: the connections to neighboring hub nodes were preferably removed. NSF patients had
a tendency to a larger EC of the hypothesized EZ before the virtual resection (although the difference was not
significant, p = 0.07), which could not be explained by differences in size or location of the hypothesized EZ. This
may suggest that patients with a stronger pathological hub in the SOZ may need a more extensive resection or
disconnection to become seizure-free.
Smaller resection area. We found that with a slightly smaller effect than the actual surgery many connec-
tions could be spared. Our reference was the removal of all connections that were cut during the actual surgery,
namely the connections from the hypothesized EZ to the rest of the brain. A roughly similar reference was
taken by Olmi and colleagues, who in their model also removed connections selected from those cut during the
actual surgery27 and started modelled seizures in the hypothesized EZ. Instead of measuring the effect of remov-
ing connections (as in our approach), Olmi et al.27 aimed for the same effect that the actual surgery had in the
model, namely no seizure propagation. They found that it was possible to achieve the same effect as the actual
surgery with removing far fewer connections. Moreover, they also found that the model-based virtual resec-
tions outperformed those based on random resections or on the network metrics alone, as in our study. Olmi
and colleagues also found that some network characteristics of the seed regions predicted better than others the
number of removed connections in the optimal resection. In particular, they found the node efficiency, cluster-
ing coefficient and betweenness centrality to be stronger predictors of the number of removed connections
than node strength, degree or closeness centrality. This relates to our finding that the network characteristics of
the removed and spared connections are different, and similarly we also found a larger difference for the node
betweenness centrality than for the degree. Thus, although not enough to define the optimal resection, network
Scientific Reports | (2021) 11:19025 | https://doi.org/10.1038/s41598-021-98046-0 12
Vol:.(1234567890)You can also read