Optimal cut-offs of five anthropometric indices and their predictive ability of type 2 diabetes in a nationally representative Kenyan study - AIMS ...
←
→
Page content transcription
If your browser does not render page correctly, please read the page content below
AIMS Public Health, 8(3): 507–518.
                                                                        DOI: 10.3934/publichealth.2021041
                                                                        Received: 06 May 2021
                                                                        Accepted: 06 July 2021
                                                                        Published: 09 July 2021
http://www.aimspress.com/journal/aimsph

Research article

Optimal cut-offs of five anthropometric indices and their predictive ability of
type 2 diabetes in a nationally representative Kenyan study

Anthony Muchai Manyara*

Social and Political Sciences, Institute of Health and Wellbeing, University of Glasgow, Glasgow, UK

* Correspondence: Email: muchai.manyara@gmail.com; Tel: +254748686334.

Abstract: Background: Type 2 diabetes (T2D) is one of the top non-communicable diseases in Kenya and
prevention strategies are urgently needed. Intervening to reduce obesity is the most common prevention
strategy. However, black populations develop T2D at lower obesity levels and it is unclear which
anthropometric cut-offs could provide the best predictive ability for T2D risk. This study, therefore, aimed
to determine the optimal anthropometric cut-offs and their predictive ability of T2D in Kenya. Methods:
The study included 2159 participants (59% women) aged 35–70 years from the Kenya STEPwise survey
conducted in 2014. Five anthropometric indices were used—body mass index (BMI), waist circumference
(WC), waist to hip ratio (WHR), waist to height ratio (WHtR) and waist divided by height0.5(WHt.5R).
Diabetes was defined as a fasting blood glucose of ≥7.0 mmol/l or a previous diagnosis by a health worker.
Optimal anthropometric cut-offs and their receiver operating characteristics, such as the area under the
curve (AUC), were computed. Results: Overall, the optimal cut-off for BMI, WC, WHR, WHtR and
WHt.5R were 24.8 kg.m-2, 90 cm, 0.88, 0.54 and 6.9. On disaggregation by sex, the optimal cut-off for
BMI, WC, WHR WHtR and WHt.5R was 27.1 kg.m-2, 87 cm, 0.85, 0.55 and 6.9 in women, and 24.8 kg.m-
2
 , 91 cm, 0.88, 0.54 and 6.9 in men. Overall, WC (AUC 0.71 (95% confidence interval 0.65, 0.76)) WHtR
(AUC 0.71 (0.66, 0.76)) and WHt.5R (AUC 0.70 (0.65,0.75)) had a better predictive ability for T2D than
BMI (AUC 0.68 (0.62, 0.73)). Conclusions: WC, WHtR and WHt.5R were better predictors of T2D than
BMI and should be used for risk stratification in Kenya. A WC cut-off of 87cm in women and 91cm in
men, a WHtR cut-off of 0.54 or a WHt.5R of 6.9 in both men and women should be used to identify
individuals at an elevated risk of T2D.

Keywords: diabetes; prediction; anthropometric cut-offs; Kenya; Africa; waist circumference; waist-
to-height ratio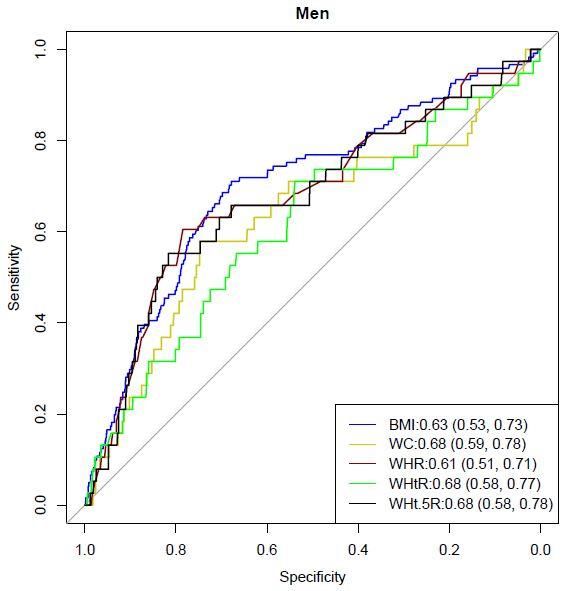
508

Abbreviations: BMI: Body Mass Index; WC: Waist Circumference; WHrR: Waist-to-Height Ratio;
WHR: Waist-to-Hip Ratio; WHt.5R: waist divided by height0.5; ROC: Receiver Operating Curve; T2D:
Type 2 Diabetes; AUC: Area Under the Curve; SSA: Sub-Saharan Africa; CI: Confidence Intervals;
SD: Standard Deviation; WHO: World Health Organisation.

1.   Introduction

      The prevalence of diabetes is on the rise in sub-Saharan Africa (SSA) exerting a disease and
economic burden [1]. Type 2 diabetes (T2D), the main form of diabetes, is preventable through
lifestyle modification (e.g. weight loss) [2]. Excess body fat is an important risk factor for T2D and
anthropometric indices that estimate body fat, such as body mass index (BMI), waist circumference
(WC), waist to hip ratio (WHR), and waist to height ratio (WHtR), have been used to predict risk [3].
However, debate remains on which is the best index to stratify risk. Despite BMI being the most used
index it has been challenged on its inability to: 1) differentiate between body lean mass and fat mass;
and 2) detect the location of body fat [4]. On the other hand, central obesity indices (WC, WHR,
WHtR), that are proxies of visceral fat, may be better measures of risk as visceral fat is more important
for T2D development than peripheral fat [5]. Consequently, a meta-analysis of 20 studies reported that
WHtR and WC provide a more robust measure for detecting T2D than BMI [6]. Apart from the four
common anthropometric indices, new indices have recently been proposed. The waist divided by
height0.5 (WHt.5R) has been found to be a better predictor of cardiometabolic risk than BMI, WC,
WHR, and WHtR [7] although it is relatively understudied.
      In SSA, several studies have reported that central obesity indices are better predictors of T2D than
BMI [8–14]. However, it remains unclear which index has a better predictive ability. For instance, in
Ghana and Ethiopia, WHR was a better predictor of T2D in three studies [9,12,13] while WC was a
better predictor of T2D in five studies from Ethiopia, Cameroon, Kenya, and Guinea [8,10–13]. Further,
there is increasing evidence that black populations develop T2D at lower obesity levels compared to
whites, and therefore current anthropometric cut-offs may be less appropriate for them. For example, the
age-adjusted prevalence of T2D in whites at 30 kg.m-2, WC of 102 cm in men, and 88 cm in women
equated to a similar prevalence at a BMI of 26 kg.m-2, WC of 88 cm and 79 cm in men and women
respectively in the black populations in the UK [15]. There is emerging but limited evidence of the
optimal cut-offs to predict T2D in SSA. In Ghana, the optimal cut-offs for BMI, WC and WHR were
26.2 kg.m-2, 91.7 cm and 0.88 for women, and 26.7 kg.m-2, 83.4 cm and 0.90 for men [9]. Recently, an
Ethiopian study reported that the optimal cut-offs for BMI, WC, WHR and WHtR were 20.5 kg.m-2, 82.9
cm, 0.86 and 0.51 in women, and 23.0 kg.m-2, 88.6 cm, 0.97 and 0.52 in men [13]. The optimal
anthropometric cut-offs and their predictive ability of T2D in Kenya remain understudied. Therefore,
this study aimed to determine the optimal anthropometric cut-offs of five indices (BMI, WC, WHR,
WHtR, WHt.5R) for predicting T2D in Kenya and compare their predictive ability.

2.   Materials and methods

     The study used data from the Kenya STEPwise survey 2014 which was a nationally
representative study that investigated non-communicable diseases risk factors. A multi-stage cluster
sampling method was used to recruit 4500 participants aged 18–70 years. Data were collected by

AIMS Public Health                                                              Volume 8, Issue 3, 507–518.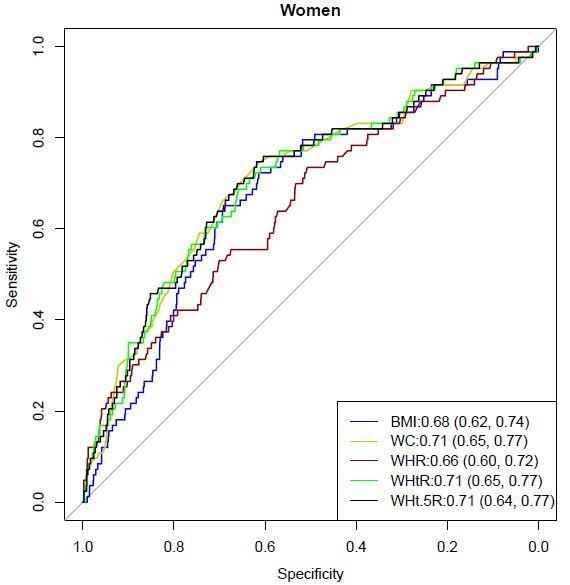
509

trained personnel and involved the administration of a questionnaire, physical and biological
measurements [16]. More information on the survey can be found elsewhere [16].

2.1. Inclusion and exclusion criteria

     Figure 1 shows the inclusion and exclusion of study participants. To limit analyses to type 2
diabetes cases, we included participants between 35 and 70 years of age as type 2 diabetes prevalence
increases with age [17] and type 1 diabetes is relatively low from ≥35 years of age [18]. A total of
2159 participants with complete data on all anthropometric measures and diabetes diagnosis were
included in the analysis.

                       Figure 1. Inclusion and exclusion of study participants.

2.2. Data collection procedures and definitions

     Height was measured in centimetres using a portable stadiometer and weight was measured in
kilogram using a portable electronic weighing scale. Waist circumference was measured at the
umbilicus level using a constant tension tape. Blood pressure was measured three times using an
automated blood pressure measuring instrument (OMRON®). A minimally invasive prick was used
to draw a blood sample and CardiocheckPA analyser® was used to measure blood glucose levels [16].
Body mass index was calculated by dividing weight in kilograms by height in metres squared. It was
categorised into: underweight (
510
2.3. Ethics approval and consent to participate
The study was approved by the Kenya Medical Research Institute’s Ethics Review Committee
(SSC No. 2607). Informed written consent was sought from all participants before data collection.
2.4. Analysis
All data analysis was done using R statistical package version 3.5.2 [21]. Means and standard
deviations were used to summarise continuous variables, and frequencies and percentages used to
summarise categorical variables. The Analysis of Variance and the Chi-Square tests were used to assess
significant sex differences in continuous and categorical variables, respectively. Associations between
T2D and anthropometric indices were determined using logistic regression models and odds ratios (with
95% confidence intervals). Model 1 was unadjusted and model 2 was adjusted for age, residence
(rural/urban), education level, wealth index and systolic blood pressure. The anthropometric indices were
standardised in the models to determine the effect of one standard deviation increase on odds of T2D.
The ‘OptimalCutpoints’ package was used to compute the optimal anthropometric cut-offs and their
receiver operating characteristics (ROC) using the Youden Index. The characteristics computed were:
the Area Under the Curve (AUC), sensitivity, specificity, positive predictive value, and negative
predictive value associated with each cut-off [22]. The ‘pROC’ package was used to compare the AUC
of anthropometric measures using BMI as the reference [23]. The ROC curves of all five anthropometric
indices were plotted to show sensitivity (y-axis) and specificity (x-axis). Data are presented for the
overall sample and by sex disaggregation. A statistical significance level of p < 0.05 was used.
3. Results
Table 1 presents the characteristics of the 2159 study participants included in the analyses. The
average age was 48 years, and the diabetes prevalence was higher in women (6.5%) compared to men
(4.3%). The majority of both women and men were of normal weight status.
Table 2 shows the associations between anthropometric indices and T2D. Each standard
deviation increase in all the five anthropometric indices was associated with a higher T2D risk in
both the overall sample and in women in model 2. In men, BMI, WHR and WHtR were not
associated with T2D but each standard deviation increases in WC and WHt.5R were associated
with higher odds of T2D in model 2.
AIMS Public Health Volume 8, Issue 3, 507–518.511
Table 1. Characteristics of study participants disaggregated by sex.
All (n = 2159) Women (n = 1271) Men (n = 888) P value (Women vs. Men)
Age [mean ±SD] 48.1 ±9.9 48.4 ±10.0 47.7 ±9.8 0.118
Residence
Rural 1196 (55.4) 755 (59.4) 441 (49.7)512
Table 2. Associations between anthropometric indices and T2D in overall sample, women, and men.
Model 1 Model 2
Odds ratio (95% CI) P value Odds ratio (95% CI) P value
All
BMI 1.45 (1.25, 1.67)513
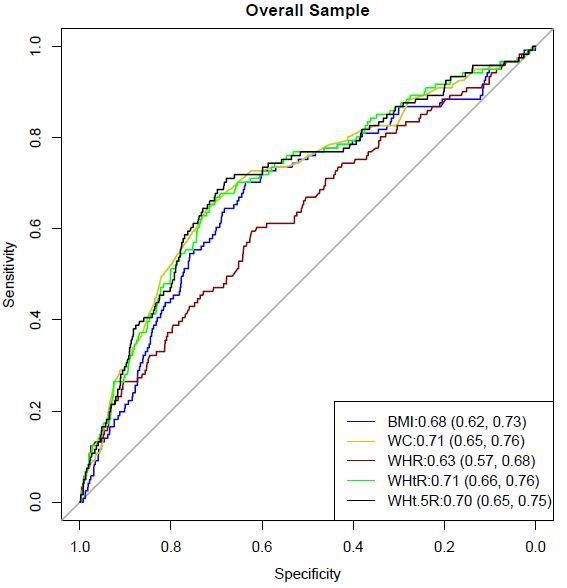
Figure 2. Receiver Operating Characteristic analyses for diabetes by anthropometric indices
in the overall sample. The Area Under the Curve (95% confidence intervals) is shown inside
the graph. Significant difference in Area Under the Curve were: p = 0.031 for BMI versus
WC, p = 0.018 for BMI versus WHtR, and p = 0.022 for BMI versus WHt.5R.
Figure 3. Receiver Operating Characteristic analyses for diabetes by anthropometric
indices in women and men. The Area Under the Curve (95% confidence intervals) is shown
inside the graphs. Significant difference in Area Under the Curve were: p = 0.021 for BMI
versus WC, p = 0.032 for BMI versus WHtR, p = 0.018 for BMI versus WHt.5R in men.
AIMS Public Health Volume 8, Issue 3, 507–518.514
Table 3. Optimal anthropometric cut-offs and their predictive ability of diabetes in overall
sample, women, and men.
Optimal AUC (95% CI) P value Sensitivity Specificity Positive Negative
cut-off difference (%) (%) predictive predictive
in AUC value (%) value (%)
Body mass index (kg.m-2)
Overall 24.8 0.68 (0.62, 0.73) Reference 70 (62, 78) 64 (62, 66) 11 (10, 16) 97 (96, 97)
Women 27.1 0.68 (0.62, 0.74) 65 (54, 76) 70 (67, 72) 14 (12, 21) 96 (94, 97)
Men 24.8 0.63 (0.53, 0.73) 58 (41, 74) 75 (72, 78) 10 (8, 18) 97 (95, 98)
Waist circumference (cm)
Overall 90.0 0.71 (0.65, 0.76) 0.031 65 (56, 73) 73 (71, 75) 13 (12, 18) 97 (96, 97)
Women 87.0 0.71 (0.65, 0.77) 0.074 75 (64, 84) 62 (60, 65) 13 (12, 20) 97 (95, 97)
Men 91.0 0.68 (0.59, 0.78) 0.021 61 (43, 76) 79 (76, 82) 12 (10, 22) 98 (96, 98)
Waist to hip ratio
Overall 0.88 0.63 (0.57, 0.68) 0.133 60 (51, 69) 63 (61, 65) 9 (8, 13) 96 (95, 97)
Women 0.85 0.66 (0.60, 0.72) 0.512 74 (63, 83) 51 (48, 54) 10 (9, 16) 96 (94, 97)
Men 0.88 0.61 (0.51, 0.71) 0.726 71 (54, 85) 54 (50, 57) 7 (6, 14) 98 (95, 98)
Waist to height ratio
Overall 0.54 0.71 (0.66, 0.76) 0.018 67 (58, 75) 71 (69, 73) 13 (12, 18) 97 (96, 97)
Women 0.55 0.71 (0.65, 0.77) 0.099 71 (61, 81) 65 (62, 67) 13 (12, 20) 97 (95, 97)
Men 0.54 0.68 (0.58, 0.77) 0.032 55 (38, 71) 82 (79, 85) 13 (11, 23) 98 (95, 98)
0.5
Waist divided by height
Overall 6.9 0.70 (0.65, 0.75) 0.022 71 (62, 79) 68 (66, 70) 12 (11, 17) 98 (96, 98)
Women 6.9 0.71 (0.64, 0.77) 0.075 75 (64, 84) 62 (59, 65) 12 (11, 19) 97 (95, 98)
Men 6.9 0.68 (0.58, 0.78) 0.018 63 (46, 78) 78 (75, 81) 11 (10, 21) 98 (96, 98)
Note: P values in bold are significant. AUC—Area Under the Curve; CI—confidence interval. Data in brackets are 95%
confidence intervals. P values for differences in AUC use BMI as the reference
4. Discussion and conclusions
This study aimed to determine optimal anthropometric cut-offs to predict T2D and compare their
predictive ability in Kenya. The optimal BMI cut-off was 27.1 kg.m-2 in women and 24.8 kg.m-2 in men.
These findings were consistent with a Ghanaian study which found an overweight BMI of 26.2 kg.m-2 as
the optimal cut-off in women [9] and an Ethiopian study that reported a normal weight BMI of 23.0 kg.m-2
as the optimal cut-off in men [13]. Also, this is in agreement with increasing evidence that black populations
develop T2D at a lower BMI [24] than the current obesity cut-off of 30 kg.m-2 [25]. Further, WC and WHtR
had a better discriminatory ability for T2D than BMI. This agrees with other findings from Guinea, Kenya,
Cameroon, and Ethiopia which have shown that WC is a better predictor of T2D [8,10–13]. Globally, these
findings are consistent with a meta-analysis that found that WC and WHtR had better discrimination for
T2D than BMI [6]. WC and WHtR are proxies of visceral fat which confers a higher risk of metabolic
complications such as T2D compared to peripheral fat [26]. This implies that these measures, rather than
BMI, should be used for risk stratification in Kenya.
We found the optimal WC cut-off as 87 cm for women and 91 cm for men. These cut-offs differ
from those from other SSA settings: in Ghana, the optimal cut-off was 91.7 cm for women and 83.4
AIMS Public Health Volume 8, Issue 3, 507–518.515
cm for men [9] while in Ethiopia the optimal cut-off was 82.9 cm for women and 88.6cm for men [13].
Despite these contrasts, our findings show a similar trend to the other two studies, that is, the cut-offs
for women are above the WHO cut-off for metabolic complications (≥80 cm) while the cut-offs in men
are below the WHO thresholds (≥94 cm) [25]. A similar trend has been reported by a large analysis of
data (n = 24181) from eight SSA countries which showed that men were at increased cardiometabolic
risk at lower WC (≥81.2 cm) than current guidelines (≥94 cm) [27]. This implies that a WC cut-off of
≥91 cm should be used for predicting T2D risk in men instead of the recommended ≥94 cm. In women,
the WHO recommended cut-off of ≥88 cm which corresponds to “substantially increased risk” of
metabolic complications [25] should be used to predict T2D risk in Kenya.
The WHt.5R was not found to be significantly better than the WHtR in predicting T2D. The
optimal WHtR cut-off was relatively similar for women and men:0.55 and 0.54, respectively. This is
slightly higher than what was reported in Ethiopia:0.51 in men and 0.52 in women [13]. The derived
WHtR cut-offs are relatively similar to the recommended and widely used cut-off of ≥0.5 in women
and men which translates to a simple screening message of “keep your waist to less than half your
height” [28–30]. Apart from a simple public health message, the same WHtR cut-off is used for both
men and women, and adults and children [30]. Further, WHtR is easier to measure and calculate than
BMI and a string can be used for measurement (a string measuring half someone’s height should fit
around their waist) making it a very cheap screening method [28,30]. This implies there is need to
consider the use of WHtR in risk stratification and associated simple public health messaging to
intervene on central obesity and prediction of T2D risk in Kenya.
Finally, the optimal anthropometric cut-offs in this study were lower than those reported
among black populations in high-income countries. For example, we found the optimal BMI cut-
off as 24.8kg.m-2 which is lower than what has been reported in black populations in the UK:
28.1kg.m-2 [31]. Similarly, recent evidence from the Research on Obesity and Diabetes among
African Migrants (RODAM) study found that the optimal anthropometric cut-offs were highest in
migrant Ghanaians in Europe and lowest in Ghanaians in rural Ghana [32]. Such variations in the
optimal cut-offs could be due to a less central role of obesity in T2D development, higher risk even
with modest increases in obesity, or increased significance of other risk factors. More research is
needed to understand the mechanisms responsible for these variations in black populations.
This study adds to the limited evidence on optimal anthropometric cut-offs and their predictive
ability of T2D in Kenya and SSA. Its strengths are the use of a large nationally representative sample,
and identification of optimal cut-offs, and predictive ability of five anthropometric indices. However,
just like the recommended cut-offs, the study uses cross-sectional evidence which limits causal
inference of derived cut-offs on T2D. More evidence, particularly from prospective studies, is needed
to confirm if the derived cut-offs are the most appropriate for T2D prediction in Kenya.
In conclusion, WC, WHtR and WHt.5R were better predictors of T2D than BMI highlighting
their utility in risk stratification. The optimal cut-offs of WC (87 cm for women and 91 cm for men),
WHtR (0.54 for both women and men) and WHt.5R (6.9 for both women and men) should be used for
risk stratification in Kenya.
AIMS Public Health Volume 8, Issue 3, 507–518.516
Acknowledgements
The authors would like to thank the three anonymous reviewers whose input improved the quality
of this article. The views expressed are those of the authors and not necessarily those of the University
of Glasgow.
Availability of data and materials
The Kenya STEPwise survey 2014 data can be assessed from the Kenya National Bureau of
Statistics using this link: http://statistics.knbs.or.ke/nada/index.php/catalog/90.
Conflict of interest
The authors declare that they have no competing interests.
Authors’ contributions
AMM conceptualised the study, analysed and interpreted the data, and drafted the manuscript.
References
1. Pastakia SD, Pekny CR, Manyara SM, et al. (2017) Diabetes in sub-Saharan Africa–from policy
to practice to progress: targeting the existing gaps for future care for diabetes. Diabet Metab Synd
Ob 10: 247.
2. Dunkley AJ, Bodicoat DH, Greaves CJ, et al. (2014) Diabetes Prevention in the Real World:
Effectiveness of Pragmatic Lifestyle Interventions for the Prevention of Type 2 Diabetes and of
the Impact of Adherence to Guideline Recommendations. Diabetes Care 37: 922–933.
3. Bellou V, Belbasis L, Tzoulaki I, et al. (2018) Risk factors for type 2 diabetes mellitus: An
exposure-wide umbrella review of meta-analyses. PloS One 13: e0194127.
4. Nuttall FQ (2015) Body Mass Index: Obesity, BMI, and Health: A Critical Review. Nutr Today
50: 117–128.
5. Sattar N, Gill JMR (2014) Type 2 diabetes as a disease of ectopic fat? BMC Med 12: 123.
6. Ashwell M, Gunn P, Gibson S (2012) Waist-to-height ratio is a better screening tool than waist
circumference and BMI for adult cardiometabolic risk factors: systematic review and meta-
analysis. Obes Rev 13: 275–286.
7. Nevill AM, Duncan MJ, Lahart IM, et al. (2017) Scaling waist girth for differences in body size
reveals a new improved index associated with cardiometabolic risk. Scand J Med Sci Sports 27:
1470–1476.
8. BaldéNM, Diallo I, BaldéMD, et al. (2007) Diabetes and impaired fasting glucose in rural and
urban populations in Futa Jallon (Guinea): prevalence and associated risk factors. Diabetes Metab
33: 114–120.
9. Frank LK, Heraclides A, Danquah I, et al. (2013) Measures of general and central obesity and risk
of type 2 diabetes in a Ghanaian population. Trop Med Int Health 18: 141–151.
AIMS Public Health Volume 8, Issue 3, 507–518.517
10. Haregu TN, Oti S, Egondi T, et al. (2016) Measurement of overweight and obesity an urban slum
setting in sub-Saharan Africa: a comparison of four anthropometric indices. BMC Obes 3: 46.
11. Mbanya V, Kengne A, Mbanya J, et al. (2015) Body mass index, waist circumference, hip
circumference, waist–hip-ratio and waist–height-ratio: Which is the better discriminator of prevalent
screen-detected diabetes in a Cameroonian population? Diabetes Res Clin Pract 108: 23–30.
12. Tesfaye T, Shikur B, Shimels T, et al. (2016) Prevalence and factors associated with diabetes
mellitus and impaired fasting glucose level among members of federal police commission residing
in Addis Ababa, Ethiopia. BMC Endocr Disord 16: 68.
13. Woldegebriel AG, Fenta KA, Aregay AB, et al. (2020) Effectiveness of Anthropometric
Measurements for Identifying Diabetes and Prediabetes among Civil Servants in a Regional City
of Northern Ethiopia: A Cross-Sectional Study. J Nutr Metab 2020: 8425912.
14. Mayige M (2014) Derivation and validation of a simple risk score for undiagnosed diabetes for
Tanzania and other African populations: Newcastle University.
15. Ntuk UE, Gill JM, Mackay DF, et al. (2014) Ethnic-specific obesity cutoffs for diabetes risk:
cross-sectional study of 490,288 UK biobank participants. Diabetes Care 37: 2500–2507.
16. Division of Non Communicable diseases (2015) Kenya STEPwise survey for non‐communicable
diseases risk factors 2015 report. Available from: https://www.health.go.ke/wp-
content/uploads/2016/04/Steps-Report-NCD-2015.pdf.
17. Suastika K, Dwipayana P, Semadi MS, et al. (2012) Age is an important risk factor for type 2
diabetes mellitus and cardiovascular diseases. Glucose Tolerance, 67–80.
18. Diaz-Valencia PA, Bougnères P, Valleron AJ (2015) Global epidemiology of type 1 diabetes in
young adults and adults: a systematic review. BMC Public Health 15: 255.
19. WHO (2000) Obesity: preventing and managing the global epidemic: World Health Organization.
Available from: https://apps.who.int/iris/handle/10665/42330.
20. WHO (2006) Definition and diagnosis of diabetes mellitus and intermediate hyperglycaemia:
report of a WHO/IDF consultation. Available from: https://apps.who.int/iris/handle/10665/43588.
21. Bunn A, Korpela M (2019) An Introduction to dplR. Available from:
http://r.meteo.uni.wroc.pl/web/packages/dplR/vignettes/intro-dplR.pdf
22. López Ratón M, Rodríguez Álvarez MX, Cadarso Suárez CM, et al. OptimalCutpoints: an R
package for selecting optimal cutpoints in diagnostic tests; 2014. American Statistical Association.
Available from: https://www.jstatsoft.org/article/view/v061i08.
23. Robin X, Turck N, Hainard A, et al. (2021) Display and Analyze ROC Curves. Package ‘pROC’.
Available from: https://cran.r-project.org/web/packages/pROC/pROC.pdf.
24. Kibirige D, Lumu W, Jones AG, et al. (2019) Understanding the manifestation of diabetes in sub
Saharan Africa to inform therapeutic approaches and preventive strategies: a narrative review.
Clin Diabetes Endocrinol 5: 2.
25. WHO (2011) Waist circumference and waist-hip ratio: report of a WHO expert consultation,
Geneva, 8-11 December 2008. Available from:
https://www.who.int/publications/i/item/9789241501491.
26. Lee MJ, Wu Y, Fried SK (2013) Adipose tissue heterogeneity: implication of depot differences
in adipose tissue for obesity complications. Mol Aspects Med 34: 1–11.
27. Ekoru K, Murphy G, Young E, et al. (2018) Deriving an optimal threshold of waist circumference
for detecting cardiometabolic risk in sub-Saharan Africa. Int J Obes 42: 487–494.
AIMS Public Health Volume 8, Issue 3, 507–518.518
28. Ashwell M, Gibson S (2014) A proposal for a primary screening tool: ‘Keep your waist
circumference to less than half your height’. BMC Med 12: 207.
29. Ashwell M, Gibson S (2016) Waist-to-height ratio as an indicator of ‘early health risk’: simpler
and more predictive than using a ‘matrix’based on BMI and waist circumference. BMJ Open 6:
e010159.
30. Ashwell M, Hsieh SD (2005) Six reasons why the waist-to-height ratio is a rapid and effective
global indicator for health risks of obesity and how its use could simplify the international public
health message on obesity. Int J Food Sci Nutr 56: 303–307.
31. Caleyachetty R, Barber TM, Mohammed NI, et al. (2021) Ethnicity-specific BMI cutoffs for
obesity based on type 2 diabetes risk in England: a population-based cohort study. Lancet
Diabetes Endocrinol 9: 419–426.
32. Darko SN, Meeks KAC, Owiredu WKBA, et al. (2021) Anthropometric indices and their cut-off
points in relation to type 2 diabetes among Ghanaian migrants and non-migrants: The RODAM
study. Diabetes Res Clin Pract 173: 108687.
© 2021 the Author(s), licensee AIMS Press. This is an open access
article distributed under the terms of the Creative Commons
Attribution License (http://creativecommons.org/licenses/by/4.0)
AIMS Public Health Volume 8, Issue 3, 507–518.You can also read