Online-Shopping Market in China - Adventurous Kingdom for Foreign SME - Lee, Hsiang-Ting
←
→
Page content transcription
If your browser does not render page correctly, please read the page content below

CBC MARKETING RESEARCH
                             SHANGHAI OFFICE

Online-Shopping Market in China -
 Adventurous Kingdom for Foreign SME

                 by

          Lee, Hsiang-Ting
           December 2009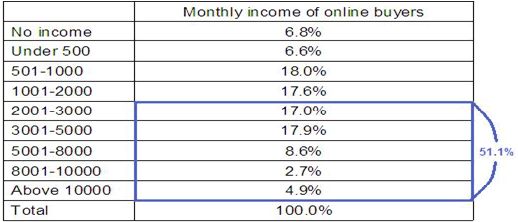
Table of Contents                                                                          I

Table of Contents
Table of Contents ...........................................................................................................................I

List of Figures ...............................................................................................................................III

List of Tables ............................................................................................................................... IV

1.     Introduction ............................................................................................................................1

2.     Online Shopping Market in China ..........................................................................................3

     2.1.             Macroeconomic Environment in China ................................................................. 3

     2.2.             Internet Access Condition in China ....................................................................... 4

     2.3.             Demographic Structure of Netizens ...................................................................... 8

     2.4.             Trends in the Internet Development in China ..................................................... 12

     2.5.             Current Development of the Chinese Online Shopping Market .......................... 12

     2.6.             Online Buyer Analysis ......................................................................................... 16

3.     Market Participants in the Online Retailing Market and their Business Models ...................26

     3.1.             Overview of the Online Retailing Market ............................................................ 26

     3.2.             Major Retailers in the Online Shopping Market .................................................. 28

     3.3.             Key Considerations in the Choice of Online Retailers ........................................ 33

     3.4.             Manufacturers with Online Sales ........................................................................ 37

4.     Major Operational Issues in the Chinese Online Shopping Market ......................................42

     4.1.             Multichannel Distribution and Price Competition ................................................ 42

     4.2.             Price Competition with Unauthorized Online Stores ........................................... 45

     4.3.             Logistics in the Online Shopping Market ............................................................ 47

     4.4.             Payments in the Online Shopping Market .......................................................... 49

     4.4.             Problems of Counterfeit Products ....................................................................... 51
Table of Contents II
5. Success Factors in the Chinese Online Shopping Market ...................................................53
5.1. Success Factors of Online Retailers ................................................................... 53
5.2. Success Factors of the Manufacturers with Online Sales .................................. 54
6. Conclusion ...........................................................................................................................59
6.1. Trends in the Chinese Online Shopping Market ................................................. 59
6.2. Advice for Foreign SMEs .................................................................................... 61
Bibliography.................................................................................................................................67
Contact Information .....................................................................................................................78List of Figures III
List of Figures
Figure 1: China’s GDP and Year-On-Year GDP Growth Rates .................................................... 3
Figure 2: China’s IT Market Growth Rate and GDP Growth Rate Forecast, 2009 ....................... 4
Figure 3: Size of Netizens and Internet Penetration Rates in China ............................................ 5
Figure 4: World Internet Penetration Rates, 2009 ........................................................................ 6
Figure 5: Download Speeds in Major OECD Countries ............................................................... 7
Figure 6: Netizens’ Gender Distribution........................................................................................ 8
Figure 7: Netizens’ Age Distribution ............................................................................................. 9
Figure 8: Netizens’ Age Distribution in China, Korea, Taiwan, Hong Kong, and Macao ............. 10
Figure 9: Development of Netizens’ Age Structure from 2000-2007 .......................................... 10
Figure 10: Development of Netizens’ Income Structure from 2000 to June 2009 ....................... 11
Figure 11: Netizens’ Educational Structure ................................................................................ 12
Figure 12: Value of Transactions and Market Growth Rates
in the Chinese Online Shopping Market .................................................................. 13
Figure 13: Percentage of Online Retail Sales in the Total Retail Sales in the Chinese Market .. 13
Figure 14: Value of Transactions in the Chinese Online B2C and C2C Market ......................... 14
Figure 15: Average Online Purchasing Amounts per User per Year........................................... 14
Figure 16: Netizens and Online Customers’ Gender Distribution, 2008 ..................................... 16
Figure 17: Online Customers’ Age Distribution, 2008................................................................. 16
Figure 18: Online Buyers’ Yearly Purchasing Amounts by Income, 2008................................... 18
Figure 19: Value of Online Shopping Transactions by Region, 2008 ......................................... 21
Figure 20: Market Share of Online Payment Providers in China, 2008 ...................................... 22
Figure 21: Key Influencing Factors on Online Purchasing Decisions
of Male Customers, 2008 ......................................................................................... 23
Figure 22: Key Influencing Factors on Online Purchasing Decisions
of Female Customers, 2008 .................................................................................... 23
Figure 23: Netizens’ Media Channels for Information
of Online Shopping Websites, June 2008 ................................................................ 24
Figure 24: Market Share of Online Retailers in China, 2008 ...................................................... 26
Figure 25: Value of Transactions of Major Online Retailers, 2008 ............................................. 26List of Tables IV List of Tables Table 1: Ranking of Best Sold Items over Internet, 2008 ........................................................... 15 Table 2: Monthly Incomes of Online Customers, June 2008 ...................................................... 17 Table 3: Online Customers’ Income Structure by Cities, June 2008 .......................................... 18 Table 4: Online Customers’ Educational Level, June 2008 ........................................................ 19 Table 5: Length of Prior Internet Experience among Online Customers in Different Cities ........ 19 Table 6: Online Customers’ Scale and Penetration Rates by Region, 2008 .............................. 20 Table 7: Most Used Payments Methods by Online Customers, 2008 ........................................ 21 Table 8: Comparison of Products and Services of 360Buy, Dangdang and Amazon ................. 30 Table 9: Tasks for Manufacturers to Sell through Online Retailers ............................................. 34 Table 10: Advantages and Disadvantages of the Collaboration with Online Retailers ............... 34 Table 11: Composition of Users by Types of Online Retailers .................................................... 36 Table 12: Users’ Age Structure by Online Shopping Platforms, June 2008................................ 36 Table 13: Online Customers’ Income Levels by Online Shopping Platforms, June 2008 ........... 37 Table 14: Types of Online Business Models ............................................................................... 37 Table 15: Market Positioning of Markfairwhale’s Online and Offline Channels .......................... 44 Table 16: Comparison of Market Entry Modes in the Chinese Online Shopping Mark ............... 62 Table 17: Advantages and Disadvantages of Three Expansion Modes over Internet ................ 64 Table 18: SWOT Analysis for Foreign Firms in the Chinese Online Shopping Market ............... 65
List of Abbreviations                                    V

List of Abbreviations

B2C online             B2C online shopping websites are platforms which sell goods
shopping website       or services directly to final customers. Major B2C online
                       shopping websites are Dangdang, Amazon and 360Buy. B2C
                       online shopping customers are customers who purchased
                       from B2C online shopping websites in the past 6 months
                       (CNNIC, June 2008, p.6).

CNNIC                 China Internet Network Information Center (CNNIC) is the
                      governmental network information center of China.
                      Established in 1997, the main responsibility of CNNIC includes
                      domain name registry, IP address and autonomous system
                      number allocation service, catalogue database service,
                      technical researches on Internet addressing, Internet survey
                      and relevant information services (CNNIC 2009).

COD                   Cash on delivery

CRM                   Customer relationship management

C2C online            C2C online shopping websites are online platforms like EBay
                      for transactions between individuals (CNNIC, June 2008, p.6).
shopping website

Electronic business   Electronic business include any purchase of goods and
and online shopping   services via online communication, including business to
                      business (B2B), business to consumer (B2C), consumer to
                      consumer (C2C) and government to business (G2B) (CNNIC,
                      June 2008, p.6). In the report, online shopping will be mainly
                      focused on online B2C market.

Junior college        Junior college is usually known as higher vocational school
                      where students attend after the graduation from senior high
                      schools. The focus of the lectures in junior colleges is on
                      practical skills rather than theoretical knowledge in university
                      education.
List of Abbreviations VI
Kbps Kilobits per second
Mbit/s Megabit per second
MNC Multinational company
Municipality and Municipality refers to cities directly under the jurisdiction of the
sub-provincial city central government. Chinese municipalities include Beijing,
Shanghai, Chongqing and Tianjin. Sub-provincial city refers to
Harbin, Changchun, Shenyang, Dalian, Nanjing, Hangzhou,
Ningbo, Xiamen, Jinan, Qingdao, Wuhan, Guangzhou,
Shenzhen Chengdu and Xian (CNNIC, June 2008, p.7).
Netizen According to CNNIC (June 2008, p.6), netizen is defined as
the Chinese populations who have accessed to Internet in the
past 6 months.
ODM Original design manufacturer
Online customer According to CNNIC (June 2008, p.6), online customers are
defined as the Chinese population who has purchased online
in the past 6 months.
Online shopping Online shopping penetration rate refers to the percentage of
penetration rate online shopping customers relative to the total number of
netizens for the past 6 months (CNNIC, June 2008, p.6).
Online shopping Online shopping penetration rate of a website refers to the
penetration rate of a percentage of the customers of a specific online shopping
website website relative to the total number of online shopping
customers in the past 6 months (CNNIC, June 2008, p.6).
SEO Search engine optimization
SME Small and medium-sized enterpriseIntroduction 1 1. Introduction The Chinese economic miracle has been regarded as a key factor influencing the speed of world’s recovery during current economic downturn. In this circumstance, a great number of companies shift their focus to the continuously growing Chinese economy. Online retailing in China is going through a period of exceptional boom. The market is immune to weak economic condition and has experienced an explosive growth. Customers appreciate online price advantages over offline stores and increase their online spending. In the current financial crisis, Chinese online shopping market provides an attainable opportunity for small and medium enterprises. According to Anderson (April 2009, pp.71-76), online platforms decrease the distribution costs including reduced spending on physical stores, rents and shelf spaces. Number of items sold online can be further extended. SMEs with unique niche products can reach target customers online more cost efficiently. With improved online searching capabilities and communication applications like blogs and product recommendations, consumers’ search costs for desired products is largely reduced through online channel. Online buyers can select best suited products at ease. Personalized demands can be satisfied more effectively. SMEs with direct online sales have more opportunities to compete with large conventional players by providing unique and individualized offers. Mixed with high technology, tremendous growth and distinct culture, Chinese online shopping market shows its promising appeals. Meanwhile, geographical diversity, cultural barrier and lack of understanding make this market less accessible from outside world. Within 10 years, the online market has experienced a dramatic change. One remarkable change in this industry was Taobao’s victory, a Chinese local online shopping platform founded in 2003 championed eBay who previously held 85% of market share in 2003 (So/Westland, August 9, 2009). Amazon acquired a Chinese firm Jojo in 2004, still in fierce competition with local opponent Dangdang and has not achieved profitability. Witness a tremendous market potential, Baidu, the Chinese leading search engine who beats Google and controls 76.9% of the Chinese online search market, has moved into the online C2C shopping market in October 2008 and glares at the tempting B2C market (Baidu 2009). In this prosperous market of high competitive intensity and low entry barrier, only the
Introduction                                 2

companies who are able to understand and satisfy local customers can
capture the opportunity. Renowned international companies with outstanding
technology can easily collapse if consumers are approached in wrong ways.

To understand the roaring potential of this market, especially in the perspective
of foreign-based SMEs, major evaluations on Chinese online B2C shopping
market are divided into four categories: online shopping market analysis,
strategies of online retailers and manufacturers with direct online channels,
potential obstacles in the industry and advice on the market entry for foreign
SMEs.

Major findings show that this rigorous market will continue its progressive
growth. Foreign-based firms with a set of competitive advantages such as
product uniqueness, premium service quality or branding knowhow have
greater potentials to win over rivals. Disadvantages in the lack of market
knowledge can be compensated by collaboration with well established local
partners. Complementary services including logistics and online payments
should be planned in a comprehensive way and tailored to customers’
purchasing habits. For example, online payment through local online third
party payment tools and cash on delivery are preferred. Cultural difference has
significant influences on marketing techniques, online communication and
interaction, payment and delivery terms. For instance, Chinese online
shoppers usually contact sellers for product information or price negotiation
before their purchases through online instant messengers. It signifies that
adequate number of customer service personnel should serve online during
working hours and during peak buying time to respond to customers’ requests.
To conclude, localization in all aspects is the key element for the success.
Foreign SMEs should be prepared for an intense and rigorous competition in
this environment, but also not to forget the continuous innovation and
improvement. In this way, a small scaled company has chances to win over big
MNCs in this kingdom of adventure.
Online Shopping Market in China                              3

2.           Online Shopping Market in China
2.1.         Macroeconomic Environment in China
China’ GDP went through an average increase by 9.6% per year from 1979 to
2008 (Men et al., August 2008). The economic crisis has slowed down the
Chinese economic growth. Figure 1 below shows the declined GDP growth
rate from double digits in 2003-2007 to 9% in 2008. The demand of Chinese
export has shrunk due to the global economic downturn and has badly hurt
export-oriented manufacturers. Chinese government’s current priority is to
drive up domestic demands. Stimulus measures have been carried on to
re-establish the economy (Chinese government's official web portal,
September 11, 2009).

Figure 1: China’s GDP and Year-On-Year GDP Growth Rates

                                           13,0          4.749,3
  5.000,0                                                        14,0
                                                  4.357,5
  4.500,0                          11,6
                            10,4                                  12,0
  4.000,0    10,0    10,1
                                          3.385,6 9,0
  3.500,0                                                         10,0
                                                          8,0
  3.000,0                      2.613,1
                        2.259,1                                   8,0
                                                                         GDP
  2.500,0        1.926,2
                                                                  6,0    (billion USD)
  2.000,0 1.636,4
  1.500,0                                                         4,0
                                                                         Year‐on‐year
  1.000,0                                                                growth rate
                                                                  2,0
     500,0                                                               (%)
       0,0                                                        0,0
              2003   2004   2005   2006    2007    2008   2009e

Source: Taiwan bureau of foreign trade, August 19, 2009

The Chinese government offered a fiscal stimulus package of RMB 4 trillion
[USD 585.8 billion] to stabilize the economic growth through 2010 (Xinhua,
November 14, 2008). The investment is assumed to push up 1 % growth rate
of GDP in 2009. IT industry receives around 0.5% to 1% of the cash injection,
ranging from RMB 20 billion [USD 2.9 billion] to RMB 40 billion
[USD 5.9 billion]. The governmental investment is expected to boost a higher
growth in IT industry relative to other countries (IDC, January 20, 2009, p.1).
Figure 2 in the next page shows the growth rate of China’s IT market and GDP
forecast in 2009.
Online Shopping Market in China 4
Figure 2: China’s IT Market Growth Rate and GDP Growth Rate Forecast,
2009
% 12,0
10,0
8,0
6,0
4,0
2,0
0,0
Asia
Global US Japan India China
Pacific
GDP growth rate 1,8 3,7 0,0 0,7 6,8 8,0
IT market growth rate 2,6 4,0 0,9 1,0 10,0 9,1
Source: IDC, January 20, 2009, p.1
The Chinese stimulus measure raised the GDP growth rate to 7.1% by June
2009 (Taiwan Bureau of foreign trade, August 19, 2009). The rescue package
approved by the State Council includes a plan to revitalize top 10 industries for
a faster economic recovery. Electronics and information industry is chosen as
one prioritized industry for governmental assistance (Xinhua, April 25, 2009).
Even though the growth rate is reduced, Chinese economy is still in a rapid
development compared to other countries. World Bank estimates the Chinese
GDP growth rate will reach 7.2 and 7.7 in 2009 and 2010 respectively (Xinhua,
June 18, 2009).
2.2. Internet Access Condition in China
2.2.1. Netizen Scales and Internet Penetration Rates
China has the world’s largest online population. The size of web surfers
reached 338 million by June 30, 2009 (CNNIC, July 2009, p.4). Figure 3 in the
next page shows the increasing size of netizens and the Internet penetration
rates in China from 2000 to 2009.Online Shopping Market in China 5
Figure 3: Size of Netizens and Internet Penetration Rates in China
(million)
400 30,0%
350
338
298 25,0%
300 25.5%
Population of
20,0% netizen
250 22,6%
210 (million)
200 15,0%
16,0%
150
137
111 10,5% 10,0% Internet
100 79,5 94 8,5% penetration
59,1 7,2% rate(%)
5,0%
50 22,5 33,7 4,6% 6,2%
0
1,8% 2,6% 0,0%
2000 2001 2002 2003 2004 2005 2006 2007 2008 June
2009
Source: CNNIC, January 2003, pp.35-36,p.38; CNNIC, January 2004, p.38, p.40;
CNNIC, January 2005, p.44; CNNIC, January 2009a, p.12; CNNIC, July 2009, p.11;
National bureau of statistics of China 2002
The accelerated growth of netizens can be contributed to the elements below:
• Growing disposable income
The rapid economic development raises the level of dispensable income. This
has led to an increasing share of expenditures on information and
communication products and services relative to the spending on daily
necessities. This change in spending patterns has enhanced the adoption of
Internet. Moreover, the economic crisis brings a large amount of unemployed
workforce from industrial cities back to rural villages of origin. As those jobless
return to rural regions, they disseminate knowledge of Internet and Internet
usage behavior via their social network and personal contacts (CNNIC, July
2009, p.12) .
• Increasing availability of affordable offers
Increasing level of competitions between telecom carriers and activities of
merging and acquisition among Internet service providers enhance the quality
level of both software and hardware. The competition makes Internet
connection more affordable. Mobile phones will become a more convenient
device for Internet connection as 3G gains more prevalence. These factors
lower the barrier to Internet use among populations (CNNIC, July 2009,
pp.11-12).Online Shopping Market in China 6
• Governmental supports and investments
The governmental policies have contributed to the rising Internet penetration
rate. The Chinese government promotes Internet development mainly through
the Eleventh Five-Year Plan and the 2006-2020 National Informatization
Development Strategy. These policies include investment in infrastructures for
more prevalent Internet connections (CNNIC, July 2009, p.11). The project of
rural informationalization was launched to establish phones and Internet
access in every village by 2010. With the aims to urbanize countryside and
bridge the gap between cities and villages, improving telecommunications
infrastructures and providing online access to rural populations are regarded
as priorities (CNNIC, January 2009a, pp.11-12).
2.2.2. World Internet Penetration Rates
The Internet penetration rate in China reached 25.5%, which has exceeded the
world average rate of 24.7%. Figure 4 below illustrates the Internet penetration
rate in major countries.
Figure 4: World Internet Penetration Rates, 2009
World average 24.7%
India 7.0%
China 25.5%
Russia 27,1%
Brazil 34,4%
Japan 74,0%
US 74,7%
Korea 77,3%
0,0% 10,0% 20,0% 30,0% 40,0% 50,0% 60,0% 70,0% 80,0% 90,0%
Source: CNNIC, July 2009, p.12, Internet World Stats 2009a, Internet World Stats
2009b.
2.2.3. Methods of Internet Access
• Broadband
Broadband Internet access has been used by 94.3% of Chinese netizens,
which is equivalent to 320 million, by June 2009 (CNNIC, July 2009, p.12).
Though broadband Internet access gains a wide popularity in China, download
speed remains less than 4 Mbit/s, lower than the average of OECD major
countries, which is 17.4 Mbit/s, and far behind that in Japan and in Korea,
where the download speeds reach 90 Mbit/s and 80 Mbit/s respectivelyOnline Shopping Market in China 7
(CNNIC, July 2009, p.13; Wang July 28, 2009). Because broadband width is
shared, the data transfer rate further slows down during peak hours. The
country still has a great deal of catching up to provide high-speed Internet
service (CNNIC, July 2009, p.13). Figure 5 below shows the comparison of
download speeds in major OECD countries.
Figure 5: Download Speeds in Major OECD Countries
Mexico 1
Turkey 3
Poland 4
Hungary 5
Ireland 6
Canada 6
Slovakia 6
Greece 7
Belgium 7
Switzerland 8
Spain 9
US 9
Luxemburg 10
Austria 10
Czech 10
UK 10
Italy 12 Mbit/s
Sweden 12
Norway 12
New Zealand 13
Iceland 13
Portugal 14
Denmark 14
Australia 15
Germany 16
Netherland 18
Finland 19
France 50
Korea 79
Japan 91
0 20 40 60 80 100
Source: CNNIC, July 2009, p.14
• Mobile Internet
The number of netizens who are connected to the Internet via mobile phones
reached 155 million (CNNIC, July 2009, pp.14-15). The usage rate of mobile
Internet is related to the reduced monthly tariffs and the increasing applications
developed for mobile Internet. The most used mobile Internet applications are
entertainment-oriented, such as online music, television and blogs. Online
music has 6.6 million active users. Meanwhile, the use of mobile commerce
has not been widely penetrated but is also fast growing. In particular, the
application of mobile WAP email has 4.8 million of active users (CNNIC,Online Shopping Market in China 8
January 2009b, p.5). The security of payment system and the number of
mobile applications play important roles in the adoption of mobile commerce
(IResearch, August 5, 2009).
Users of mobile Internet and traditional Internet access overlap to a high
degree. 94.5% of mobile Internet users use also PC for Internet access. Users
use both channels for the same online applications. These two channels are
complements for each other (CNNIC, January 2009b, p.6).
2.3. Demographic Structure of Netizens
2.3.1 Gender
By June 2009 the gender distribution of male and female netizens is 53%
versus 47% (CNNIC, July 2009, p.16). As Internet penetrates more widely, the
gender structure of netizen has become more balanced (CNNIC, January
2009a, p.18). This means the male and female ratio among netizens will
become more similar to Chinese citizens’ gender ratio, which is 51.5% and
48.5% in the year 2007 (National bureau of statistics of China 2008). The
proportion of female netizens increased rapidly from 30.4% in 2000 to 47% in
June 2009. Figure 6 below shows netizens’ gender distribution from 2000 to
2009.
Figure 6: Netizens’ Gender Distribution
100%
90%
30,4%
80% 40,0% 40,7% 39,6% 39,4% 41,3% 41,7% 42,8% 47,5% 47,0%
70%
60%
50%
40%
69,6%
30% 60,0% 59,3% 60,4% 60,6% 58,7% 58,3% 57,2% 52,5% 53,0%
20%
10%
0%
2000 2001 2002 2003 2004 2005 2006 2007 2008 Jun 09
Male Female
Source: CNNIC, January 2007, p.45; CNNIC, January 2009a, p.18; CNNIC, July 2009,
p.16
2.3.2 Age
Chinese netizens’ age structure is concentrated in the young age range,Online Shopping Market in China 9
especially from 10 to 29. The number of netizens aged from 10 to 29 accounts
for more than 60% of total netizens (CNNIC, July 2009, p.16). According to
IResearch (2009b, p.17), the concentration among young population is
because online entertaining applications such as online shopping and
socialization tools are more appealing to young generations. Moreover, young
adults are relatively more technologically competent which facilitates the
adoption of Internet. Figure 7 below shows netizens’ age distribution in 2008
and June 2009.
Figure 7: Netizens’ Age Distribution
40%
35,2%
35% 33,0%
31,5%
29,8%
30%
25%
20,7%
20% 17,6%
2008
15%
9,6% 9,9% June 2009
10%
4,2% 4,0%
5% 0,9% 1,5% 1,7%
0,4%
0%
Under 10 10‐19 20‐29 30‐39 40‐49 50‐59 60 and above
Source: CNNIC, July 2009, p.16
Chinese netizens are largely composed of young populations unlike other
markets such as Macao, Hong Kong, Taiwan and Korea. Chinese netizens
aged from 15-24 account for 44.5% of total netizen, largely surpassing these
four markets mentioned above. Figure 8 in the next page examines the age
distribution of netizens in Mainland China, Korea, Taiwan, Hong Kong, and
Macao.Online Shopping Market in China 10
Figure 8: Netizens’ Age Distribution in China, Korea, Taiwan, Hong Kong,
and Macao
China 11,3% 44,5% 20,0% 14,8% 6,3%3,0%
Korea 15,9% 18,4% 22,0% 22,5% 14,9% 6,3% 6‐14
15‐24
Taiwan 6,3% 22,6% 28,5% 21,5% 14,6% 6,6% 26‐34
35‐44
Hong Kong 10,8% 17,2% 23,1% 23,6% 17,6% 7,8%
45‐54
Macao 13,8% 28,6% 22,5% 19,8% 11,6% 3,7% 55 and above
0% 20% 40% 60% 80% 100%
Source: Wang, August 26, 2009
As Figure 9 shows below, the relatively high percentage of young web users
group illustrates the concentration of netizen in the young segments.
Nevertheless, this concentration appears to decrease. The age group of 18-24
has gradually decreased its importance from 41.2% in 2000 to 31.8% in 2007.
As Internet develops more prevalently, netizen’s age structure will become
more proportionally distributed as the structure of whole population (Wang,
August 26, 2009). Figure 9 below shows the netizens’ age structure from 2000
to 2007.
Figure 9: Development of Netizens’ Age Structure from 2000-2007
2007 19,1% 49,9% 19,4% 11,7%
2006 17,2% 54,9% 18,6% 9,3%
2005 16,6% 54,4% 18,7% 10,3%
2004 16,4% 53,0% 19,0% 11,6%
2003 18,8% 51,3% 19,7% 10,2%
2002 17,6% 54,3% 17,6% 10,5%
2001 15,3% 52,5% 20,3% 11,9%
2000 14,9% 60,0% 16,0% 9,0%
0% 20% 40% 60% 80% 100%
under 18 18‐30 31‐40 41 and above
Source: CNNIC, January 2002, p.7; CNNIC, January 2003, p.3, p.9; CNNIC, January
2004, p.11; CNNIC, January 2005, p.12; CNNIC, January 2006, p.14; CNNIC,
January 2007, p.11; CNNIC, January 2008, p.17; CNNIC, January 2009a, p.18;
CNNIC, July 2009, p.17Online Shopping Market in China 11
2.3.3 Income
More than 70% of netizens have an income level of less than RMB 2000
[USD 292.9] per month. Figure 10 below shows the evolvement of netizens’
income level from 2000 to 2009.
Figure 10: Development of Netizens’ Income Structure from 2000 to June
2009
June 2009 28,6% 15,6% 28,2% 14,2% 8,5% 4,9%
2008 27,5% 16,2% 29,8% 13,7% 8,0% 4,8%
2007 28,6% 16,7% 28,7% 12,4% 8,4% 5,2%
2006 29,5% 18,1% 24,8% 13,7% 8,9% 5,0%
2005 30,0% 15,7% 25,2% 12,8% 9,9% 6,4%
2004 34,2% 19,0% 27,4% 10,7% 5,8% 2,9%
2003 34,2% 15,6% 27,8% 11,9% 7,3% 3,2%
2002 40,0% 20,9% 23,6% 8,9% 4,4%2,2%
2001 35,9% 25,3% 25,3% 7,8%3,4% 2,3%
2000 31,7% 25,9% 23,3% 7,6% 4,7% 2,7%
0% 20% 40% 60% 80% 100%
Under 500 501‐1000 1001‐2000 2001‐3000 3001‐5000 5001 and above
Source: CNNIC, January 2002, p.9; CNNIC, January 2003, p.5, pp.11-12; CNNIC,
January 2004, pp.12-13; CNNIC, January 2005, p.14; CNNIC, January 2006, p.17;
CNNIC, January 2007, p.13; CNNIC, January 2008, p.20; CNNIC, January 2009a,
p.19; CNNIC, July 2009, p.18
2.3.4 Educational Structure
The educational level of netizen develops toward a lower degree of education
(IResearch, 2009b, p.17). 74.9% of netizens have the educational level at
senior high school or lower in June 2009, increasing from 29.9% in 2000. This
development demonstrates that Internet is no longer limited to high education
groups as it penetrates more widely. Figure 11 in the next page shows netizens’
educational structure from 2000 to 2009.Online Shopping Market in China 12
Figure 11: Netizens’ Educational Structure
Jun 09 33,9% 41,0% 12,7% 12,4%
2008 33,4% 39,4% 13,9% 13,2%
2007 27,8% 36,0% 18,7% 17,5%
junior high school
2006 17,1% 31,1% 23,3% 28,5% and below
2005 16,2% 30,2% 24,4% 29,2% senior high school
2004 13,0% 29,3% 27,1% 30,7%
junior college
2003 13,5% 29,3% 27,4% 29,8%
bachelor and
2002 12,9% 30,6% 26,1% 30,4% above
2001 10,2% 30,0% 26,9% 32,9%
2000 6,4% 23,5% 29,0% 41,1%
0% 20% 40% 60% 80% 100%
Source: CNNIC, January 2002, p.8; CNNIC, January 2003, p.4, p.10; CNNIC,
January 2004, p.12; CNNIC, January 2005, p.13; CNNIC, January 2006, p.15; CNNIC,
January 2007, p.12; CNNIC, January 2009a, p.20; CNNIC, July 2009, p.17
2.4. Trends in the Internet Development in China
Internet connection is expected to be more prevalent in China due to
continuous improvement in infrastructures, governmental promotion, and
increasing mobile access. The continuous economic growth in the following
years will lead to a constant increase in GDP per capital. Chinese population
will enjoy more dispensable income, which generates more informative and
recreational demands. Internet will penetrate more deeply in existing user
groups in all aspects of life and become more widely accessible across the
country.
2.5. Current Development of the Chinese Online
Shopping Market
2.5.1. Market Potential
The number of online buyers reached 87.9 million by June 2009, increasing
from 74 million in 2008 and 46 million in 2007. The online shopping penetration
rate achieved 24.8% by June 2009, meaning 1 out of 4 netizens has
purchased online in the past 6 months (CNNIC, July 2009, p.31; CNNIC, May
2009, p.31). The market value reached RMB 128.2 billion [USD 18.8 billion] in
2008 with a robust growth rate of 128.5% compared to 2007 (IResearch,Online Shopping Market in China 13
2009a, p.14). Figure 12 in the next page shows the sales revenue and the
growth rate of online shopping market from 2007 to 2012.
Figure 12: Value of Transactions and the Market Growth Rates in the
Chinese Online Shopping Market
billion (RMB)
900 140,0%
128,5% 791
800
120,0%
700 113,2%
576 100,0%
600
86,3%
500 80,0%
386,9 sales
400 62,0% 60,0% revenue
300 238,8 48,9%
40,0%
37,3% growth
200 128,2 rate
56,1 20,0%
100
0 0,0%
2007 2008 2009e 2010e 2011e 2012e
Source: IResearch, 2009a, p.14
Online sales accounted for 1.2% of retail sales in 2008 as Figure 13 shown
below. Relative to the US where online sales accounted for 6% of retailing
sales in 2008, Chinese online shopping market still has a large room to grow in
the future (IResearch, 2009a, p.16).
Figure 13: Percentage of the Online Retail Sales in the Total Retail Sales
in the Chinese Market
billion (RMB)
900,0 4,47% 5,00%
800,0 4,50%
3,64% 4,00%
700,0
600,0 3,50%
2,78%
3,00% Sales revenue
500,0
1,96% 2,50%
400,0 791,0 2,00%
300,0 1,20% 576,0 1,50%
Percentage of
200,0 0,63% online retail in
386,9 1,00% total retail sales
100,0 238,8 0,50%
56,1 128,2
0,0 0,00%
2007 2008 2009e 2010e 2011e 2012e
Source: IResearch 2009a, p.17Online Shopping Market in China 14
Chinese online shopping market is largely composed of the sales in C2C
marketplace, covering 93.2% of total online sales in 2008. Online B2C sales
accounts for 6.8% of total online sales in 2008 and has been increased rapidly.
Online B2C sales doubled in 2008 compared to 2007. As more enterprises
start to enter into the online B2C market, the sales is expected to expand
further (IResearch 2009a, p.19). Figure 14 below shows the composition of
online shopping sales of B2C and C2C sectors.
Figure 14: Value of Transactions in the Chinese Online B2C and C2C
Market
Billion RMB
900,0
800,0
700,0
600,0 292,0
500,0 176,4 B2C
400,0 C2C
300,0 86,9
31,8 499,0
200,0
8,7 399,6
207,0 300,0
100,0 4,3 119,5
0,0 51,8
2007 2008 2009e 2010e 2011e 2012e
Source: IResearch 2009a, p.19
In 2008, the purchasing amount per person achieved RMB 1,600 [USD 234.3],
with an increase of RMB 582 [USD 85.2] compared to the year 2007
(IResearch, February 12, 2009). Figure 15 below shows the constant growing
spending of online customers from 2003 to 2008.
Figure 15: Average Online Purchasing Amounts per User per Year
RMB
1800,0 1602,3
1600,0
1400,0
1200,0 1020,0
1000,0
800,0 610,4
600,0 482,9
400,0 229,5
200,0
127,6
0,0
2003 2004 2005 2006 2007 2008
Source: IResearch, February 12, 2009Online Shopping Market in China 15
2.5.2. Best Selling Product Categories
The most popular products sold online are fashionable goods, books, audio
and video products. The combined sales of apparels, fashionable accessories,
footwear and cosmetics reached RMB 27.46 billion [USD 4 billion] in 2008,
with a 136.8% growth compared to 2007. This product segment accounted for
21.4% of the total online sales in 2008 (IResearch, March 13, 2009). Table 1
below ranks the best sold items over Internet.
Table 1: Ranking of Best Sold Items over Internet, 2008
Items Purchased by % of Online Buyers
1 Apparel, accessories and footwear 57.1%
2 Books, CDs and DVDs 46.0%
3 Cosmetics 40.6%
4 Electronics (Cameras, MP3) 35.4%
5 Rechargeable cards for games and cell phones 32.1%
6 Home decorations 29.2%
7 Cell phones and electronic accessories 27.4%
8 Gifts and toys 24.7%
9 Computer, laptops and hardware 23.0%
10 Home appliances 22.1%
11 Jewelries, watches, accessories, glasses 20.3%
12 Foods 19.7%
13 Maternity and baby products 11.5%
14 White goods
2.9%
(fridges, washing machines, air conditionings)
15 Others 2.0%
Source: IResearch, March 13, 2009
Fashion products top the online shopping can be explained by three reasons.
First, online channels provide many cost advantages in offering wide
collections in this fast moving industry. Compared to physical stores, online
stores are not confined to limited shelf space. Changing customer
requirements and short product life cycles can be addressed rapidly. Second,
fashionable products are mainly high value-to-weight without major difficulties
in delivery concerning product defect during transport and expiration dates.
Third, the market demand for apparels is inherently strong. This industry
occupies a substantial share in the offline retailing business, ranking at the
second place after food products with RMB 2,400 billion sales revenue in 2006
(CNNIC, June 2008, p.30).Online Shopping Market in China 16
According to IResearch (2009b, p.24), high standardized products, like books
and CDs, have been one of the most sold products online. As online
customers gain more experience with online transactions and its convenience,
online purchases will not be limited to standardized products, but will contain a
broader product range for personalized needs.
2.6. Online Buyer Analysis
2.6.1. Gender
The ratio of male and female buyers is 45.6% and 54.4% in 2008 (IResearch
2009a, p.84). Figure 16 below compares the gender composition among
netizens and the online shopping customers in 2008.
Figure 16: Netizens and Online Customers’ Gender Distribution, 2008
Netizens 52,50% 47,50%
Male
Online Buyers 45,60% 54,40% Female
0% 20% 40% 60% 80% 100%
Source: IResearch 2009a, p.84
2.6.2. Age
Major online shopping buyers are aged from 18 to 30, accounting for more
than 57.4% of total online customers (IResearch 2009a, p.84). According to
IResearch (2009a, p.84) and CNNIC (January 2009a, p.18), 69.5% of online
customers and 67.1% of netizens are aged less than 30 in 2008. Figure 17
below shows the age structure of online shopping customers.
Figure 17: Online Customers’ Age Distribution, 2008
35,0% 33,3%
30,0%
24,1%
25,0%
20,0%
15,0% 12,1% 12,8%
8,9% 8,9%
10,0%
5,0%
0,0%
Under 18 18‐24 25‐30 31‐35 36‐40 40 and above
Source: IResearch 2009a, p.84Online Shopping Market in China 17 2.6.3. Income The average income of online customers is higher than that of netizens. Compare netizens’ income level with that of online shoppers, 27.6% of netizens and 51.1% of online customers have the salary over RMB 2,000 [USD 292.9] respectively (CNNIC, July 2009, p.19, CNNIC, June 2008, pp.44-45). Table 2 below shows the income per month of online customers in June 2008 Table 2: Monthly Incomes of Online Customers, June 2008 Source: CNNIC, June 2008, p.51 Income level has a positive influence toward online purchasing amounts. The higher the income level, the more purchasing amounts. As Figure 18 indicates in the next page, 25.4% of online buyers whose monthly income exceeded RMB 5,000 [USD 732.3] spent more than RMB 5,000 online in the whole year 2008. In contrast, 59% of online buyers with income less than RMB 1,000 [USD 146.5] purchased less than RMB 1,000 online in 2008. This is because high income customers have far less time and higher opportunity costs for offline shopping. Online shopping provide time saving benefits for their purchasing needs (IResearch 2009b, p.31).
Online Shopping Market in China                                18

Figure 18: Online Buyers’ Yearly Purchasing Amounts by Income, 2008

     5001 and above                     22,6%      23,4%          28,6%              25,4%
                                                                                                 Purchasing amount
Monthly income (RMB)

                       3001‐5000         32,3%            26,9%          25,3%           15,5%
                                                                                                   1000 and below

                       2001‐3000           42,6%               25,2%       22,4%          9,8%     1001‐3000

                       1001‐2000                53,3%              23,6%     15,1%        8,0% 3001‐5000
                                                                                                   5001 and above
    1000 and below                               59,0%                   24,6%     10,1% 6,3%

                                   0%       20%          40%       60%       80%         100%

Source: IResearch 2009b, p.31

Income level of online customers differs by regions. The online customers in
Shanghai have higher income level than the customers in other sub-provincial
cities. Table 3 below shows online customers’ income structure by cities.

Table 3: Online Customers’ Income Structure by Cities, June 2008
                                                                                                Above
                                                 Under 500     501-2000      2001-5000                     Total
                                                                                                5000

Beijing                                            11.2%          28.2%          42.7%          17.9%     100%

Shanghai                                           10.7%          25.5%          38.1%          25.8%     100%

Guangzhou                                          13.5%          29.2%          37.5%          19.8%     100%

Other sub-provincial cities                        14.7%          42.4%          31.1%          11.8%     100%

Source: CNNIC, June 2008, p.51

2.6.4.     Educational Structure
Online buyers have average higher educational level compared to netizens. In
June 2008, 84.9% of online customers have the educational level of junior
college or above. Among netizens, only 36.2% have the educational degree of
junior college and above in June 2008 (CNNIC, June 2008, p.48). Table 4 in
the next page shows the educational level of online buyers.
Online Shopping Market in China 19
Table 4: Online Customers’ Educational Level, June 2008
Source: CNNIC, June 2008, p.48
2.6.5. Length of Prior Internet Experience
Netizens who have been using Internet for a longer period of time have more
opportunities to experience online applications more frequently and have more
tendencies to become online customers. According to IResearch (2009b, p.16),
2 to 3 years are generally required for Internet beginners to understand online
shopping and become online customers. Afterwards, new online buyers will be
converted into either active online customers with repeat purchases, less
involved buyers or buyers who discontinue subsequent purchases. As Table 5
below shows, more than 80% of online shopping customers have used Internet
for more than 5 years. This indicates that the number of online customers is
expected to increase as more new Internet users become more familiar with
Internet and other online applications (CNNIC, June 2008, p.47).
Table 5: Length of Prior Internet Experience among Online Customers in
Different Cities
2003 and
2004 2005 2006 2007 2008 Total
before
Beijing 84.5% 5.5% 3.5% 3.8% 2.0% 0.8% 100%
Shanghai 84.0% 7.0% 4.0% 1.5% 2.0% 1.5% 100%
Guangzhou 82.5% 5.8% 5.8% 2.5% 3.5% 0.0% 100%
Other sub-provincial cities 81.6% 7.6% 4.4% 2.9% 3.2% 0.2% 100%
Source: CNNIC, June 2008, p.47
2.6.6. Region
Online customers are concentrated in top tier cities1 including municipalities
and sub-provincial cities. In 2008, the online customers in Beijing, Shanghai
1
Due to the lack of a unified definition on tiers of cities, the administrative divisions defined by
Ministry of Civil Affairs of the PRC will be applied here. First tier cities refer to municipalities
and sub-provincial cities. Second tier cities refer to prefecture-level cities.Online Shopping Market in China 20
and Guangzhou accounted for 28.8% of total online buyers. The customers in
these three cities alone covered 33.1% of total online shopping sales.
According to IResearch, the penetration rate of online shopping in Shanghai
and Beijing reached 67.2% and 65.3% respectively (IResearch 2009a, p.26).
Table 6 below exhibits the detailed penetration rates in each region.
Table 6: Online Customers’ Scale and Penetration Rates by Region, 2008
Number of Online Number of Netizens Online Shopping
Region
Customers (million) (million) Penetration Rate*
Whole China 87.88 338.00 26.8%
Shanghai 7.46 11.10 67.2%
Beijing 6.40 9.80 65.3%
Guangdong 9.18 45.54 20.1%
Zhejiang 7.29 21.08 34.6%
Jiangsu 7.06 20.84 33.9%
Shandong 4.10 19.83 20.7%
Hubei 3.15 10.50 30.0%
Sichuan 3.15 11.03 28.5%
Fujian 3.08 13.79 22.4%
Hunan 2.52 9.99 25.2%
*Online shopping penetration rate in this section is defined as online customers who have
purchased online within the whole year 2008
Source: IResearch 2009a, pp.26-27; CNNIC, July 2009, p.11, p.32
In this section, a different methodology is used to define the penetration rate of
online shopping. The online shopping penetration here is calculated by the
number of customers who have purchased online within the whole year 2008
divided by the number of netizens within the region. This is different from the
definition of CNNIC where the online shopping penetration rate refers to the
proportion of customers who have online purchase experience within 6 months
rather than within a whole year.
Compared with the country-wide penetration rate of online shopping 26.8%,
the penetration rate in Zhejiang, Jiangsu, relatively wealthy provinces of
Yangtze River delta, achieved more than 30%. The penetration rates in Hubei
and Sichuan also surpassed the country’s average. In terms of online salesOnline Shopping Market in China 21
value, Zhejiang, Jiangsu, Shandong, Fujian, Sichuan, Liaoning and Hubei
have increased their importance within the country and demonstrate their
growth potentials (IResearch 2009a, pp.26-27). Figure 19 below shows the
online sales by region in 2008.
Figure 19: Value of Online Shopping Transactions by Region, 2008
100% others
90%
25,8%
80% 39,1% Shandong, Fujian,
70% Sichuan, Hubei, Liaoning
20,1% Beijing
60%
50% 16,4% 9,0% Jiangsu
40% 7,5% 10,0%
30% 7,8% 11,0% Zhejiang
20%
8,7%
9,7% 11,1% Guangdong
10%
10,8% 13,0%
0% Shanghai
Jan ‐ June 2008 2008
Source: IResearch 2009a, p.27
2.6.7. Payment Methods
The number of online payment users reached 75.7 million. Among all netizens,
the online payment penetration rate reached 22.4%. 86.2% of online buyers
have used online payment by June 2009 (CNNIC, July 2009, p.32). Other than
online payments, fund transfer can be done via cash on delivery, bank or post
transfer. Despite the fact that online payment is prevalent; cash on delivery is
still one of the preferred payment methods offered by major online retailers.
Table 7 below shows the most used payment tools for online transactions in
2008.
Table 7: Most Used Payments Methods by Online Customers, 2008
% of Most Used Payment Methods
Online third-party payment platform 50.4%
Online banking 21.4%
Cash on delivery 16.8%
Bank transfer 3.8%
Post transfer 3.1%
Card on delivery 2.3%
Cash and carry 0.9%
Mobile payment 0.7%
Telephonic payment 0.4%
Source: IResearch 2009a, p.100Online Shopping Market in China 22
In terms of online payments, major service providers are Alipay, Tenpay, and
UnionPay. These three operators occupying 78.1% of online payment market
share (IResearch, July 28, 2009). The rest of market is divided by more than
50 smaller service providers (Shi, June 2009, p.155). Providing services
similar to PayPal, Alipay and Tenpay belong to Alibaba and Tencent group
respectively. UnionPay is the government-owned online payment system
which connects major Chinese banks. Figure 20 below shows the market
share of major online payment providers.
Figure 20: Market Share of Online Payment Providers in China, 2008
21,9%
Alipay
47,4% Tenpay
8,0%
UnionPay
22,7% Others
Source: IResearch, July 28, 2009
2.6.8. Determinants of Online Purchase Decisions
Major factors affecting online purchasing decisions include reputation of sellers,
after sales services, other buyers’ feedbacks, delivery timing and quality, price,
brand recognition, web surfing speed, promotions, advertisements and user
interface of websites (IResearch 2009b, p.28).
From customers perspectives, sellers’ reputation, other users’ feedbacks and
after sales services are three underlying factors which determine the level of
reliability and security of online purchases. These are areas where online
sellers could enhance performance by reducing buyers’ perceived risk and
gaining trustworthyness from customers (IResearch 2009b, p.23).
As Figure 21 and 22 shown in the next page, male and female online
customers express similarities and differences for online shopping decision
making. Reputation of sellers is one of the most influential factors for both male
and female customers in their online purchase considerations. Other users’
feedbacks are regarded as slightly more important for female customers than
for males. Male buyers consider more on price and after sales service.
According to IResearch (2009b, p.28), the difference are resulted fromOnline Shopping Market in China 23
psychological reasons and product characteristics. Male customers are more
likely to act rationally and seek more measurable hard product information.
Products purchased by females tend to be relatively less standardized. In this
case, soliciting advice from other users may facilitate decision making
(IResearch 2009b, p.28).
Figure 21: Key Influencing Factors on Online Purchasing Decisions of
Male Customers, 2008
After sales service 4,2
Reputation of seller 4,2
User' review 4,1
Price 4,1
Brand 3,9
Delivery 3,9
Surfing speed 3,7
Information in online community 3,4
User interface of website 3,3
Advertisement and promotion 3,3
0 0,5 1 1,5 2 2,5 3 3,5 4 4,5
Source: IResearch 2009b, p.28
Figure 22: Key Influencing Factors on Online Purchasing Decisions of
Female Customers, 2008
User' review 4,3
After sales service 4,3
Reputation of seller 4,3
Price 4,2
Delivery 4,0
Brand 3,9
Surfing speed 3,7
Advertisement and promotion 3,5
Information in online community 3,4
User interface of website 3,3
0,0 0,5 1,0 1,5 2,0 2,5 3,0 3,5 4,0 4,5 5,0
Source: IResearch 2009b, p.28
2.6.9. Information Channels Among Netizens
Among netizens, Internet, friends and families are major sources of
information for online shopping websites. These channels have outpaced theOnline Shopping Market in China 24
traditional offline advertisements (CNNIC, June 2008, p.29). Figure 23 below
shows netizens’ information channel to acquire information of online shopping
websites.
Figure 23: Netizens’ Media Channels for Information of Online Shopping
Websites, June 2008
Internet 70,5%
Friend and relative 52,6%
TV 9,2%
Advertisement in magasine 8,0%
Outdoor advertisement 5,3%
Newspaper 5,2%
Activity organised by enterprise 0,5%
Radio 0,4%
0,0% 20,0% 40,0% 60,0% 80,0%
% of netizen
Source: CNNIC, June 2008, p.29
Among online advertising tools, important components are search engines
advertisements and links exchange with other websites targeting similar group
of audiences (CNNIC, June 2008, p.31). Blogs has gained rising importance
as well. 53.8% of the netizens own a blog or a web space. 35.3% of total
netizens update their blogs within 6 months (CNNIC, July 2009, p.30).
2.6.10. Future Development of Online Shopping Customers
Changing customer behaviors can cause significant impact on any company’s
operations and strategies, notably in the dynamic online shopping industry.
Some potential changes in Chinese online customers are identified as below:
y Wider and deeper penetration of online shopping
Online shopping will penetrate more widely and deeply in the daily lives. As
netizens use Internet for a longer time, shoppers will gain more familiarity
toward online technology. More interactions will be generated between
customers and online applications (CNNIC, June 2008, p.47). While web
browsers become more accustomed to online applications, they will have more
opportunities to acquire online shopping information and to be engaged in
online purchases.
Though metropolitan cities account for the main part of online shopping sales,
the sales contribution from second tier cities has shown a steady increase. TheOnline Shopping Market in China 25 penetration rates in Beijing and Shanghai will become more saturated in the future as 65.3% and 67.2% of netizen already had online purchase experience in 20082. In the future, second tier cities will provide opportunities for the continuous growth in this market (IResearch 2009a, pp.26-27). y More focus on convenience and personalized needs Price has been one major concern for Chinese online shopping customers. Customers purchase online mainly for better prices in the beginning. As online customers gain more knowledge about online shopping, price will not necessarily be the dominant deciding factor anymore. Convenience will become one of the core values, especially for those time-starved white collars and middle class who appreciate efficiency and flexibility in their tight schedules. Customers will develop more confidence in online shopping and purchase wider product categories online due to the improvements of product varieties and complementary services. Online sellers will learn to understand customers’ needs and provide more specialized products and services. Moreover, logistic providers have enhanced their service coverage. Online retailers have also become more skilled in marketing techniques. The enhancing service level will lead to more customer satisfaction and positive growths in the industry. To sum up, online customers are expected to be more aware of the value and advantages of online shopping in the coming years. More personalized needs and offers will emerge. As online shopping gets more involved in customers’ lifestyle, more unique personal styles will arise. Furthermore, as regulations of online shopping market have become more comprehensive, perceived risk of online shopping can be further reduced. This indicates positive outlook to the market growth in the future. 2 The online shopping penetration rate mentioned here is defined as the percentage of netizens who purchased online among number of netizens within the whole year 2008
Market Participants in the Online Retailing Market and their Business Model          26

3.        Market Participants in the Online Retailing

          Market and their Business Models

3.1.          Overview of the Online Retailing Market
In the Chinese online B2C market, Taobao platform is the market leader with
20.2% of market share, followed by 360Buy, Amazon and Dangdang with
16.1%, 12.1% and 11.3% of the market share respectively in 2008. Details of
the online retailing market share and the sales revenues of major retailers can
be found in Figure 24 and Figure 25 below.

Figure 24: Market Share of Online Retailers in China, 2008

                         PPG
                  Menglu 1,3%
                   1,8%       Others           Taobao B2C
                  99read      15,6%             platform
               1,8%                              20,2%
       Redbaby
         3,5% 139shop                                360Buy
                4,2%                                  16,1%
              Vancl                         Amazon
              4,3%                   Dangdang12,1%
                        M18
                                      11,3%
                        7,9%

Source: IResearch 2009a, p.35

Figure 25: Value of Transactions of Major Online Retailers, 2008

    Taobao                                                           1,76
    360Buy                                                    1,41
   Amazon                                              1,05
  Dangdang                                           0,98
       M18                              0,69
   139shop                 0,37
      Vancl                0,37
   Redbaby               0,3
                                                                                billion
              0                0,5               1            1,5           2   (RMB)

Source: IResearch 2009a, p.37

The general characteristics of the Chinese online shopping market are
Market Participants in the Online Retailing Market and their Business Model 27 discussed below. • High competition intensity in the online retailing market The online shopping industry is going through a period of fast growth and turbulence with fierce competition. Major players compete to gain a controlling share of the market in all aspects (Analysys International, June 15, 2009). Common promotional activities including price discounts and shipping cost reductions are widely used to gain customers. As one online shopping mall takes initiatives on sales promotion, competing firms follow very shortly (Economic Observer, August 16, 2009). Automatic price comparison system is adopted by top players to offer best prices among competitors and modify automatically online price to a comparable level if rivalry companies’ reduce their prices. Due to the intense price competition, online buyers are swayed by lower prices with relatively low brand loyalty (Economic Observer, August 16, 2009) One difference between offline and online shopping is that physical supermarket in the neighborhood without price advantages or product differentiation can still survive by its convenience. However, online retailers are easily neglected if product distinction or further values are not provided. Moreover, purchasing online involves less opportunity costs relative to offline shopping because price comparison between several online malls can be realized within a second (Liu, May 15, 2009). This aggravates the price competition and lead to squeezed profits in the market. Online retailers compete with all means for winner-takes-all markets in the long run (Economic Observer, August 16, 2009). Most large scaled online B2C retailers still struggle to become profitable due to lack of scale economies; therefore, inability to achieved reduced costs per unit (Analysys International, June 15, 2009). Meanwhile, new comers backed by venture capitalists enter this market to a great extend. A number of young established specialist retailers emerge by offering specific product categories, like online specialists in food, clothes, and shoes (IResearch, April 28, 2009). • Wholly-owned logistic service To increase customers’ online shopping experience, major large online retailers, like 360Buy and Amazon invest in their own logistics systems. Different from other online business operations in developed markets, online retailers in China are not purely electronic companies dealing with information flow but bear more responsibilities in complementary services. In Chinese
You can also read