NUMERICAL AND EXPERIMENTAL STUDY OF UNREINFORCED BRICK MASONRY WALLS SUBJECTED TO BLAST LOADS
←
→
Page content transcription
If your browser does not render page correctly, please read the page content below
M. Chiquito, et al., Int. J. Comp. Meth. and Exp. Meas., Vol. 9, No. 4 (2021) 296–308

    NUMERICAL AND EXPERIMENTAL STUDY OF
 UNREINFORCED BRICK MASONRY WALLS SUBJECTED
               TO BLAST LOADS
          MARÍA CHIQUITO1, SIMON K. CLUBLEY2, SANTIAGO MARTINEZ-ALMAJANO1,3,
                  ANASTASIO P. SANTOS1, RICARDO CASTEDO1 & LINA M. LOPEZ1
                      1 ETSI Minas y Energía, Universidad Politécnica de Madrid, Spain.
           2 School of Architecture, Building and Civil Engineering, Loughborough University, UK.
                               3 Escuela Politécnica Superior del Ejército, Spain.

                                              ABSTRACT
Masonry walls are one of the most widely used constructive elements in buildings. They offer a cost-
effective option and can satisfy many buildings requirements. However, their brittle composition leads
them to generate high-speed debris under blast loads. Many casualties arise due to this kind of frag-
ments. Strengthening of masonry walls is of much importance to increase safety inside the buildings.
For this purpose, it is desirable to carry out field tests to assess the improvement of reinforcement
measures, but the cost and complexity of these experiments can be very high. Therefore, numerical
modelling is a good alternative to evaluate the behaviour of brick masonry walls under blast loads.
Uncertainties in numerical modelling may be significant due to the composite nature of the reinforced
masonry construction and the number of variables describing the constituent materials. In this work, a
finite element simulation of a blast-loaded brick masonry wall validated with corresponding field tests
is presented. A total of 24 brickwork masonry walls panels at full scale were tested in six different trials
with explosives charges. In the configuration of each test, there was one unreinforced wall and three
walls with different protective solutions. This paper focuses on the study of unreinforced walls. A 3D
pure Lagrangian approach using LS-DYNA was developed with appropriate blast parameters derived
from CONWEP, material models and suitable boundary conditions. Results of numerical modelling are
compared in terms of wall displacement with the field data obtained in the trials. Study results show
good agreement between the field test and the numerical modelling, demonstrating that the model is
consistent and reliable.
Keywords: explosive, FEM simulation, full-scale tests, masonry walls.

                                      1 INTRODUCTION
Unintentional or intentional explosions constitute a great hazard for structures and their occu-
pants. As it is not possible to eliminate the threat, studies on improving safety inside the
buildings have increased in the last decades to mitigate blast loads effects. Current research
focuses on reinforcement solutions to prevent the collapse of structures. The reinforcement
is achieved by increasing the strength of materials (in the process of designing and planning
a new structure) or by using retrofit techniques (to strengthen existing structures) [1, 2].
In recent years, the study of the behaviour of masonry walls subjected to blast loads has
increased [3–5]. This is due to the hazard represented by this kind of constructive elements
as their brittle composition leads them to generate high-speed debris after an explosion event.
Masonry walls consist of units and mortar, and their geometries, properties and bonding can
vary forming different masonry assemblages. Thus, masonry is classified as a heterogeneous
anisotropic material, making the analysis, understanding and prediction of structural behav-
iour particularly complex.

© 2021 WIT Press, www.witpress.com
ISSN: 2046-0546 (paper format), ISSN: 2046-0554 (online), http://www.witpress.com/journals
DOI: 10.2495/CMEM-V9-N4-296-308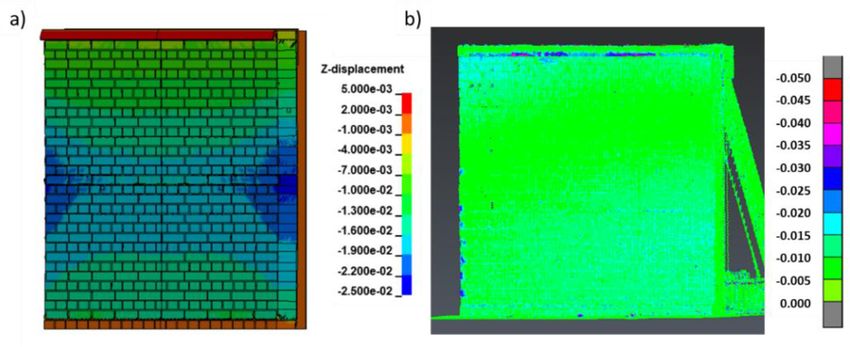
M. Chiquito, et al., Int. J. Comp. Meth. and Exp. Meas., Vol. 9, No. 4 (2021)   297

   In the field of research for protective solutions, it is desirable to carry out field tests to
validate results. However, analysing the behaviour of structures through field tests is very
difficult due to the complexity and the high cost of the experiments. For that reason, as well
as the limitation of available facilities, the experiments are sometimes not carried out at full
scale, which might be a problem depending on the parameters analysed. Scale effect may
affect the results, mainly the failure pattern. For these reasons, numerical modelling using a
finite element (FE) method appears as a good alternative to reproduce blast scenarios. How-
ever, in case of masonry walls subjected to blast loading, the complexity of the problem
implies the need to adopt simplifying and conservative assumptions. Therefore, field tests are
mandatory to validate the results and calibrate analytical models [6–8]. Additionally, due to
the composite nature of the masonry construction, uncertainties in numerical modelling are
increased. Numerical models can be validated with the corresponding field test to extrapolate
the results to other untested scenarios.
   There are different commercial FE codes available for modelling structural, non-linear
dynamic responses. All these offer reasonable results compared with physical experiments.
There are two main modelling approaches for masonry constructions: macro-modelling and
micro-modelling. Macro-modelling is a continuous approach by homogenisation. There is
no distinction between units and mortar, and the material properties are obtained as aver-
age properties from a representative volume of element [9,10]. The main advantage of this
methodology is to save computational time. However, this method cannot capture the failure
mode correctly due to the large number of influence factors related to bricks and mortar
and the interaction between these two elements. In the micro-model approach, in turn, it is
possible to distinguish between simplified and detailed micro-modelling [11,12]. In the sim-
plified approach, units are expanded by adding the mortar thickness and the joint interfaces
are modelled based on a surface-based cohesive approach. The use of the simplified micro-
model is justified when failure planes coincide with the location of mortar joints as in this
approach failure is restricted to happen only at the interfaces between units. In the detailed
approach, units and mortar joints are modelled separately, each one with their own proper-
ties. Micro-modelling produces more accurate results than macro-modelling, but it is a very
time-consuming method. But, when the objective is to find a reliable model, micro-model is
the best option to get the most accurate results.
   In this work, a FE model of a brick masonry wall using a detailed micro-modelling
approach is presented. The study is focused on the comparison of the displacements meas-
ured in the field test by a laser scanner with those obtained in the numerical model. Only the
unreinforced walls were used for the calibration of the numerical modelling. Results show
that it is possible to build a numerical model, which provides a good approximation to the
observed behaviour of the structure. These models might then be used to explore situations
for which no testing has been performed.

                                2 EXPERIMENTAL TESTS
The experimental study comprised two campaigns of field test. A series of brickwork masonry
walls were tested in different trials. The first test campaign consisted of four tests and was
carried out in 2018, and the second campaign consisted of two more tests and was carried out
in 2019. Each trial was designed for four walls to be tested at the same time (see Fig. 1.a). In
each test, there was one unreinforced wall and three walls retrofitted with different protec-
298         M. Chiquito, et al., Int. J. Comp. Meth. and Exp. Meas., Vol. 9, No. 4 (2021)

Figure 1: (a) Layout of the field test; (b) welding point on the top steel beam; (c) the bottom
           part of the wall directly resting on the foundation slab.

tive solutions, so that the behaviour of the different specimens could be directly compared
with respect to the same blast scenario. In all cases, the walls were placed at 5 m from the
explosive charge. The same set up and instrumentation were used for all the tests. Four steel
reaction frames were built to support the walls during the tests. The walls were supported
only at the top with welding points (for this, a UPN profile was placed on the top of the wall)
and at the bottom by their own weight on an existing foundation slab, thus simulating the
normal support conditions of a brick wall in a building. Details of the boundary conditions
are shown in Fig. 1. The dimensions of the test specimens were 2.5 × 2.5 × 0.24 m. All panels
were developed with the ‘English’ bond type. Each panel was built using clay masonry units.
The bricks were joined using a standard mortar for ordinary use. The mortar joints were
around 10 mm thick.
   Table 1 summarises the main characteristics of the tests. For the first campaign, charge size
was increased progressively after the first trial as the level of damage achieved was not the
expected. In the test T1, only few cracks appeared on the outer faces of the walls with no dis-
tinction between the unreinforced and reinforced walls. In the second and third tests (T2 and
T3), the charge used was the same achieving an intermediate level of damage on the walls.
Finally, for the test T4, the charge was increased again with the aim of taking to the limit
the unreinforced wall, which finally collapsed in this test. For the second phase, the same
charge was used in both tests. As two of the four walls collapsed in test T4, for the M1 test,
the charge selected was slightly reduced with respect to that of the T4 test. In this case, the
four walls collapsed because of a welding failure at the top support. Due to the top support, a
membrane thrust force can be developed under lateral loading known as ‘arching action’. In
absence of this support, the flexural strength decreased, and hence, the walls failed. For this
reason, the test M2 was carried out with the same charge as that of the M1 test. In addition,
some changes were introduced in the specimens for the second campaign, being the most
relevant to the present study:
•• The outer face of the walls was not covered with mortar.
•• The mortar used in the construction had a higher compressive strength.
   All the tests were monitored with pressure gauges (high frequency with ablative protection
and 5000 PSI range), accelerometers (shock, ceramic-shear, with 5000 g range), a high-speed
camera (Photron FASTCAM SA3-120k) and a laser scanner (Leica Geosystems Scan Station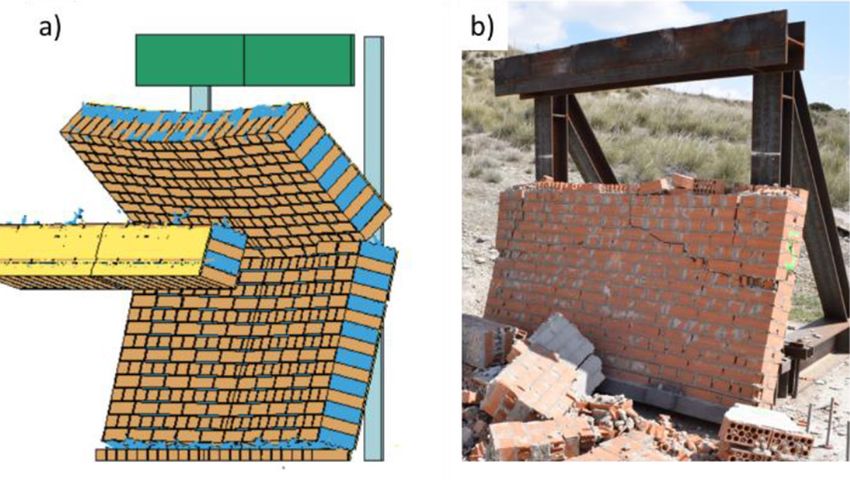
M. Chiquito, et al., Int. J. Comp. Meth. and Exp. Meas., Vol. 9, No. 4 (2021)       299

                                 Table 1: Characteristics of the tests.

 Test               Charge TNT                  Scaled Distance              Charge Height
 #                  kg                          m/kg1/3                      m
                                                Phase 1
 T1                 22.60                       1.77                         0.5
 T2                 31.40                       1.58                         0.7
 T3                 31.40                       1.58                         0.7
 T4                 84.40                       1.14                         0.7
                                                Phase 2
 M1                 70.71                       1.21                         0.7
 M2                 70.71                       1.21                         0.7

P30/P40 laser). All the information extracted from the field tests such as pressure, acceler-
ation or displacement were used to assess the damage on the walls as well as to check and
compare with the data extracted from the numerical modelling. Furthermore, data were used
to characterise the explosion and to recalculate the TNT equivalent. More details about the
tests and results can be found in Chiquito et al. [13, 14].

2.1 Evaluation of displacement

To evaluate the displacements, a 3D laser scanner (see Fig. 2.a) was used to measure the
geometry of the walls. During each test, 14 scans were made, seven before and seven after
the detonation, allowing one to obtain a point cloud of the entire environment. Finally, a
transformation was performed so that both clouds were in the same coordinate system. With
these data, a geometric analysis was performed.
   The three-dimensional study was carried out using Leica Cyclone software and 3D
Reshaper Hexagon Group. In this study, the different point clouds on the measured walls
were analysed in comparison to the initial measurement. A best fit of each element is made
using the initial data, and then, the displacement study of each element was carried out.
   For the graphic analysis according to the calculated displacements, the following inter-
vals in metres have been used: 0–0.005, 0.005–0.01, 0.01–0.015, 0.015–0.02, 0.02–0.025,
0.025–0.03, 0.03–0.035, 0.035–0.04, 0.04–0.045 and 0.045–maximum. An example of the
result obtained is shown in Fig. 2.
   After comparing both clouds of points, the following displacements of the walls have been
obtained:

• Maximum displacement on each wall.
•• Displacement at point ‘O’ at coordinates (x = 1.12; y = 1.235).
•• Displacement along the x-direction at y = 1.235 every 0.25 m.
• Displacement along the y-direction at x = 0; x = 0.50; x = 1.00;                 x = 1.25; x = 1.50;
     x = 2.00; x = 2.50.

  To compare the results of the tests, the evaluation is made using the proposed Displace-
ment Damage Index, Id: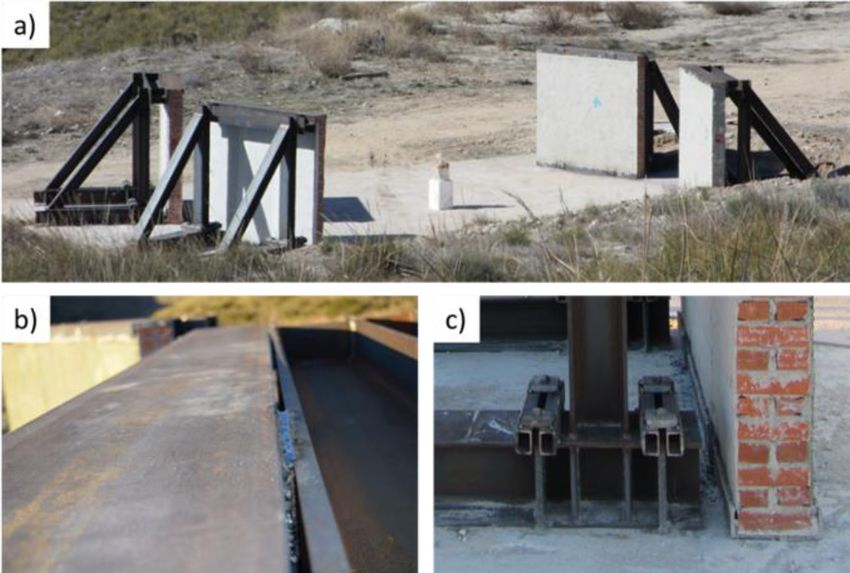
300         M. Chiquito, et al., Int. J. Comp. Meth. and Exp. Meas., Vol. 9, No. 4 (2021)

Figure 2: (a) Laser scanner used during the tests; (b) example of measured displacement
           obtained from the laser scanner.

                                                     n    2
                                                 ∑     δ
                                                     i =1 pl ,i                              (1)
                                         Id =
                                                      n
   where δpl,i is the plastic displacement measured at point i and n is the number of points
evaluated. This index provides an idea of the mean plastic displacement but avoids the com-
pensation between positive and negative plastic displacements.
   Table 2 shows the results obtained in terms of the Displacement Damage Index (Id) and
maximum displacements. Support displacements were significant in the first test, in which
the base of wall moved due to the blast, until it was retained by the ground frame profiles.
For the rest of the tests, wooden elements were introduced between the bottom of the wall
and the supporting frame to avoid this type of behaviour, which would contribute to dissi-
pation of energy. For this reason, it is thought that the damage measured in the first test may
be underestimated and equivocal differences between specimens may arise due to different
initial spacing between wall and ground profiles. The unreinforced specimen in test T3 shows
an anomaly as it was barely damaged, which can be attributed to a directional behaviour of
the pressure wave.
   For displacements, the Unified Facilities Criteria establishes the maximum deflection lim-
its as a function of resistance with a maximum value of deflection not exceeding the wall
thickness. Taking this data as a reference, a value of 100% is assigned to the collapsed walls,
corresponding to a maximum displacement greater than the wall thickness, that is, 240 mm.
The rest of the displacements are relativised with respect to the thickness value as can be seen
in Table 2. Due to the surface finish of the walls, the displacements considered are in some
cases located on a hole or a detached material zone. For this reason, maximum displacements

   Table 2: Values of Displacement Damage Index and Maximum Displacements (Dmax).

 Test               Z (m/kg1/3)          Id (mm)                  Dmax (mm)       Dmax (%)
 T1                 1.77                 6.47                     22.72           9.47
 T2                 1.58                 10.15                    51.99           21.66
 T3                 1.58                 5.63                     19.12           7.97
 T4                 1.14                 –                        >240.00         100.00
 M1                 1.21                 –                        –               –
 M2                 1.21                 6.18                     26.10           10.88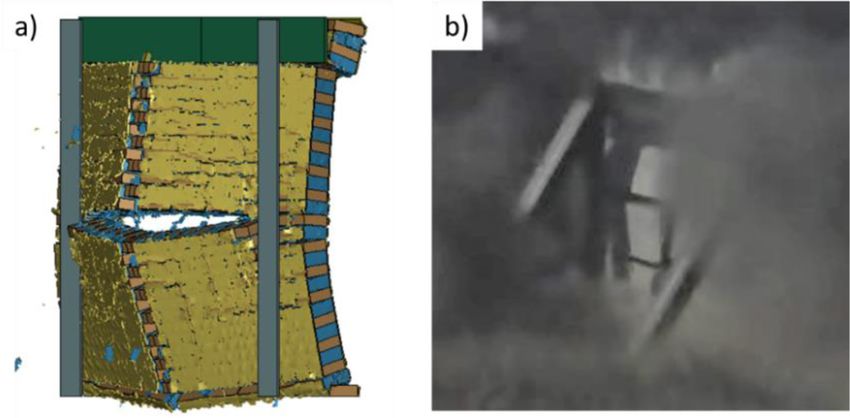
M. Chiquito, et al., Int. J. Comp. Meth. and Exp. Meas., Vol. 9, No. 4 (2021)   301

are related not only to plastic deflections and must be analysed with care. The maximum
displacement of the walls considered has been calculated as the maximum relative distance
between two points of the wall, avoiding detached areas.
   In addition to these parameters, displacements along vertical profiles were measured
(see Fig. 3). These profiles were taken at coordinates x = 0, x = 0.50, x = 1.00, x = 1.25,
x = 1.50, x = 2.00 and x = 2.50 (coordinates in meters). This information provides a good idea
of the failure mode and the deflection suffered by the walls. After analysing the data, it was
concluded that the trend followed in the different profiles were very similar, and hence, only
three of the seven profiles obtained have been represented here. These vertical axes are at the
centre and the ends of each wall (i.e., coordinates x = 0, x = 1.25 and x = 2.50 m) considering
displacements at different heights y = 0, y = 0.50, y = 1.25, y = 2.00 and y = 2.50 (coordinates
also in meters) for comparison purposes.
   The results of the T1 test are not drawn because of the problem explained earlier related to
the movement of the wall base as they would be unrealistic. For the other tests (T2, T3 and
M2), profiles are shown in Fig. 4. It can be checked that the three profiles follow the same

           Figure 3: Coordinates where the vertical profiles have been measured.

      Figure 4: Displacements along vertical axes at the centre and edges of the walls.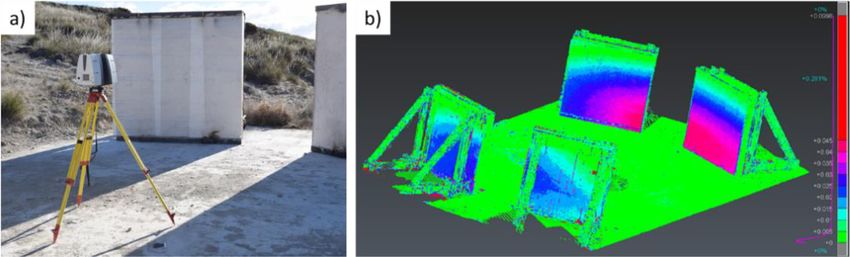
302         M. Chiquito, et al., Int. J. Comp. Meth. and Exp. Meas., Vol. 9, No. 4 (2021)

tendency for each wall. It can be also appreciated that there are positive and negative dis-
placements produced by the bending mechanism. For this reason, the Displacement Damage
Index has been calculated as a root mean square.

                                   3 NUMERICAL MODEL
The LS-DYNA FE code [15] has been used as calculation tool. It is widely used for the
modelling of strongly non-linear problems. The masonry walls have been simulated by using
a detailed micro-modelling approach. Due to the symmetry planes of the structure, only a
half of the wall is modelled considering the vertical symmetry plane. Clay bricks and mortar
have been modelled separately, and the bonding between them is simulated by an automatic
surface to surface contact. In addition, for the tests of the first campaign, the outer layer of
mortar has been modelled.
   Bricks used in the field tests were perforated clay brick units but, to simplify the model,
holes are not considered as they were partially grouted with mortar. However, an average
density for bricks is applied to keep the mass balance between the model and the specimen.
Dimensions of the bricks used in the numerical model are 240 × 110 × 70 mm. For mortar
joints, an average width of 10 mm is used in the model as in the specimens, this width varied
slightly from joint to joint. All parts of the model have been defined with three-dimensional
solid elements. The geometrical model measures 2.47 × 1.25 m and has a total of 234,228
solid elements. Figure 5 shows some details of the numerical model.
   A mesh sensitivity test has been carried out. The mesh sizes were selected regarding the real
size of the different elements of the model. As the mortar joint width was 10 mm, the same
size was used for meshing. As the brick length was 240 mm, three different mesh sizes were
tested: 10 mm, coinciding with the mortar mesh and hence merging nodes and 20 and 40 mm
to try to save computational time. For the 10-mm mesh size, results were not good in all cases,
so this mesh size was discarded. On the other hand, both 20 and 40 mm offered similar results,
being acceptable when compared with the field test data. Therefore, a 40-mm mesh size was
selected, as shown in Fig. 5, to reduce the number of elements and thus the computation
time.

 Figure 5: Geometrical model and details of the bricks and mortar joints and their meshes.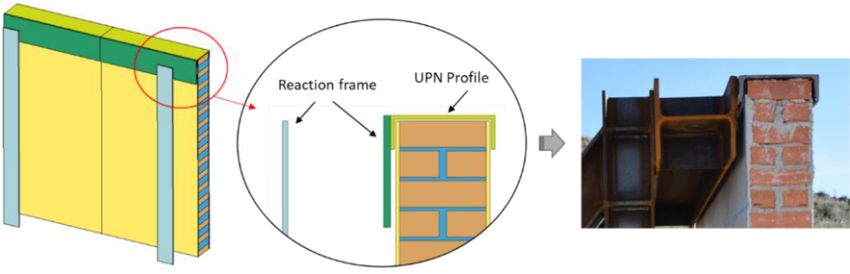
M. Chiquito, et al., Int. J. Comp. Meth. and Exp. Meas., Vol. 9, No. 4 (2021)         303

                      Figure 6: Details of boundary conditions modelled.

         Table 3: Material properties for brick and mortar used in numerical modelling.

                            Young’s                      Tensile        Shear          Compressive
              Density       modulus        Poisson’s     strength       strength       strength
              (kg/m3)       (MPa)          ratio         (MPa)          (MPa)          (MPa)
 Brick        1600          4710           0.12          0.785          0.785          12.00 (*)
 Mortar       1800          5085           0.20          0.160          0.250          3.50 (*)
(*) Experimental values. Other values derived from compressive strength (Young’s modu-
lus and tensile strength) or assumed.

   In this study, boundary conditions have great influence on the results as they contribute
to increasing the flexural strength of the walls. For this reason, part of the reaction frame as
well as the UPN top profile has been modelled as can be seen in Fig. 6. Since the walls were
simply supported at the bottom, the same condition has been reproduced in the numerical
model by motion restrictions on boundary nodes.
   For simulating the blast loading, a purely Lagrangian approach is implemented by the
application of the empirical blast loading function developed by Kingery and Bulmash [16]
and computed with CONWEP. The *LOAD_BLAST_ENHANCED command allows the
application of the pressures of the shock waves directly to Lagrangian elements of structure.
   The material model used for both brick and mortar is *MAT_96 (MAT_BRITTLE_DAM-
AGE), which is an anisotropic brittle damage model designed primarily for concrete though
it can be applied to a wide variety of brittle materials. Material properties used for simulation
are listed in Table 3. For bricks, properties were provided by the manufacturer. In case of
mortar, mechanical properties were obtained from material tests carried out at the Structure’s
Laboratory of UPM.
   For the second campaign tests, the mortar used had a compressive strength of 7.80 MPa,
and the rest of parameters were calculated based on this parameter.

                               4 RESULTS AND DISCUSSION
Results of the numerical modelling have been compared in terms of wall displacement with
the field data obtained in the corresponding test. For tests T2 and M2, the comparison is made
based on the Displacement Damage Index, as this index provides an idea of the mean plastic
displacement of the whole wall. In addition, the displacement along the mid-height line of
the walls is analysed. T3 test will not be used in the analysis due to the anomalous values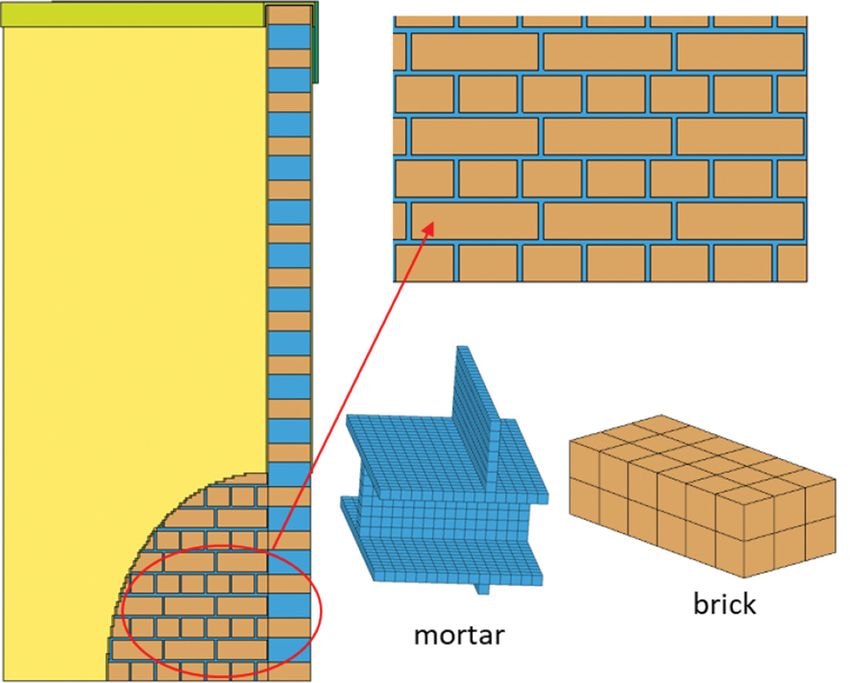
304 M. Chiquito, et al., Int. J. Comp. Meth. and Exp. Meas., Vol. 9, No. 4 (2021)
registered in this trial. For the tests where the unreinforced wall collapsed (i.e., test T4 of the
first campaign and test M1 of the second campaign), the comparison is made based on the
failure pattern and the global response of the walls. The T1 test has not been simulated due
to the problem explained earlier related to the base displacement, as the result would not be
reliable.
The pressure registered in the field tests were used to calculate the TNT equivalent of the
explosive charge. Then, those values of blast loading were used as an input in the numerical
modelling to apply the corresponding pressures on the walls. The pressure values obtained in
the field tests as well as those extracted from the simulation are shown in Table 4. The pres-
sure gauges were placed on the ground at the same distance from the charge than the walls
(i.e., 5 m), recording the side-on pressure. It can be checked that the pressures applied in the
numerical modelling are within the range of those measured in the field tests.
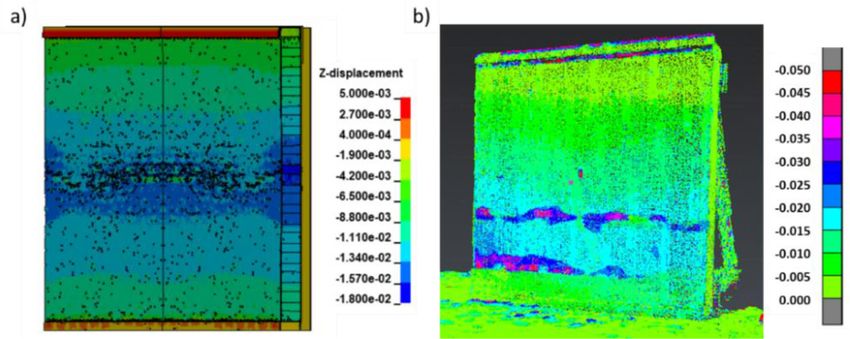
Figure 7 shows the displacements of the unreinforced wall in the test T2 comparing the
images obtained by the numerical modelling and the laser scanner. Numerical modelling
shows the maximum displacements at the central part of the wall, while in the field test, the
largest displacements occur in the lower third of the wall. However, displacements obtained
are similar in both figures, between 15 and 20 mm. The maximum displacements registered
with the laser scanner (colours dark blue and pink on the Fig. 7b) are produced by detached
areas of the mortar layer and, therefore, do not correspond to a real displacement of the wall.
Looking at Table 5 and regarding the Displacement Index, the values offered by the numer-
ical modelling are very close to those taken in the field test. Furthermore, considering the
mean of the displacements along the mid-height line of the walls, values are very similar too.
However, in case of the test M2, differences are larger than those in the case of T2 test but
acceptable as the model results are on the safe side. In this case, the model overestimates the
displacements, both the global and the mid-height line displacements. This fact can also be
observed in Fig. 8, where the model estimates a larger displacement around the central part
of the wall, reaching 20 mm and the laser scanner registers only two areas (lower right corner
and upper left corner) with a displacement larger than 10 mm.
For the test T4, the global response of the wall is compared to the result of the model.
Figure 9 shows a frame extracted from the high-speed camera video of the wall during the
explosion and the comparison with the numerical model. A similar fracture pattern can be
observed in both images, with several horizontal cracks and a vertical crack along the central
part of the wall.
In case of M1 test, the failure happened in a different way as the top profile failed during
the explosion. The same condition has been reproduced in the numerical modelling and the
result obtained is shown in Fig. 10. It can be appreciated how similar is the model behaviour
to the reality, as the upper half of the wall is falling down while the lower half of the wall is
resting against the steel reaction frame.
Table 4: Comparison of field pressures with model pressures.
Charge TNT Pressure field test Pressure LS-DYNA
Test Kg kPa kPa
T2–T3 31.40 477–526 482
T4 84.40 1167 1020
M1–M2 70.71 630–1101 893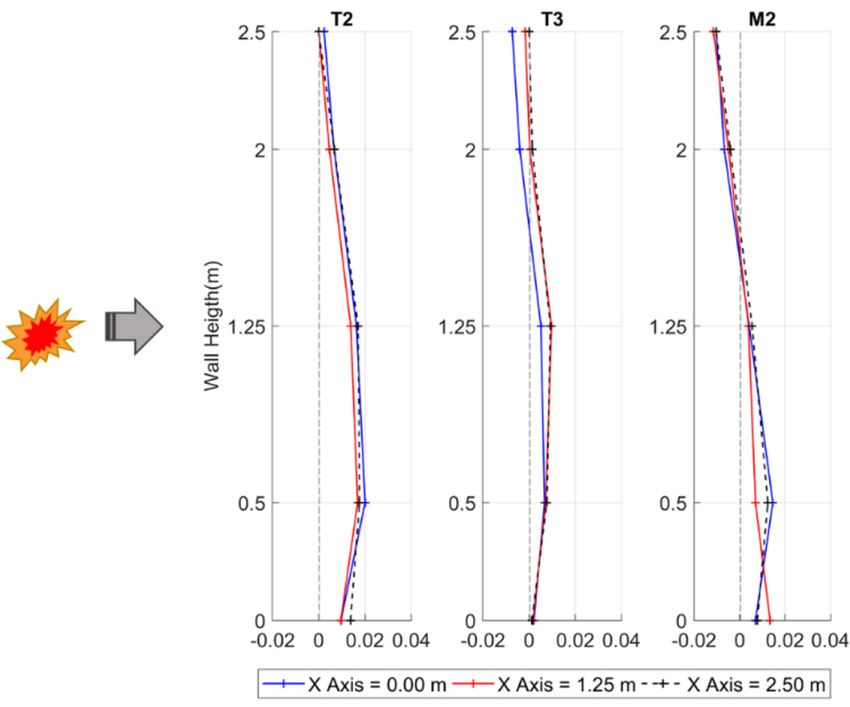
M. Chiquito, et al., Int. J. Comp. Meth. and Exp. Meas., Vol. 9, No. 4 (2021)     305

Figure 7: Permanent displacements obtained in the test T2: (a) contours of z-displacement
           (m) obtained in numerical modelling; (b) displacement (m) measured with the laser
           scanner.

                   Table 5: Values of displacement measured and simulated.

                               Global displacement Mid-height line                 Mid-height line
        Z            Id        LS-DYNA             Mean                            LS-DYNA
 Test   (m/kg1/3) (mm) (mm)                               (mm)                     (mm)
 T2     1.58         10.15     10.05                      14.09                    15.51
 M2     1.21         6.18      12.20                      7.54                     20.80

Figure 8: Permanent displacements obtained in the test M2: (a) contours of z-displacement
           (m) obtained in numerical modelling; (b) displacement (m) measured with the laser
           scanner.

   Considering the four tests simulated, it can be said that the results analysed are acceptable
when compared with the corresponding field test data. This simulation supports the idea that
the model is reliable as the response in all cases is satisfactory in terms of displacement and
global response of the walls. Furthermore, the model has been proved consistent, as the sim-
ulation has been made with different explosive charges, surface finish and even with different
mechanical properties of the materials as in case of the mortar for M1 and M2 tests.
306 M. Chiquito, et al., Int. J. Comp. Meth. and Exp. Meas., Vol. 9, No. 4 (2021)
Figure 9: (a) Numerical model of T4 test; (b) high-speed camera frame.
Figure10: (a) Numerical model of M1 test; (b) image of the unreinforced wall taken after the
test.
5 CONCLUSIONS
This study shows the development of a numerical model using a micro-modelling approach
of an unreinforced wall subjected to blast loading. This model is compared with the data
measured in six different field tests carried out at full scale with different explosives charges.
After analysing the results, it might be concluded that the model is consistent and reliable
as the comparisons are good in the different scenarios tested. Displacements obtained from
the models are in good agreement with those measured in the field tests. Furthermore, the
global response and failure pattern analysed for the collapsed walls are also similar to those
observed in the trials.
Regarding the randomness of the explosive phenomenon, the complexity of the problem
and given the brittle behaviour and the composite nature of the materials, this paper shows
that it is possible to build a numerical model, which provides a good approximation to the
observed behaviour of the structure and which could be used to explore situations for which
no testing has been performed.M. Chiquito, et al., Int. J. Comp. Meth. and Exp. Meas., Vol. 9, No. 4 (2021) 307
ACKNOWLEDGEMENTS
This research has been conducted under the PICAEX project funded by the Centre for Indus-
trial Technological Development (CDTI), an agency of the Spanish Government. We would
like to thank all the people from TAPUSA, MAPEI and FHECOR who contributed to the
design and execution of the tests. We also thank the staff in La Marañosa (ITM−INTA) for
their help at the testing site.
REFERENCES
[1] Draganić, H., Gazić, G., & Varevac, D., Experimental investigation of design and retro-
fit methods for blast load mitigation–A state-of-the-art review. Engineering Structures,
190, pp. 189–209, 2019. https://doi.org/10.1016/j.engstruct.2019.03.088
[2] Goswami, A., & Adhikary, S.D., Retrofitting materials for enhanced blast performance
of structures: Recent advancement and challenges ahead. Construction and Building
Materials, 204, pp. 224–243, 2019. https://doi.org/10.1016/j.conbuildmat.2019.01.188
[3] Badshah, E., Naseer, A., Ashraf, M., Shah, F., & Akhtar, K., Review of blast loading
models, masonry response, and mitigation. Shock and Vibration, 2017.
[4] D’Altri, A.M., Sarhosis, V., Milani, G., Rots, J., Cattari, S., Lagomarsino, S., ... de
Miranda, S., Modeling strategies for the computational analysis of unreinforced
masonry structures: Review and classification. Archives of Computational Methods in
Engineering, pp. 1–33, 2019.
[5] Lantz, L., Maynez, J., Cook, W., & Wilson, C.M.D., Blast protection of unreinforced
masonry walls: A state-of-the-art review. Advances in Civil Engineering, 2016,
8958429, 2016. https://doi.org/10.1155/2016/8958429
[6] Wei, X., & Stewart, M.G., Model validation and parametric study on the blast response
of unreinforced brick masonry walls. International Journal of Impact Engineering,
37(11), pp. 1150–1159, 2010. https://doi.org/10.1016/j.ijimpeng.2010.04.003
[7] Kernicky, T.P., Whelan, M.J., Weggel, D.C., & Rice, C.D., Structural identification
and damage characterization of a masonry infill wall in a full-scale building subjected
to internal blast load. Journal of Structural Engineering, 141(1), D4014013, 2015.
https://doi.org/10.1061/(asce)st.1943-541x.0001158
[8] Campidelli, M., Tait, M.J., El-Dakhakhni, W.W., & Mekky, W., Numerical strategies for
damage assessment of reinforced concrete block walls subjected to blast risk. Engineer-
ing Structures, 127, pp. 559–582, 2016. https://doi.org/10.1016/j.engstruct.2016.08.032
[9] Wang, M., Hao, H., Ding, Y., & Li, Z.X., Prediction of fragment size and ejection
distance of masonry wall under blast load using homogenized masonry material
properties. International Journal of Impact Engineering, 36(6), pp. 808–820, 2009.
https://doi.org/10.1016/j.ijimpeng.2008.11.012
[10] Su, Y., Wu, C., & Griffth, M.C., Modelling of the bond–slip behavior in FRP rein-
forced masonry. Construction and Building Materials, 25(1), pp. 328–334, 2011.
https://doi.org/10.1016/j.conbuildmat.2010.06.021
[11] Abdulla, K.F., Cunningham, L.S., & Gillie, M., Simulating masonry wall behaviour
using a simplified micro-model approach. Engineering Structures, 151, pp. 349–365,
2017. https://doi.org/10.1016/j.engstruct.2017.08.021
[12] Burnett, S., Gilbert, M., Molyneaux, T., Beattie, G., & Hobbs, B., The performance
of unreinforced masonry walls subjected to low-velocity impacts: Finite element
analysis. International Journal of Impact Engineering, 34(8), pp. 1433–1450, 2007.
https://doi.org/10.1016/j.ijimpeng.2006.08.004308 M. Chiquito, et al., Int. J. Comp. Meth. and Exp. Meas., Vol. 9, No. 4 (2021)
[13] Chiquito, M., López, L.M., Castedo, R., Pérez-Caldentey, A., & Santos, A.P., Behaviour
of retrofitted masonry walls subjected to blast loading: Damage assessment. Engineer-
ing Structures, 201, p. 109805, 2019. https://doi.org/10.1016/j.engstruct.2019.109805
[14] Chiquito, M., Castedo, R., Santos, A.P., López, L.M., & Pérez-Caldentey, A., Numerical
modelling and experimental validation of the behaviour of brick masonry walls subjected
to blast loading. International Journal of Impact Engineering, 148, p. 103760, 2021.
https://doi.org/10.1016/j.ijimpeng.2020.103760
[15] Livermore Software Technology Corporation (LSTC). LS-DYNA Keyword User’s
Manual - R11 2018:3186.
[16] Kingery, C.N. & Bulmash, G., Airblast Parameters from TNT Spherical Air Burst and
Hemispherical Surface Burst. US Army Armament and Development Center, Ballistic
Research Laboratory, 1984.You can also read