Northern brown bandicoot (Isoodon macrourus) and common brushtail possum (Trichosurus vulpecula) density on the Tiwi Islands: insights and ...
←
→
Page content transcription
If your browser does not render page correctly, please read the page content below
CSIRO PUBLISHING

Pacific Conservation Biology
https://doi.org/10.1071/PC21020

     Northern brown bandicoot (Isoodon macrourus) and
     common brushtail possum (Trichosurus vulpecula)
     density on the Tiwi Islands: insights and implications

                              A,D
     Hugh F. Davies               , Tiwi Land Rangers B, Emily Nicholson C and
     Brett P. Murphy A
     A
       NESP Threatened Species Recovery Hub, Research Institute for the Environment and Livelihoods,
       Charles Darwin University, Casuarina, NT 0810, Australia.
     B
       Tiwi Land Rangers, Winnellie, NT 0810, Australia.
     C
       Deakin University, Centre for Integrative Ecology, School of Life and Environmental Sciences,
       Burwood, Vic. 3125, Australia.
     D
       Corresponding author. Email: hugh.davies@cdu.edu.au

     Abstract. Despite the ongoing collapse of native mammal populations across northern Australia, the paucity of robust
     estimates of population density limits our capacity to identify and understand population change. Here we aimed to provide
     the first estimates of native mammal density on the Tiwi Islands – one of Australia’s largest remaining refuge areas for
     native mammals. We conducted intensive live-trapping at four sites that represent varying combinations of fire frequency,
     feral cat density and feral herbivore presence. We used spatially-explicit capture-recapture models to investigate the
     density of common brushtail possum (Trichosurus vulpecula) and northern brown bandicoot (Isoodon macrourus).
     Compared with mainland northern Australia, populations of common brushtail possum and northern brown bandicoot
     have remained relatively healthy on the Tiwi Islands. Common brushtail possum density was significantly higher on
     Bathurst Island (1.06 possum ha1) compared with Melville Island (0.32 possum ha1), whereas northern brown bandicoot
     density varied across all four sites (ranging from 0.04 to 0.34 bandicoot ha1). Unexpectedly, the very frequently burnt
     Ranku site (Bathurst Island) continues to support healthy populations of both species. These density estimates provide
     critical information for identifying and understanding future population change for two species that have suffered marked
     declines across the Australian monsoon tropics. Although the lack of replication limits our ability to draw conclusions
     regarding the ecological constraints of these mammal populations, our density observations align with a recent conceptual
     model postulating that the persistence of native mammal populations across northern Australian savannas reflects a
     complex, but spatially-variable interplay of ‘bottom-up’ and ‘top-down’ processes.

     Keywords: Bathurst Island, capture-recapture, common brushtail possum, decline, habitat refuge, mammal extinction,
     Melville Island, monsoon tropics, native mammals, northern Australia, northern brown bandicoot, savannas, Tiwi Islands.

     Received 29 March 2021, accepted 10 June 2021, published online 6 July 2021

Introduction                                                        The drivers of the current decline of native mammals across
Australia has experienced an extraordinarily high rate of mammal    northern Australia have proven difficult to identify. However, a
extinction in recent centuries. Ten percent of Australia’s native   conceptual model has emerged over the past decade, postulating
terrestrial mammal species have become extinct since European       that frequent fire and heavy grazing by feral herbivores have
colonisation in 1788 (Woinarski et al. 2015), and many more have    degraded habitat, disrupting both ‘bottom-up’ (e.g. resource
disappeared from most of their former ranges. The most dramatic     availability) and ‘top-down’ (e.g. predation) processes, resulting
declines occurred in arid central Australia prior to the mid-20th   in the widespread decline of native mammal populations (Stobo-
century. Until recent decades it was assumed that the vast,         Wilson et al. 2020a).
uncleared savannas of monsoonal northern Australia would                Robust estimates of population density increase our ability to
retain a healthy assemblage of native mammals. However,             understand population change and our capacity to mitigate popu-
research conducted since the 1990s has demonstrated that            lation decline (Efford 2004), such as those currently occurring
northern Australia’s native mammals are experiencing a rapid        across northern Australia. Recently, advances in statistical model-
and severe decline (Woinarski et al. 2011), which, if continue      ling have improved our ability to accurately estimate population
unabated, will lead to more extinctions (Geyle et al. 2018).        density. For example, spatially-explicit capture-recapture models

Journal compilation  CSIRO 2021 Open Access CC BY-NC-ND                                             www.publish.csiro.au/journals/pcb
B Pacific Conservation Biology H. F. Davies et al.
take into account both the distribution and movement of indi- respectively. They are the two largest of the group of islands
viduals in relation to detectors (e.g. traps or motion-activated collectively known as the Tiwi Islands, located 20 km off the north
cameras) to provide estimates of density that are unbiased by coast of Australia’s Northern Territory (Fig. 1). The main vege-
edge-effects and imperfect detection (Efford 2004). Despite their tation type of the Tiwi Islands is lowland savanna dominated by
utility, spatially-explicit estimates of population density are Eucalyptus miniata, Eucalyptus tetrodonta and Corymbia neso-
rare for northern Australian mammals. This likely reflects, in part, phila with a predominantly grassy understorey. The islands
the diminished ability to obtain sufficient data required for experience a tropical monsoonal climate with a humid wet season
these analytical methods due to the catastrophic declines (November–March) in which over 90% of the annual rainfall
suffered by native mammals across northern Australian savannas occurs, followed by a dry season (April–October). Fire frequency
that occurred prior to the development of these methods. How- is very high but there is significant variation across the islands
ever, it appears that such data can still be obtained from areas (Fig. 1). Feral cats (Felis catus) are present on both islands, but
of northern Australia, such as Groote Eylandt (Heiniger et al. recent work suggests that the density of feral cats is lower on
2018, 2020), the Tiwi Islands and Cobourg Peninsula (Stobo- Bathurst Island than Melville Island (Davies et al. 2021). Feral
Wilson et al. 2020a). herbivores (Asian water buffalo Bubalus bubalis and horse Equus
The Tiwi Islands, in the Australian monsoon tropics, are one caballus) are only present on Melville Island. Feral pigs (Sus
of the last remaining areas in Australia to support an intact native scrofa) are widespread on Bathurst Island, but localised to the
mammal assemblage (Murphy and Davies 2014; Davies et al. western half of Melville Island. Cane toads (Rhinella marina) are
2018). However, due to the presence of threatening processes absent from both islands. Dingoes (Canis dingo) are widespread
that have been implicated in the decline of native mammals across both islands.
across northern Australia including feral herbivores and feral
cats (Davies et al. 2017, 2020), and worrying signs of initial Data collection
decline (Davies et al. 2018), native mammal populations on We conducted intensive live-trapping at four sites across the
these islands may be at risk. Here, we aimed to provide Tiwi Islands: two on Bathurst Island (Cape Fourcroy and Ranku)
(1) estimates of native mammal density on the Tiwi Islands; and two on Melville Island (Pickertaramoor and Cache Point)
and (2) insight into the ecological constraints of native mammal (Fig. 1). At each site, we deployed a trapping grid consisting of
density in tropical savannas. 300 live-traps (30 rows of 10) spaced 20 m apart, covering an
area of ,0.1 km2. Each grid was live-trapped for four conse-
Materials and methods
cutive nights at two separate times (June and September) in the
Study site dry season of 2019, a total of 9600 live-trap nights. On each grid,
Our study was conducted on Melville (5786 km2) and Bathurst we used 75 cage traps (66 23 26 cm) and 225 box-type
Island (2600 km2), Australia’s second and fifth largest islands, ‘Sherman’ traps (30 10 8 cm) baited with a standard
Trapping site
Melville Island Fire frequency:
Bathurst
0
Island 1
D
2
3
4
5
6
7
8
B 9
10
11
12
A
N 13
C
14
15
0 10 20 30 40 km 16
17
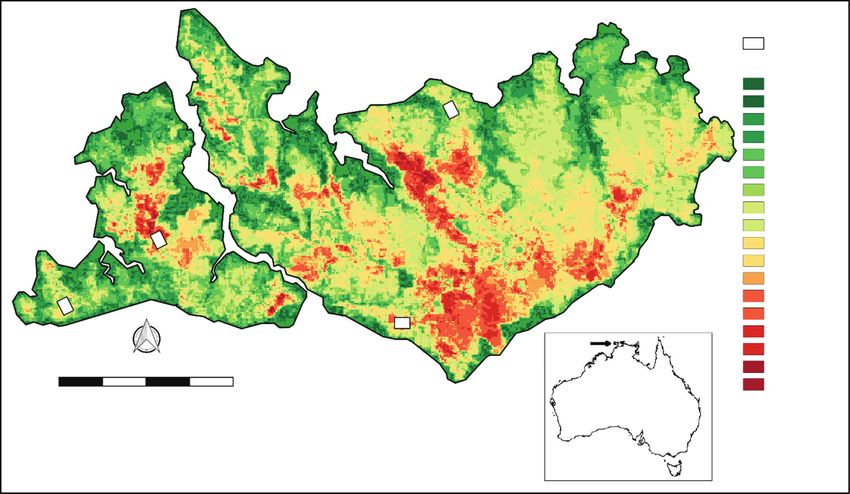
Fig. 1. Location of our four live-trapping sites on the Tiwi Islands (A – Cape Fourcroy; B – Ranku; C – Pickertaramoor; D – Cache
Point). The background map indicates MODIS satellite-derived fire frequency (number of times burnt in the 17-year period 2000–2016,
inclusive). The location of the Tiwi Islands relative to mainland Australia is also shown (inset).Bandicoot and possum density on the Tiwi Islands Pacific Conservation Biology C
Table 1. Summary of the sites and species capture counts
The number of individual animals is shown in the parentheses. Dashes indicate where grids were located outside the range of a particular species
Cape Fourcroy Ranku Pickertaramoor Cache Point Total captures
(individuals)
Island Bathurst Bathurst Melville Melville
Fire frequency Low High High Low
Feral herbivores present? No No Yes Yes
Feral cat density Low Low 0.15 cats km2 0.15 cats km2
Feral pigs present? Yes Yes No No
Common brushtail possum (Trichosurus vulpecula) 81 (30) 77 (29) 28 (12) 16 (6) 202 (77)
Northern brown bandicoot (Isoodon macrourus) 19 (7) 50 (18) 3 (2) 39 (17) 111 (44)
Delicate mouse (Pseudomys delicatulus) 0 (0) 14 (5) 1 (1) 10 (8) 25 (14)
Black-footed tree-rat (Mesembriomys gouldii) – – 8 (5) 8 (7) 16 (12)
Pale field-rat (Rattus tunneyi) 4 (1) 3 (2) 0 (0) 0 (0) 7 (3)
Butler’s dunnart (Sminthopsis butleri) 1 (1) 0 (0) 0 (0) 1 (1) 2 (2)
Grassland melomys (Melomys burtoni) 0 (0) 0 (0) 0 (0) 1 (1) 1 (1)
Northern brush-tailed phascogale (Phascogale pirata) 0 (0) 0 (0) 0 (0) 1 (1) 1 (1)
Total captures (individuals) 105 (39) 144 (54) 40 (20) 76 (41) 365 (154)
mammal bait of oats, peanut butter and honey. Each captured detectability, we included a categorical variable (Survey) as a
animal was individually marked with a numbered ear tag (Style predictor of the two detection parameters: g0 (the probability of
1005-1; National Band and Tag Company, Newport, KY, USA) detecting an animal (per occasion) if a trap was to be placed at its
and a microchip (ID-100VB/1.4; Trovan Ltd, Cologne, home-range centre) and s (the reduction in detection probability
Germany) implanted between the scapulae. with distance from a home-range centre). Model selection based
As we aimed to explore the environmental correlates of on Akaike’s information criterion adjusted for small sample size
native mammal density across the Tiwi Islands, the locations (AICc) was used to identify the best fit model (Burnham and
of the four sites were chosen to represent varying combinations Anderson 2002), from which estimates of native mammal
of fire frequency, feral cat density and feral herbivore presence density were obtained (Table 2).
(Table 1). The Pickertaramoor and Ranku sites were charac-
terised by very high fire frequency, with the MODIS satellite- Results
derived fire frequency recorded at each individual trap location,
averaging 13.7 and 14.3 across each grid, respectively. From 9600 live-trap nights, we recorded a total of 365 captures
The Cache Point and Cape Fourcroy sites were placed in areas of 154 individual native mammals, from eight species
with lower fire frequency, with the MODIS satellite-derived fire (Table 1). Common brushtail possum and northern brown
frequency recorded at each individual trap location, averaging bandicoot were by far the most commonly trapped species,
6.4 and 8.1 across each grid, respectively. Feral cat density was with 202 captures of 77 individual possums and 111 captures
highest at Pickertaramoor and Cache Point, and exceptionally of 44 individual bandicoots (Table 1). However, there was
low at both the Ranku and Cape Fourcroy sites. Feral herbivores considerable variation in the number of captures of each of
were present at both Pickertaramoor and Cache Point, and these species between the four sites. For example, we recorded
absent from Bathurst Island. 81 captures of 30 individual possums at Cape Fourcroy but
only 16 captures of 6 individuals at Cache Point. Similarly,
captures of northern brown bandicoot varied from 50 at Ranku
Data analysis
to just 3 at Pickertaramoor.
To investigate the variation in native mammal density across the Capture rates were sufficient to investigate population
four sites, we fitted spatially-explicit capture–recapture models density using spatially-explicit capture-recapture analyses for
using the ‘secr’ package (Efford 2020) in the statistical program R both the common brushtail possum and northern brown bandi-
(R Development Core Team 2013). We collapsed the total coot. Variation in common brushtail possum density was best
number of trap nights conducted at each location (eight) into 24-h explained by island (Table 1), with the estimated possum
sampling occasions. We used a 500-m buffer around the outer- density on Bathurst Island (1.06 ha1) significantly higher than
most coordinates of the live-trapping grids to ensure that density on Melville Island (0.32 ha1) (Fig. 2). Variation in northern
was estimated over a large enough area to include all small native brown bandicoot density was best explained by site (Table 1),
mammals exposed to our survey (Royle et al. 2013). ranging from 0.04 ha1 at Pickertaramoor to 0.34 ha1 at
To investigate the variation of native mammal density across Ranku (Fig. 3).
our four sites, we ran four multi-session models for each species:
constant density across all sites (Density , 1), density predicted
by site (Density , Site), density predicted by island (Density , Discussion
Island) and density predicted by fire frequency (Density , Fire We have provided the first robust population density estimates for
frequency). To account for seasonal variation in native mammal common brushtail possum and northern brown bandicoot onD Pacific Conservation Biology H. F. Davies et al.
Table 2. Summary of the models investigating the density of common brushtail possum and northern brown bandicoot on the
Tiwi Islands
k, number of parameters; AICc, Akaike’s information criterion adjusted for small sample size; DAICc, difference between the AICc of
this model and the model with the smallest AICc; wi, Akaike weight. Survey ¼ categorical variable to account for potential seasonal
differences in the two detection parameters (g0 and s)
Model k DAICc wi
Common brushtail possum (Trichosurus vulpecula)
Density , Island, g0 , Survey, s , Survey 6 0.0 0.85
Density , Site, g0 , Survey, s , Survey 8 3.4 0.15
Density , 1, g0 , Survey, s , Survey 5 19.5 0.00
Density , Fire frequency, g0 , Survey, s , Survey 6 21.8 0.00
Northern brown bandicoot (Isoodon macrourus)
Density , Site, g0 , Survey, s , Survey 8 0.0 0.99
Density , 1, g0 , Survey, s , Survey 5 8.8 0.01
Density , Island, g0 , Survey, s , Survey 6 10.7 0.00
Density , Fire frequency, g0 , Survey, s , Survey 6 11.2 0.00
1.6
1.4
1.2
Density (ha–1)
1
0.8
0.6
0.4
0.2
0
Bathurst Island Melville Island
Fig. 2. Mean density of common brushtail possum on Melville and Bathurst Island. Error bars indicate 95% confidence intervals.
0.8
0.7
0.6
0.5
Density (ha–1)
0.4
0.3
0.2
0.1
0
Cape Fourcroy Ranku Pickertaramoor Cache Point
Bathurst Island Melville Island
Fig. 3. Mean density of northern brown bandicoot at each of the four sites across the Tiwi Islands.
Error bars indicate 95% confidence intervals.Bandicoot and possum density on the Tiwi Islands Pacific Conservation Biology E
the Tiwi Islands, one of the last remaining areas in Australia to Given the paucity of robust and consistent estimates of
retain a complete assemblage of native mammals (Burbidge et al. population density, indices of relative abundance (i.e. trap-
2009). Our density estimates support the view that populations of success) have more commonly been used to identify, and
these species on the Tiwi Islands have remained relatively healthy investigate the decline of native mammal species across north-
compared with adjacent parts of the mainland. Albeit from only ern Australian savannas (Woinarski et al. 2001, 2010). How-
four locations, we have provided critical information for identi- ever, the validity of using indices of relative abundance as an
fying and understanding future population change for two species accurate measure of population size has been questioned (Slade
that have suffered marked declines across the Australian mon- and Blair 2000), especially when imperfect detection is ignored
soon tropics. Although the lack of replication limits our ability to (MacKenzie and Kendall 2002). Unfortunately, as the data
draw conclusions regarding the ecological constraints of these required for spatially-explicit estimates of population density
mammal populations, our observations provide valuable insight, can be demanding to collect, there is often a trade-off with how
and align with a recent conceptual model postulating that the many replicate sites can be surveyed. Our density estimates
persistence of native mammal populations across northern Aus- provide critical information for identifying and understanding
tralian savannas reflects a complex, but spatially-variable inter- future population change for two species that have suffered
play of ‘bottom-up’ (e.g. resource availability) and ‘top-down’ marked decline across the Australian monsoon tropics. Our
(e.g. predation) processes. density estimates also represent the robust information on
Unfortunately, there are very few recent density estimates population size that can ensure the accurate listing of species
for the common brushtail possum or northern brown bandi- on the IUCN’s Red List of Threatened Species (IUCN 1996).
coot that are directly comparable to our results. Kerle (1998) Patterns of native mammal persistence/decline across north-
analysed survey data collected between 1979 and 1981 in an ern Australian savannas reflect a complex interplay of ‘bottom-
area of lowland woodland in Kakadu National Park and up’ and ‘top-down’ processes (Stobo-Wilson et al. 2020a).
estimated the population density of common brushtail possum As such, the variation in the density of common brushtail
to be 3.1 ha1, roughly three times higher than our estimate possum and northern brown bandicoot demonstrated here
of possum density on Bathurst Island (1.06 ha1). A decade likely reflects multiple contributing factors. The high density of
later, using data collected as part of a large-scale fire possums on Bathurst Island might reflect the greater availability
experiment between 1990 and 1994 (Andersen et al. 1998), of den sites (i.e. tree hollows) often associated with the dense, and
Griffiths (2013) estimated the density of possums and bandi- well-developed eucalypt forests that occur on Bathurst Island
coots across the Kapalga area of Kakadu National Park to be (compared with Melville Island) (Woolley et al. 2018). The
0.78 and 0.79 ha1, respectively. Pope (2001) estimated absence of the black-footed tree-rat (Mesembriomys gouldii)
northern brown bandicoot density to range from 0.073 to from Bathurst Island may also help explain the higher density
0.103 ha1 in an area of dry eucalypt forest in the wet tropics of possums, due to less intraspecific competition for den sites
of northern Queensland. The most directly comparable esti- compared with Melville Island (Pittman 2003; Firth et al. 2006).
mate of northern brown bandicoot population density comes The higher density of possums on Bathurst Island may also reflect
from another island refuge off the northern Australian coast – a higher availability of important food and shelter resources due
Groote Eylandt (Heiniger et al. 2018). Using spatially-explicit to the absence of Asian water buffalo (Bubalus bubalis) and horse
capture-recapture models, Heiniger et al. (2018) estimated (Equus caballus), both of which are present on Melville Island
northern brown bandicoot population density to be 0.19 ha1 (Stobo-Wilson et al. 2020a). The predation pressure on native
(95% CI 0.13–0.36). mammal populations on Bathurst Island is also likely to be lower
As common brushtail possum density on Bathurst Island than on Melville Island due to the low density of feral cats
(1.06 ha1) remains higher than that recorded prior to wide- (Davies et al. 2021).
spread mammal decline in Kakadu (0.78 ha1) (Griffiths 2013), Despite the very high frequency of fire at the Ranku site,
our results concur with Firth et al. (2006), who concluded that populations of common brushtail possum and northern brown
possum populations on Bathurst Island have remained healthy bandicoot in this area remain healthy. This was an unexpected
compared with areas of mainland northern Australia. Although result because frequent fire is often thought to make environ-
possum density on Melville Island (0.32 ha1) is significantly mental conditions unfavourable for these species, due to the
lower than on Bathurst Island, a recent island-wide survey of removal of critical food and shelter resources (Kerle 1998;
historical sites on Melville Island demonstrated that possums are Pardon et al. 2003; Griffiths and Brook 2015) and heightened
widespread, and found no significant decrease in possum trap- exposure to predation (Stobo-Wilson et al. 2020b). It may be
success since 2000, suggesting possum populations on Melville that in this area the negative impacts associated with very
Island also remain healthy compared with areas on the mainland frequent fire are outweighed by the benefits associated with
(Davies et al. 2018). Davies et al. (2018) found that while high productivity, the absence of feral herbivores and possibly
northern brown bandicoot trap-success on Melville Island lower predation pressure, thereby allowing populations to
decreased by 90% between 2000 and 2015, this species also remain healthy. The Pickertaramoor site provides an interesting
remains widespread. Here, we have demonstrated that in some comparison to Ranku. Despite being similarly frequently burnt
areas of the Tiwi Islands, northern brown bandicoot populations to the Ranku site, we recorded by far the lowest overall number
remain in relatively high densities, such as at Ranku (0.34 ha1) of native mammal captures and individuals, and estimated a
and Cache Point (0.32 ha1). However, only two individual very low density of northern brown bandicoot (0.04 ha1) at
bandicoots were recorded at the Pickertaramoor grid, with Pickertaramoor. Among our four sites, Pickertaramoor is char-
density estimated at a low 0.04 ha1. acterised as the most degraded, with the highest activity ofF Pacific Conservation Biology H. F. Davies et al.
predators (feral cats and dingoes) and feral herbivores (Davies from the Australian Government’s National Environmental Science Pro-
et al. 2021). In this area (contrary to the situation at Ranku), the gram via the Threatened Species Recovery Hub, the Australian Research
negative impacts of very frequent fire are likely exacerbated by Council (LP170100305) and the Indigenous Land and Sea Corporation. Data
habitat degradation by feral herbivores and higher predation were collected with ethics approval from Charles Darwin University
pressure, reducing the capacity of native mammal populations to (A19006) and a permit from the Northern Territory Government (permit no.
64 876). We thank Murray Efford for his helpful advice regarding the
persist.
analyses, Graeme Gillespie for his input on field methods and study design,
Our results suggest that in productive northern Australian as well as the amazing field assistance of expert mammalogists Brien
savannas, frequent fire may not necessarily drive species decline Roberts, Jaime Heiniger and Cara Penton.
when other threats are either absent or relatively mild. However, it
is important to note that we have only investigated fire frequency, References
not intensity. As northern brown bandicoot have been shown to
Andersen, A. N., Braithwaite, R. W., Cook, G. D., Corbett, L. K., Williams,
prefer sites that have experienced fine-scale low intensity fires R. J., Douglas, M. M., Gill, A. M., Setterfield, S. A., and Muller, W. J.
(compared with both unburnt and extensively burnt sites) (Pardon (1998). Fire research for conservation management in tropical savannas:
et al. 2003; Firth et al. 2006), the variation in bandicoot density introducing the Kapalga fire experiment. Australian Journal of Ecology
across our sites could reflect variation in fire intensity. Given that 23, 95–110. doi:10.1111/J.1442-9993.1998.TB00708.X
large, high-intensity fires are likely to be particularly detrimental Burbidge, A. A., McKenzie, N. L., Brennan, K. E. C., Woinarski, J. C. Z.,
to small mammals (Firth et al. 2010; Lawes et al. 2015), Dickman, C. R., Baynes, A., Gordon, G., Menkhorst, P. W., and
we suggest that future research uses metrics that go beyond Robinson, A. C. (2009). Conservation status and biogeography of
fire frequency and better gauge actual fire impact. Australia’s terrestrial mammals. Australian Journal of Zoology 56,
Another important caveat of our study is that it was con- 411–422. doi:10.1071/ZO08027
Burnham, K. P. and Anderson, D. R. (2002). ‘Model selection and multi-
ducted at only four locations. Hence, our capacity for robust
model inference: a practical information-theoretic approach,’ (Springer-
inference of the ecological constraints on native mammal Verlag: New York.)
density is limited. Increasing the spatiotemporal replication of Davies, H. F., McCarthy, M. A., Firth, R. S. C., Woinarski, J., Gillespie,
robust estimates of population density (for a greater number of G. R., Andersen, A. N., Geyle, H., Nicholson, E., and Murphy, B. P.
species), will lead to a better understanding of population (2017). Top-down control of species distributions: feral cats driving the
trajectories under varying combinations of threatening pro- regional extinction of a threatened rodent in northern Australia. Diversity
cesses, as well as a better capacity to gauge the effectiveness and Distributions 23, 272–283. doi:10.1111/DDI.12522
of management interventions. However, our results clearly align Davies, H. F., McCarthy, M. A., Firth, R. S. C., Woinarski, J. C. Z., Gillespie,
with a recent conceptual model postulating that the state of G. R., Andersen, A. N., Rioli, W., Puruntatameri, J., Roberts, W.,
native mammal populations across northern Australian savannas Kerinaiua, C., Kerinauia, V., Womatakimi, K., and Murphy, B. P.
(2018). Declining populations in one of the last refuges for threatened
reflects a complex, and spatially-variable interplay of ‘bottom-
mammal species in northern Australia. Austral Ecology 43, 602–612.
up’ (e.g. resource availability) and ‘top-down’ processes (e.g. doi:10.1111/AEC.12596
predation) (Stobo-Wilson et al. 2020a). This has important Davies, H. F., Maier, S. W., and Murphy, B. P. (2020). Feral cats are
management implications. For example, as possum and bandi- more abundant under severe disturbance regimes in an Australian
coot populations remain healthy at the frequently burnt Ranku tropical savanna. Wildlife Research 47, 624–632. doi:10.1071/WR19198
site, targeted fire management aimed at reducing fire frequency Davies, H. F., Rangers, Tiwi Land, Rees, M. W., Stokeld, D., Miller, A. C.,
in this area may be unnecessary and not offer the same benefits Gillespie, G. R., and Murphy, B. P. (2021). Variation in feral cat density
to these species as if it were applied in other areas, such as between two large adjacent islands in Australia’s monsoon tropics.
Pickertaramoor. In other words, the benefits of targeted man- Pacific Conservation Biology. doi:10.1071/PC20088
agement actions can vary across the landscape depending on Efford, M. (2004). Density estimation in live-trapping studies. Oikos 106,
598–610. doi:10.1111/J.0030-1299.2004.13043.X
how the occurrence and severity of disturbance processes are
Efford, M. (2020). secr: Spatially explicit capture-recapture models.
mitigated by landscape productivity. Given limited operational R package version 4.2.2. Available at: https://CRAN.R-project.org/
budgets for management agencies, a more spatially-tailored package¼secr
approach to management, based on a greater understanding of Firth, R. S. C., Woinarski, J. C. Z., Brennan, K. G., and Hempel, C. (2006).
how the occurrence and severity of disturbance processes are Environmental relationships of the brush-tailed rabbit-rat, Conilurus
mitigated by landscape productivity, may be more effective. penicillatus, and other small mammals on the Tiwi Islands, northern
Australia. Journal of Biogeography 33, 1820–1837. doi:10.1111/J.1365-
Data availability 2699.2006.01543.X
Firth, R. S. C., Brook, B. W., Woinarski, J. C. Z., and Fordham, D. A. (2010).
The data used in this publication are owned by the Tiwi Land Decline and likely extinction of a northern Australian native rodent, the
Council. Access to this data can be negotiated with the Tiwi brush-tailed rabbit-rat Conilurus penicillatus. Biological Conservation
Land Council. 143, 1193–1201. doi:10.1016/J.BIOCON.2010.02.027
Geyle, H. M., Woinarski, J. C., Baker, G. B., Dickman, C. R., Dutson, G.,
Conflicts of interest Fisher, D. O., Ford, H., Holdsworth, M., Jones, M. E., and Kutt, A.
(2018). Quantifying extinction risk and forecasting the number of
The authors declare no conflicts of interest.
impending Australian bird and mammal extinctions. Pacific Conserva-
tion Biology 24, 157–167. doi:10.1071/PC18006
Acknowledgements Griffiths, A. (2013). Beds are burning: small mammal responses to fire
We thank the traditional owners of the Tiwi Islands for their ongoing support in tropical savannas of northern Australia. School of Environment,
of scientific research on their land. This study was supported by funding Charles Darwin University, Darwin, Northern Territory, Australia.Bandicoot and possum density on the Tiwi Islands Pacific Conservation Biology G
Griffiths, A. D., and Brook, B. W. (2015). Fire impacts recruitment more Slade, N. A., and Blair, S. M. (2000). An empirical test of using counts of
than survival of small-mammals in a tropical savanna. Ecosphere 6, individuals captured as indices of population size. Journal of Mammalogy
1–22. doi:10.1890/ES14-00519.1 81, 1035–1045. doi:10.1644/1545-1542(2000)081,1035:AETOUC.2.0.
Heiniger, J., Cameron, S. F., and Gillespie, G. (2018). Evaluation of risks for CO;2
two native mammal species from feral cat baiting in monsoonal tropical Stobo-Wilson, A., Stokeld, D., Einoder, L., Davies, H., Fisher, A., Hill, B.,
northern Australia. Wildlife Research 45, 518–527. doi:10.1071/ Murphy, B., Scroggie, M., Stevens, A., Woinarski, J., Rangers, Djelk,
WR17171 Rangers, Warddeken, and Gillespie, G. (2020a). Bottom-up and top-
Heiniger, J., Davies, H. F., and Gillespie, G. R. (2020). Status of mammals down processes influence contemporary patterns of mammal species
on Groote Eylandt: safe haven or slow burn? Austral Ecology 45, 759– richness in Australia’s monsoonal tropics. Biological Conservation 247,
772. doi:10.1111/AEC.12892 108638. doi:10.1016/J.BIOCON.2020.108638
IUCN (1996). ‘1996 IUCN Red List of Threatened Animals.’ (IUCN: Gland, Stobo-Wilson, A. M., Stokeld, D., Einoder, L. D., Davies, H. F., Fisher, A.,
Switzerland.) Hill, B. M., Mahney, T., Murphy, B. P., Stevens, A., Woinarski, J. C. Z.,
Kerle, J. (1998). The population dynamics of a tropical possum, Trichosurus Rangers, Djelk, Rangers, Warddeken, and Gillespie, G. R. (2020b).
vulpecula arnhemensis Collett. Wildlife Research 25, 171–181. Habitat structural complexity explains patterns of feral cat and dingo
doi:10.1071/WR96113 occurrence in monsoonal Australia. Diversity and Distributions 26, 832–
Lawes, M. J., Murphy, B. P., Fisher, A., Woinarski, J. C., Edwards, A., and 842. doi:10.1111/DDI.13065
Russell-Smith, J. (2015). Small mammals decline with increasing fire Woinarski, J. C. Z., Milne, D. J., and Wanganeen, G. (2001). Changes in
extent in northern Australia: evidence from long-term monitoring in mammal populations in relatively intact landscapes of Kakadu National
Kakadu National Park. International Journal of Wildland Fire 24, 712– Park, Northern Territory, Australia. Austral Ecology 26, 360–370.
722. doi:10.1071/WF14163 doi:10.1046/J.1442-9993.2001.01121.X
MacKenzie, D. I., and Kendall, W. L. (2002). How should detection Woinarski, J. C. Z., Armstrong, M., Brennan, K., Fisher, A., Griffiths, A. D.,
probability be incorporated into estimates of relative abundance? Ecol- Hill, B., Milne, D. J., Palmer, C., Ward, S., Watson, M., Winderlich, S.,
ogy 83, 2387–2393. doi:10.1890/0012-9658(2002)083[2387:HSDPBI] and Young, S. (2010). Monitoring indicates rapid and severe decline of
2.0.CO;2 native small mammals in Kakadu National Park, northern Australia.
Murphy, B. P., and Davies, H. F. (2014). There is a critical weight range for Wildlife Research 37, 116–126. doi:10.1071/WR09125
Australia’s declining tropical mammals. Global Ecology and Biogeo- Woinarski, J. C. Z., Legge, S., Fitzsimons, J. A., Traill, B. J., Burbidge,
graphy 23, 1058–1061. doi:10.1111/GEB.12173 A. A., Fisher, A., Firth, R. S. C., Gordon, I. J., Griffiths, A. D., Johnson,
Pardon, L. G., Brook, B. W., Griffiths, A. D., and Braithwaite, R. W. (2003). C. N., McKenzie, N. L., Palmer, C., Radford, I., Rankmore, B., Ritchie,
Determinants of survival for the northern brown bandicoot under a E. G., Ward, S., and Ziembicki, M. (2011). The disappearing mammal
landscape-scale fire experiment. Journal of Animal Ecology 72, 106– fauna of northern Australia: context, cause, and response. Conservation
115. doi:10.1046/J.1365-2656.2003.00686.X Letters 4, 192–201. doi:10.1111/J.1755-263X.2011.00164.X
Pittman, G. W. (2003). Occurrence and use of tree hollows by mammals in Woinarski, J. C. Z., Burbidge, A. A., and Harrison, P. L. (2015). Ongoing
fragmented and continuous savanna woodlands in northern Australia. unraveling of a continental fauna: decline and extinction of Australian
B.Sc. (Hons.) thesis, Northern Territory University, Darwin, Northern mammals since European settlement. Proceedings of the National
Territory, Australia. Academy of Sciences 112, 4531–4540. doi:10.1073/PNAS.1417301112
Pope, L. C. (2001). Population structure of the northern bettong, Bettongia Woolley, L.-A., Murphy, B. P., Radford, I. J., Westaway, J., and Woinarski,
tropica and the northern brown bandicoot, Isoodon macrourus. PhD thesis, J. C. (2018). Cyclones, fire, and termites: the drivers of tree hollow
School of Biological Sciences University of Queensland, St Lucia, Qld, abundance in northern Australia’s mesic tropical savanna. Forest
Australia. Ecology and Management 419, 146–159. doi:10.1016/J.FORECO.
R Development Core Team (2013). ‘R: a language and environment for 2018.03.034
statistical computing.’ (R Foundation for Statistical Computing: Vienna,
Austria.)
Royle, J. A., Chandler, R. B., Sollmann, R. and Gardner, B. (2013). ‘Spatial
capture-recapture.’ (Academic Press: Cambridge, MA.) Handling editor: Mike Calver
www.publish.csiro.au/journals/pcbYou can also read