Neurofunctional and neuroimaging readouts for designing a preclinical stem cell therapy trial in experimental stroke - Nature
←
→
Page content transcription
If your browser does not render page correctly, please read the page content below
www.nature.com/scientificreports
OPEN Neurofunctional and neuroimaging
readouts for designing
a preclinical stem‑cell therapy trial
in experimental stroke
Chloé Dumot1,2, Chrystelle Po3, Lucille Capin4, Violaine Hubert1, Elodie Ong1,2,
Matthieu Chourrout5, Radu Bolbos6, Camille Amaz7, Céline Auxenfans2,4,
Emmanuelle Canet‑Soulas1, Claire Rome8, Fabien Chauveau5,9 & Marlène Wiart1,9,10*
With the aim of designing a preclinical study evaluating an intracerebral cell-based therapy for
stroke, an observational study was performed in the rat suture model of ischemic stroke. Objectives
were threefold: (i) to characterize neurofunctional and imaging readouts in the first weeks following
transient ischemic stroke, according to lesion subtype (hypothalamic, striatal, corticostriatal); (ii)
to confirm that intracerebral administration does not negatively impact these readouts; and (iii) to
calculate sample sizes for a future therapeutic trial using these readouts as endpoints. Our results
suggested that the most relevant endpoints were side bias (staircase test) and axial diffusivity (AD)
(diffusion tensor imaging). Hypothalamic-only lesions did not affect those parameters, which were
close to normal. Side bias in striatal lesions reached near-normal levels within 2 weeks, while rats
with corticostriatal lesions remained impaired until week 14. AD values were decreased at 4 days and
increased at 5 weeks post-surgery, with a subtype gradient: hypothalamic < striatal < corticostriatal.
Intracerebral administration did not impact these readouts. After sample size calculation (18–147 rats
per group according to the endpoint considered), we conclude that a therapeutic trial based on both
readouts would be feasible only in the framework of a multicenter trial.
Ischemic stroke is a leading cause of mortality and disability worldwide1. To date, the only therapeutic option
is to reopen the occluded artery mechanically and/or p harmacologically2. This option is applicable only in the
acute phase for selected patients. In case of persisting disability, there is no treatment in the chronic phase to
restore function, except rehabilitation.
Stem-cell therapy is a promising therapeutic option to restore function in the acute, subacute and chronic
phases of ischemic stroke3–5. Mesenchymal stem cells are of major interest due to their low immunogenicity pro-
file, good availability and absence of ethical concerns. These pluripotent cells have the capacity to differentiate into
different cell types but their use is mainly based on their immunoregulatory properties. Adipose mesenchymal
stem cells (ASCs) are the more accessible source compared to bone marrow mesenchymal stem c ell6,7. Human
adipose-derived mesenchymal stem cells (hASCs) are already used in stroke clinical trials (NCT03570450)8.
However, the optimal route, time-window and cell dose still need to be determined in well-designed preclinical
studies. Intracerebral injection seems to be the most efficient route in terms of preclinical treatment efficacy due
to the direct delivery of stem cells but was mostly studied using cells of neural o rigins9. Although mesenchymal
stem cells have been shown to differentiate into neurons10, the main rationale for administering them intrac-
erebrally is to take advantage of their effects locally on the microenvironment, with the hope that it may foster
regeneration, for instance by promoting neuronal stem cell migration and differentiation, producing trophic
1
Univ Lyon, CarMeN Laboratory, Inserm U1060, INRA U1397, INSA Lyon, Université Claude Bernard Lyon 1,
Université Claude Bernard Lyon 1, Lyon, France. 2Hospices Civils de Lyon, Lyon, France. 3ICube, Université de
Strasbourg, CNRS, UMR 7357, Strasbourg, France. 4Tissue and Cell Bank, HCL, Lyon, France. 5Univ Lyon 1, Lyon
Neurosciences Research Center, CNRS UMR5292, Inserm U1028, Université Claude Bernard Lyon 1, Université
Claude Bernard Lyon 1, Lyon, France. 6Cermep, Lyon, France. 7Clinical Investigation Center, CIC 1407, HCL, Louis
Pradel Hospital, Lyon, France. 8Inserm, U1216, Grenoble Institut des Neurosciences (GIN), Université Grenoble
Alpes, 38000 , Grenoble, France. 9CNRS, Lyon, France. 10U1060 CARMEN-IRIS Team, Groupement Hospitalier Est,
Bâtiment B13, IHU OPERA, 59 Boulevard Pinel, 69500 Bron, France. *email: marlene.wiart@univ-lyon1.fr
Scientific Reports | (2022) 12:4700 | https://doi.org/10.1038/s41598-022-08713-z 1
Vol.:(0123456789)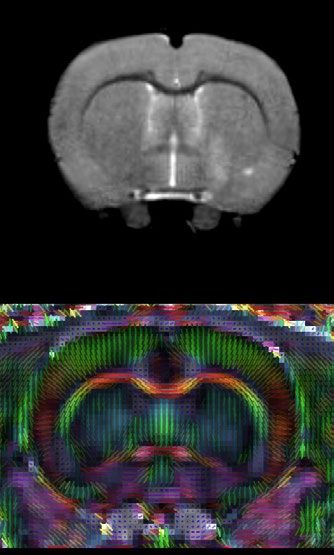
www.nature.com/scientificreports/
a ± intracerebral
Surgery
hASC
MRI MRI
D0 D4 D7 W5
Staircase task: habituation + training b Staircase task: c
5 times per week during 3 weeks 4 times per week during 5 weeks
Food restriction No food restriction Food restriction
± intracerebral
b hASC c
Sacrifice
MRI MRI
D0 D2 D4 D7 W6 W7 W8 W9 W10 W14 W15
Neuroscore
Staircase task:
Staircase task Staircase task 1 me per week
No food restric on Food restric on 24h before tes ng
Figure 1. Study design. (a) Experimental design; (b) focus on the first week of the experiment; (c) focus on
weeks 6 to 15: extended follow-up only for rats with corticostriatal lesions. D days, MRI magnetic resonance
imaging, hASC human adipose mesenchymal stem cells, W Weeks.
factors and modulating neuroinflammation11. Recent phase 0/1 clinical trials have also reported the safety of this
administration route in patients in the chronic stage of stroke8,11,12. In this context, our global aim was to design a
preclinical study to evaluate the effects of intracerebral administration of clinical-grade hASCs in ischemic stroke,
with a study design that aligns with clinical functional evaluation methods for long-term recovery s tudies3,13.
As is well-known, there are several obstacles to the translation of stem-cell research in ischemic stroke from
the preclinical to the clinical arena. The rigor of study design, the inclusion of different stroke subtypes, the
choice of appropriate primary readout parameters and well-defined sample sizes have been identified as key
factors to overcome the translational roadblock13–17. The assessment of neurofunctional outcome in chronic
stroke patients relies on clinical scores such as the National Institutes of Health Stroke Scale (NIHSS)8 and the
upper limb movement section of the Fugl–Meyer (FM) s cale18,19. Combining clinical scores with the assessment
of ipsilesional corticospinal tract (CST) remodeling with diffusion tensor imaging (DTI) can improve predic-
tion of motor outcome19–22. Accordingly, our preclinical stem-cell trial aimed at combining neuroscores and the
staircase test, a skilled reaching task that assesses forelimb function in rodent m odels14, with the DTI evaluation
of CST structural integrity (internal capsule).
There is a plethora of studies in the literature that evaluate stem cell therapy in rodent models of ischemic
stroke using neurofunctional and imaging outcomes5. However, despite international recommendations14,23,
most of them do not perform a priori sample size calculation and include a limited number of animals per group
(sometimes down to 5–6 animals per group24,25). Such studies are very likely to be underpowered26. Because of
the bias to publish positive results only, this might result in overstatement of efficacy27. In this context, there is a
need to improve the methodology of therapeutic preclinical trials. Ideally, a rigorous study design implies to thor-
oughly investigate these endpoints according to stroke subtype, in order to determine the optimal frequency of
measurements, the post-stroke period during which data should be monitored, the quantitative modifications of
readouts in time, and the within-laboratory variances. The specific aims of the present observational study with a
limited number of subjects were threefold: (i) to characterize neurofunctional readouts (neuroscores and staircase
test) and DTI metrics in the first weeks following transient middle cerebral artery occlusion (tMCAO) according
to stroke subtype; (ii) to confirm that intracerebral administration of hASCs does not negatively impact these
readouts (because of the invasiveness of the procedure); and (iii) to determine the most appropriate functional
and imaging endpoints, at which time-points they should be evaluated, and to calculate the sample size required
to achieve statistically significant differences with these endpoints for a preclinical exploratory therapeutic trial.
Results
Figure 1 shows the experimental design of the study. Briefly, after a 3-week period of training at the staircase
task, transient (60 min) middle cerebral artery occlusion was performed at day 0 (D0) (Fig. 1a). Neuroscores
were obtained at D2 post-surgery (Fig. 1b). The staircase test was then performed at D4 (before baseline MRI)
and D7 (before treatment administration). Baseline MRI, including T2-weighted imaging (T2WI) and diffusion
Scientific Reports | (2022) 12:4700 | https://doi.org/10.1038/s41598-022-08713-z 2
Vol:.(1234567890)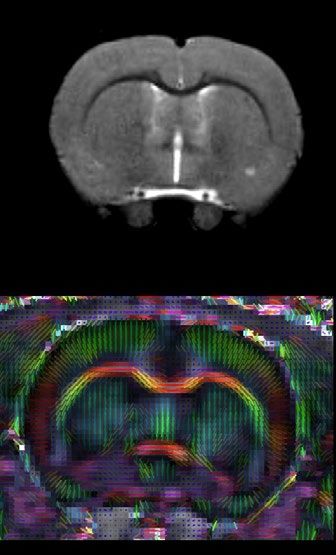
www.nature.com/scientificreports/

          a                  Corticostriatal lesions                                       Striatal lesions                            Hypothalamic lesions
                   W1 (D4)              W5                   W9                     W1 (D4)                   W5                    W1 (D4)                W5

           b                      Individual lesion sizes (mm3)                            c                        Average lesion size (mm3)
           300                                                                                     Pooled corticostriatal + striatal lesions   Hypothalamic lesions
                                                                       Hypothalamic -
           250                                                         non-treated         300
                                                                       Hypothalamic -
                                                                                           250
           200                                                         treated
                                                                       Striatal - non-     200
           150                                                         treated                                                                        ††
                                                                       Striatal -          150
           100                                                         treated
                                                                                           100                      *
                                                                       Corticostriatal -
              50                                                       non-treated         50                                                         *
                                                                       Corticostriatal -
               0                                                       treated                 0
                             D4                      W5                                                          D4                                 W5

                                    Figure 2.  Evaluation of lesions on T2-weighted imaging. (a) Longitudinal T2-weighted imaging of all included
                                    rats according to lesion subtype (only one central slice is shown). Treated rats (that received intracerebral
                                    administration of hASCs) are presented in top rows and circled. (b) Individual lesion sizes are presented
                                    according to lesion subtype (striatal, corticostriatal and hypothalamic lesions) and treatment group (plain
                                    line: treated; dashed line: non-treated) at day 4 (D4) and week 5 (W5) post-surgery. (c) Average lesion sizes
                                    are presented according to lesion subtype: pooled (corticostriatal + striatal) vs hypothalamic lesions. Data are
                                    displayed as mean ± SD. W weeks, D days; *p < 0.05, (corticostriatal + striatal) vs hypothalamic, Wilcoxon–
                                    Mann–Whitney test; †p < 0.05, ††p < 0.01, W5 vs D4, Friedman test.

                                    tensor imaging (DTI) sequences, was performed at D4 post-surgery (Fig. 1b). Cerebral lesions were stratified
                                    into 3 subtypes according to their location on baseline MRI: corticostriatal, striatal or hypothalamic-only28.
                                    Half of the rats received clinical-grade hASCs intracerebrally at D7. All rats were then monitored for 5 weeks
                                    with longitudinal neurofunctional tests and MRI. By this time, most rats had completely recovered according
                                    to neurofunctional testing, except those with corticostriatal lesions; for these rats, follow-up was extended to
                                    week 14 (W14) (Fig. 1c).

                                    Stroke subtypes. Supplementary Figure S1 presents the CONSORT-like chart of the study. Of the 25 rats
                                    trained at the staircase test, 18 matched the inclusion criteria and were thus selected to undergo surgery. Seven
                                    rats died before the end of the experiment: 2 during the surgical procedure, 4 in the first 24 h and 1 in the first
                                    48 h post-surgery, the 5 latter probably due to malignant edema. Of the 11 rats included in the study, 4 had a
                                    corticostriatal lesion, 3 a striatal lesion and 4 a hypothalamic lesion (Fig. 2, Supplementary Fig. S1). Body weight
                                    changes over time were similar for these 3 groups (Supplementary Fig. S2). Five animals received intracerebral
                                    hASC treatment (Fig. 2, Supplementary Fig. S1).

                                    Neurofunctional readouts. Staircase test. Figure 3a presents individual results for side bias according
                                    to lesion subtype and treatment group. Rats were slightly lateralized before surgery (side bias: 66% [56%; 66%]).

Scientific Reports |     (2022) 12:4700 |                  https://doi.org/10.1038/s41598-022-08713-z                                                                 3

                                                                                                                                                                 Vol.:(0123456789)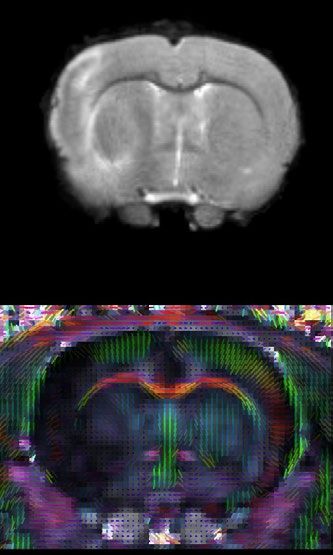
www.nature.com/scientificreports/
a Individual side bias b Average side bias
80% Pooled corticostriatal + striatal lesions Hypothalamic lesions
Hypothalamic -
70% non-treated 80%
60% Hypothalamic - 70%
treated 60%
50%
Striatal - non-
50% *
40% treated * * *
Striatal - 40%
30% **
treated 30%
20% Cor costriatal - 20%
non-treated †† † †
10% 10% ††
Cor costriatal - ††
0% treated 0%
Before D4 W1 W2 W3 W4 W5 Before D4 W1 W2 W3 W4 W5
c Individual neuroscores d Average neuroscore
18 Pooled corticostriatal + striatal lesions Hypothalamic lesions
Hypothalamic -
16 non-treated 18
14 Hypothalamic - 16
12 treated 14
10 Striatal - non- 12
treated 10
8
Striatal - 8
6 treated *
6
4 Cor costriatal -
4 *
2
non-treated †† ††
2 ††
Cor costriatal -
0 treated
0
D2 W1 W2 W3 W4 W5 D2 W1 W2 W3 W4 W5
Figure 3. Neurofunctional readouts. (a) Individual side bias according to lesion subtype and treatment group
(plain line: treated; dashed line: non-treated) in the first 5 weeks post-surgery. (b) Average side biases according
to lesion subtype: pooled (corticostriatal + striatal) vs. hypothalamic lesions. (c) Individual neuroscores
according to lesion subtype and treatment group (plain line: non-treated; dashed line: treated) in the first
5 weeks post-surgery. (d) Average neuroscores according to lesion subtype: pooled (corticostriatal + striatal)
vs. hypothalamic lesions. Data are displayed as mean ± SD. W weeks, D days. *p < 0.05, **p < 0.01,
(corticostriatal + striatal) vs. hypothalamic, Wilcoxon–Mann–Whitney test; †p < 0.05, ††p < 0.01, D4 to W5 vs.
before, Friedman test.
Side bias in the hypothalamic-only lesion group was maintained around 50% (i.e., no difference between right
and left paw performances) right after surgery and until the end of testing. In rats with striatal and corticostri-
atal lesions, side bias was severely increased in the first days after stroke (i.e., marked difference in favor of the
ipsilateral paw). Rats with striatal lesions recovered nearly to the level of rats with hypothalamic lesions at W2,
while rats with corticostriatal lesions remained severely impaired until W5 (Fig. 3a; W5: 6% [4%; 10%] for cor-
ticostriatal lesions vs 41% [39%; 48%] for striatal lesions and 51% [50%; 55%] for hypothalamic-only lesions).
The changes in time in the number of pellets taken by the control non-affected paw was similar for rats with
corticostriatal, striatal and hypothalamic lesions, thus suggesting that motivation to reach and eat pellets was the
same for each time point, regardless of lesion subtype (Supplementary Fig. S2). Staircase performance remained
low until W14 in rats with corticostriatal lesions (Supplementary Fig. S3). Intracerebral administration of hASCs
did not negatively impact staircase test performance (Table 1).
Because hypothalamic lesion did not have a neurofunctional impact on the staircase test, rats with hypotha-
lamic-only lesions were assimilated to sham-like animals, while rats with striatal and corticostriatal lesions were
considered as tMCAO rats and pooled for performing statistical analysis between 2 groups (N = 7 (corticostri-
atal + striatal) lesions vs N = 4 hypothalamic-only lesions). There was no difference in side bias across time in the
hypothalamic-only lesion group (Friedman test—p = 0.8291), contrary to the pooled (corticostriatal + striatal)
lesion group (Friedman test—p = 7.266e−05). Post-surgery side biases were statistically lower from pre-surgery
ones, except at W5 (post-hoc Conover test—D4: p = 0.0002; W1: 0.0090; W2: 0.0249; W3: 0.0357; W4: 0.0080;
W5: 0.1154). Side bias was statistically lower in pooled (corticostriatal + striatal) lesion group than in hypotha-
lamic-only lesion group at all time-points, except before surgery (Fig. 3b; Wilcoxon–Mann–Whitney test—Before
surgery: p = 1; D4: p = 0.0088; W1: p = 0.0105; W2: p = 0.0171; W3: p = 0.0424; W4: p = 0.0100; W5: 0.0424).
Neuroscores. Figure 3c,d present individual and averaged neuroscores according to lesion subtype and treat-
ment group. Intracerebral administration of hASCs did not aggravate neuroscores (Table 1). At D2, neuroscores
were in the same order of magnitude in rats with striatal lesion (13 [9; 14]) and rats with corticostriatal lesion
(15 [15; 15]), while rats with hypothalamic-only lesion had much lower neuroscores (2 [1; 3]) (Fig. 3c), thus
confirming our previous observations with regard to rats with hypothalamic-only lesions behaving as sham-like
animals. There was a significant difference in neuroscores across time in the hypothalamic-only lesion group
(Friedman test—p = 0.02727); however, none of the Conover post-hoc test were significant. In the pooled (cor-
ticostriatal + striatal) lesion group, the difference in neuroscores across time was statistically different (Fried-
Scientific Reports | (2022) 12:4700 | https://doi.org/10.1038/s41598-022-08713-z 4
Vol:.(1234567890)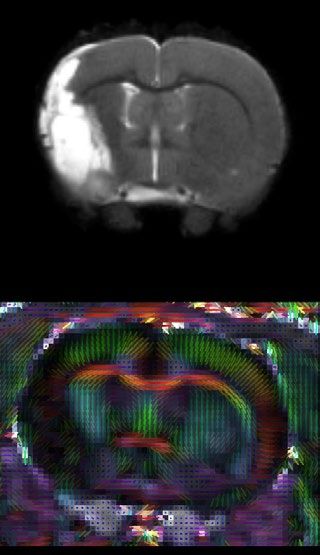
www.nature.com/scientificreports/
Biomarkers Time points Treated (N = 5) Non-treated (N = 6) p
Before treatment D2 11 ± 6 8±7 0.4059
Before treatment W1 5±4 4±3 0.7766
After treatment W2 2±1 2±1 0.4493
Neuroscores
After treatment W3 1±1 1±1 1
After treatment W4 0±0 0±0 1
After treatment W5 1±1 0±0 1
Before stroke 58% ± 5% 58% ± 11% 0.576
Before treatment D4 17% ± 20% 28% ± 27% 0.7787
Before treatment W1 26% ± 18% 30% ± 27% 1
Side bias (%) After treatment W2 30% ± 23% 31% ± 25% 1
After treatment W3 32% ± 19% 33% ± 25% 0.9307
After treatment W4 27% ± 24% 33% ± 26% 0.9266
After treatment W5 35% ± 22% 34% ± 24% 0.9307
Before treatment D4 129 ± 120 77 ± 92 0.5368
Lesion size (mm3)
After treatment W5 61 ± 78 41 ± 56 0.6473
Before tt D4 0.28 ± 0.03 0.27 ± 0.03 0.5368
Contra
After tt W5 0.26 ± 0.05 0.26 ± 0.02 0.9307
FA
Before tt D4 0.19 ± 0.03 0.22 ± 0.05 0.2468
Ipsi
After tt W5 0.38 ± 0.02 0.36 ± 0.02 0.2468
Before tt D4 0.76 ± 0.01 0.78 ± 0.04 0.5704
Contra
After tt W5 0.77 ± 0.01 0.75 ± 0.01* 0.0365
MD
Before tt D4 0.71 ± 0.06 0.75 ± 0.07 0.358
Ipsi
After tt W5 0.86 ± 0.17 0.86 ± 0.09 0.9307
DTI
Before tt D4 0.97 ± 0.10 1.02 ± 0.06 0.407
Contra
After tt W5 0.98 ± 0.04 0.98 ± 0.03 0.8541
AD
Before tt D4 0.91 ± 0.13 0.92 ± 0.10 0.7144
Ipsi
After tt W5 1.33 ± 0.19 1.24 ± 0.15 0.4286
Before tt D4 0.65 ± 0.01 0.66 ± 0.03 0.5778
Contra
After tt W5 0.64 ± 0.04 0.65 ± 0.02 1
RD
Before tt D4 0.63 ± 0.05 0.65 ± 0.04 0.583
Ipsi
After tt W5 0.72 ± 0.12 0.69 ± 0.09 0.9269
Table 1. Neurofunctional and neuroimaging readouts according to treatment group. Contra contralateral, D
days, Ipsi ipsilateral, tt treatment, W Weeks, FA fractional anisotropy, MD mean diffusivity, AD axial diffusivity,
RD radial diffusivity. p-values are given for Wilcoxon–Mann–Whitney test, *p < 0.05.
man test—p = 4.897e−06), with W3, W4 and W5 neuroscores that were statistically lower than D2 neuroscores
(Conover post-hoc test—W1: p = 0.3998; W2: 0.0955; W3: 0.0055; W4: 0.0015; W5: 0.0011). There was a sta-
tistically significant difference between the 2 groups at D2 that was attenuated but maintained at W1 (Fig. 3d;
Wilcoxon–Mann–Whitney test—D2: p = 0.0168; W1: p = 0.0188). Starting at W2, neuroscores were no longer
significantly different between groups, as all neuroscores had reached sham-like levels (Fig. 3d; Wilcoxon–
Mann–Whitney test—W2: p = 0.3276; W3: p = 0.754; W4: p = 0.3241; W5: p = 0.5708).
Imaging readouts. Brain lesions. Figure 2b,c show individual and average lesion sizes according to lesion
subtype and treatment group. As expected, at D4, there was a gradient in lesion size according to subtype (D4:
hypothalamic-only: 16 [5; 30] < striatal: 42 [28; 71] < corticostriatal: 227 [197; 249] mm3 and W5: hypothalamic-
only: 2 [0; 5] < striatal: 8 [6; 9] < corticostriatal: 127 [119; 138] mm3). Corticostriatal lesion volumes remained
stable after W5 (Supplementary Fig. S3; W9: 124 [111; 141] mm3). Intracerebral administration of hASCs did
not impact lesions sizes (Table 1). Lesion shrinkage between D4 and W5 was statistically significant in pooled
(corticostriatal + striatal) lesion group (Friedman test—p = 0.0081) but not in hypothalamic-only lesion group
(Friedman test—p = 0.0832). Lesion size was statistically larger in pooled (corticostriatal + striatal) lesion group
than in hypothalamic-only lesion group at both time-points (Fig. 2c; Wilcoxon–Mann–Whitney test—D4:
p = 0.0424 and W5: 0.0293).
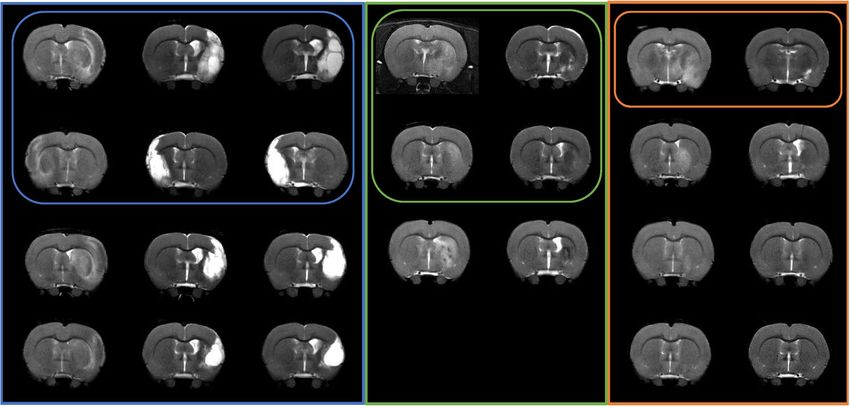
Microstructural alterations. The internal capsule appeared as a region characterized by a high fractional ani-
sotropy (FA) value localized between the lateral ventricle and the caudate putamen (Fig. 4a, white arrows).
Supplementary Figure S4 and Fig. 4b–e present individual and average DTI metrics (MD: mean diffusivity, AD:
axial diffusivity and RD: radial diffusivity) according to lesion subtype and treatment group. DTI metrics were
not impacted by intracerebral administration of hASCs (Table 1). DTI metrics did not change over time in the
Scientific Reports | (2022) 12:4700 | https://doi.org/10.1038/s41598-022-08713-z 5
Vol.:(0123456789)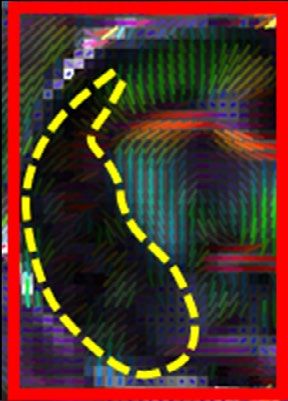
www.nature.com/scientificreports/
a D3 Hypothalamic lesion b Fraconal anisotropy (FA)
T2-weighted imaging
Hypothalamic - contra Pooled corcostriatal + striatal - contra
Hypothalamic - ipsi Pooled corcostriatal + striatal - ipsi
0.5
† ‡‡ †† ‡‡
0.4
D4 W5 **
0.3
‡‡
0.2
Diffusion tensor
0.1
0
D4 W5
Cor costriatal lesion c Mean Diffusivity (MD)
T2-weighted imaging
Hypothalamic - contra Pooled corcostriatal + striatal - contra
Hypothalamic - ipsi Pooled corcostriatal + striatal - ipsi
1.4
1.2 ††
1 *
D4 W5 ‡‡
0.8
Diffusion tensor
0.6
0.4
0.2
0
D4 W5
d Axial Diffusivity (AD) e Radial Diffusivity (RD)
Hypothalamic - contra Pooled corcostriatal + striatal - contra Hypothalamic - contra Pooled corcostriatal + striatal - contra
Hypothalamic - ipsi Pooled corcostriatal + striatal - ipsi Hypothalamic - ipsi Pooled corcostriatal + striatal - ipsi
2 1
†† ‡‡
* 0.8
1.5
† ‡‡
0.6
1
0.4
0.5
0.2
0 0
D4 W5 D4 W5
Figure 4. DTI readouts. (a) Example of T2-weighted imaging and color-coded fractional anisotropy for two
individual rats: one with a hypothalamic lesion and one with a corticostriatal lesion (dotted yellow line). Only
the central slice is presented. The internal capsule is pointed out by the white arrow. (b–e) Average DTI metrics
(respectively FA, MD, AD and RD) are presented according to lesion subtype: pooled (corticostriatal + striatal)
vs. hypothalamic lesions at day 4 (D4) and week 5 (W5) post-surgery. FA fractional anisotropy, MD mean
diffusivity, AD axial diffusivity, RD radial diffusivity. *p < 0.05, **p < 0.01, (corticostriatal + striatal) vs.
hypothalamic, Wilcoxon–Mann–Whitney test; †p < 0.05, ††p < 0.01, W5 vs. D4, Friedman test; ‡p < 0.05,
‡‡
p < 0.01, ipsilateral (ipsi) vs. contralateral (contra) side, Friedman test.
contralateral internal capsule in hypothalamic-only lesion group (Friedman test—FA: p = 1; MD: p = 0.3173;
AD: 0.3173; RD: 0.5637) and in pooled (corticostriatal + striatal) lesion group (Friedman test—FA: p = 0.2568;
MD: 0.4142; AD: 0.2568; RD: 1). Also, there was no significant difference between these 2 groups in the con-
tralateral internal capsule at D4 (Wilcoxon–Mann–Whitney test—FA: p = 0.5273; MD: p = 0.769; AD: 0.5044;
RD: 0.6311) and W5 (Wilcoxon–Mann–Whitney test—FA: p = 0.3152; MD: p = 0.3028; AD: 0.1829; RD: 0.7035)
(Supplementary Fig. S4, Fig. 4b–e). In the ipsilesional internal capsule, FA and MD were significantly decreased
at D4 in the pooled (corticostriatal + striatal) lesion group compared to the hypothalamic-only lesion group
(Fig. 4b,c; Wilcoxon–Mann–Whitney test—FA: p = 0.0060 and MD: p = 0.0363, represented by *). FA and AD
were significantly increased in the ipsilesional and internal capsule at W5 vs. D4 (represented by †) in both
hypothalamic-only lesion group (Friedman test—FA: p = 0.0455 and AD: p = 0.0455) and (corticostriatal + stri-
atal) lesion group (Friedman test—FA: p = AD: p = 0.0081). MD was significantly increased at W5 vs. D4 in the
(corticostriatal + striatal) lesion group only (Friedman test—p = 0.0081). FA was significantly decreased in the
ipsilesional vs. contralesional internal capsule (represented by ‡‡) at D4 in (corticostriatal + striatal) lesion group
(Friedman test—p = 0.0081). At W5, it was significantly increased in the ipsilesional vs. contralesional internal
capsule both in hypothalamic-only lesion group (Friedman test—p = 0.0455) and in (corticostriatal + striatal)
lesion group (Friedman test—p = 0.0081). AD was also significantly increased in the ipsilesional vs. contral-
Scientific Reports | (2022) 12:4700 | https://doi.org/10.1038/s41598-022-08713-z 6
Vol:.(1234567890)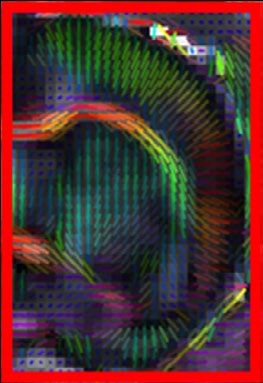
www.nature.com/scientificreports/
esional internal capsule both in hypothalamic-only lesion group (Friedman test—p = 0.0455) and (corticostri-
atal + striatal) lesion group (Friedman test—p = 0.0081) at W5. In rats with a corticostriatal lesion, FA remained
relatively stable in the ipsilesional internal capsule while MD, AD and radial diffusivity (RD) continued to
increase at W9 (Supplementary Fig. S3).
Post‑mortem analysis. An increase in the internal capsule thickness was clearly seen in the ipsilesional
side (Supplementary Fig. S5). The cellularity was enhanced in the ipsilesional internal capsule as seen by the
increased number of nucleus compared to the contralateral side, which suggest the presence of inflammatory
cells. CD68-positive cells (for macrophages) were not seen in the internal capsule and mainly found in the per-
ilesional area. A high density of GFAP-positive cells was also observed in the perilesional area, corresponding
to the glial scar. GFAP is expressed constitutively in astrocytes as seen in the contraleral internal capsule with a
typical ramified morphology. In the ipsilesional internal capsule, GFAP staining was present in association with
numerous nucleus suggesting astrogliosis. In addition, astrocytes presented a reactive phenotype compared to
the control side.
Therapeutic trial design. Correlation between imaging and neurofunctional readouts. Several correla-
tions were observed between imaging and neurofunctional readouts. Neuroscores at D1 and side bias at W5
were linearly related to lesion size at D4 (Supplementary Fig. S6). Figure 5 shows the most significant correla-
tions between side bias and DTI metrics. AD at W5 correlated with neuroscore at day 2 (Fig. 5a; Pearson’s corre-
lation—p = 3.65e−05) and with side bias at W1 (Fig. 5b; Pearson’s correlation—p = 0.0002) and W5 (Fig. 5c; Pear-
son’s correlation—p = 0.0003). Hence this parameter seemed the most relevant for detecting a treatment effect.
Sample size calculation. To assist in the design of future therapeutic trials, we performed calculations using
our data to determine sample size in order to detect a deficit in treated compared to non-treated tMCAO rats at
W5 after stroke. We assumed that the tMCAO group included corticostriatal and striatal lesions and excluded
hypothalamic-only lesions. The primary endpoints were side bias (Fig. 5e) and the DTI metric AD (Fig. 5f). For
the staircase test, we assumed a side bias value of 24% ± 20% in the non-treated tMCAO group (i.e., mean ± SD
from the pooled (corticostriatal + striatal) lesion group of the current study at W5). The side bias in the treated
group was then varied from 25 to 50% (corresponding to hypothalamic-only lesion levels at W5) by steps of
1% and sample size was calculated for each side bias (Fig. 5e). For side bias increasing from 24% to 32% (30%
improvement in side bias), sample size needs to be 147 rats per group in order to detect a significant difference
between groups. For side bias increasing from 24% to 36% (50% improvement in side bias, i.e. to reach the level
of rats with striatal lesions), sample size needs to be 76 rats per group. For DTI metrics, we assumed an AD value
of 1.37 ± 0.15 in the non-treated group (i.e., mean ± SD from the pooled (corticostriatal + striatal) lesion group of
the current study at W5). AD in the treated group was then varied from 1.36 to 0.99 (corresponding to contralat-
eral hypothalamic-only lesion levels at W5) by steps of 0.01 and sample size was calculated for each AD value
(Fig. 5F). For an AD value decreasing from 1.37 to 1.23 (10% improvement in AD value, reaching the level of
rats with striatal lesions), sample size needs to be 18 rats per group. For an AD value decreasing from 1.37 to 1.16
(15% improvement in AD value, i.e. to reach an intermediate value between rats with striatal and hypothalamic
lesions), sample size needs to be 9 rats per group only.
Discussion
We here report an observational, descriptive study aiming to design a larger-scale therapeutic trial to evaluate
intracerebral administration of hASCs in the chronic stage of ischemic stroke. Figure 6 summarizes the final
protocol design.
Although such preclinical trials have already been published in the literature29–31, several methodological
aspects, including choice of biomarkers, need to be considered to produce robust data that may be translated to
the clinical realm. We chose to model ischemic stroke in rats using transient occlusion of the middle cerebral
artery with an intraluminal thread. This model produces cerebral damage with a variety of lesion sizes and ana-
tomical locations (hypothalamus, striatum and cortex)28, as is common in ischemic stroke patients15. Because
lesion location, in addition to lesion size, is a main determinant of functional outcome, we reported our results
according to these 3 lesion subtypes.
Long-term neurofunctional tests remain a challenge due to the quick compensation of rodents and the dif-
ficulty to differentiate adaptive strategy from motor improvement13,32,33. The test must be quantitative, allow
repetition and it must reveal long term and stable deficits with enough sensitivity to show an improvement in
treated vs non-treated s ubjects34,35. The staircase test, a skilled reaching task that assesses forelimb function, fulfills
these criteria for the long-term evaluation of motor recovery in stroke-induced r ats36,37. However, the optimal
frequency of testing, the timescale and side bias modifications in time still remained to be d etermined38–41. Our
results confirm that the staircase test is an appropriate neurofunctional biomarker for the long-term evalua-
tion of rats with corticostriatal and striatal lesions. To the best of our knowledge, this is the first study to report
detailed changes in side bias over time according to lesion subtype using the tMCAO intraluminal thread model.
Because of the heterogeneity between striatal and corticostriatal lesions, the number of subjects per group to
detect a side bias difference in a stem-cell trial is relatively high (76–147 rats per group). This is not unfeasible
but necessitates a multicenter design, probably including at least 5 centers, as in Ref.42. Because animals with
corticostriatal and striatal lesions present different sensorimotor deficits and recovery, complementary analysis
may need to be performed in these subgroups, provided that the number of included animals provides sufficient
statistical power. Alternatively, pre-treatment T2WI may be used to include rats with corticostriatal lesions only,
Scientific Reports | (2022) 12:4700 | https://doi.org/10.1038/s41598-022-08713-z 7
Vol.:(0123456789)www.nature.com/scientificreports/
a 20 b 60%
18
16 50%
Neuroscore at D2
14
Side bias at W1
40%
12 R² = 0.8624
10 30%
R² = 0.7949
8
6 20%
4 10%
2
0 0%
0.9 1 1.1 1.2 1.3 1.4 1.5 1.6 0.9 1 1.1 1.2 1.3 1.4 1.5 1.6
AD at W5 AD at W5
c 70% d 70%
60% 60%
50% 50%
Side bias at W5
Side bias at W5
40% 40%
R² = 0.7637 R² = 0.8252
30% 30%
20% 20%
10% 10%
0% 0%
0.8 0.9 1 1.1 1.2 1.3 1.4 1.5 1.6 0.6 0.65 0.7 0.75 0.8 0.85 0.9
AD at W5 RD at W5
e Sample size with side bias as primary endpoint f Sample size with AD as primary endpoint
8000 250 4000 30
Number of rats per group
Number of rats per group
7000 200 3500 25
6000 150 3000 20
15
5000 100 2500
10
4000 50 2000
5
3000 0 1500 0
2000 30% 35% 40% 45% 50% 1000 1.00 1.05 1.10 1.15 1.20 1.25
1000 500
0 0
25% 30% 35% 40% 45% 50% 1.00 1.05 1.10 1.15 1.20 1.25 1.30 1.35 1.40
Side bias AD
Figure 5. Correlations between neurofunctional and imaging outcomes and sample size calculation. (a–d)
Main correlations between neurofunctional and imaging readouts. (a) Correlation between neuroscores at
D2 and AD at D5 (Pearson correlation test, p = 3.65e−05). (b) Correlation between side bias at W1 and AD at
W5 (Pearson correlation test, p = 0.00022). (c) Correlation between side bias at W5 and AD at W5 (Pearson
correlation test, p = 0.00034). (d) Correlation between side bias at W1 and RD at W5 (Pearson correlation test,
p = 6.543e−05). (e,f) Sample size calculation for future pre-clinical therapeutic trial. (e) Side bias as primary
endpoint. The x-axis represents the hypothesized value of side bias in the treatment group and the y-axis
represents the corresponding number of rats per group. (f) AD as primary endpoint. The x-axis represents the
hypothesized value of AD in the treatment group and the y-axis represents the corresponding number of rats
per group. AD axial diffusivity, RD radial diffusivity.
in order to reduce variability and hence sample size. This might be relevant for translational research, as half of
stroke patients experience persistent loss of upper-limb function in the chronic s tage16.
One limitation of the staircase test is that it requires intensive training and is prone to large exclusion rates
of low-learner rats37. In addition, implementation and analysis are quite strenuous and time-consuming. Hence
we aimed at simplifying the neurofunctional follow-up. As side bias remained stable in all groups 2 weeks after
tMCAO, a single week of testing (with block averaging) may be sufficient to assess stem-cell treatment effects.
We suggest choosing W5, because we found no further spontaneous improvement after this stage, while a follow-
up of at least one month after treatment is usually recommended for stem-cell studies34,43. Another limitation
of the staircase test is the necessity of food restriction to favor motivation. Some recent reports have shown a
neuroprotective effect of food restriction44,45 so food restriction may induce a bias when evaluating stroke recov-
ery. Nevertheless, both body weights and motivation was found to be similar at all time-points for the 3 groups
of lesion subtypes thus suggesting that that bias did not differently impact animals from the different groups.
Advanced neuroimaging modalities such as DTI are commonly used in clinical stroke research as comple-
mentary outcome measures to neurofunctional e valuation19. Axial diffusivity appeared to be the most relevant
parameter. We observed a decrease (although not significant) in AD in the ipsilesional internal capsule in the
Scientific Reports | (2022) 12:4700 | https://doi.org/10.1038/s41598-022-08713-z 8
Vol:.(1234567890)www.nature.com/scientificreports/
Surgery Randomization:
(tMCAO) intracerebral hASC
MRI: MRI:
T2WI, DTI Sacrifice
T2WI, DTI
W-1 D0 D4 D7 W5
Staircase task: habitua on + training Staircase task: Staircase task:
5 times per week 4 times per week Primary endpoint: 4 mes per week
during 3 weeks Averaged by block Side bias Averaged by block
Food restriction Food restriction
Secondary endpoint: Food restriction
Axial diffusivity
Figure 6. Design of preclinical therapeutic trial. The study design involves 2 staircase tasks (one before tMCAO
surgery and one 5 weeks after, i.e. 4 weeks post-treatment) and 2 MRIs with T2-weighted imaging and DTI
sequences (one at D4 post-surgery and one at 5 weeks after tMCAO surgery, i.e. 4 weeks post-treatment).
acute stage of ischemic stroke and a significant increase in the chronic stage. There was also a trend toward an
increase in RD in the chronic stage in the ipsilesional internal capsule. This is consistent with acute axonal dam-
age followed by chronic axon and myelin d amage46. Post-mortem immunohistological data also suggested the
potential sensitivity of DTI metrics to glial activation as already reported in the literature47. The hypothesis to
test in a stem cell trial would be that CST microstructural remodeling and immunomodulation by treatment
‘normalizes’ the AD value. Because DTI metrics are quite consistent over time and across animals, the number
of subjects per group if this metric is used as a primary endpoint (N = 9–18 according to the expected size effect)
would be compatible with a single-center exploratory study. However, such a study would be underpowered to
evaluate side bias at the same time, and should therefore be considered preliminary.
We did not observe any impact of intracerebral administration on neurofunctional and imaging readouts.
This is important to report as the main drawback of this route of administration is its invasiveness. We thus
confirm the safety of the procedure. On the other hand, there was no trend toward an improvement of any of
the endpoints evaluated in the group of rats that were injected with hASC compared to those who were not.
Although the study was not powered to detect such an effect, this suggests that cell therapy regimen may benefit
from being optimized before proceeding to the larger-scale preclinical trial. In particular, perilesional rather
than intra-striatal administration of hASC may provide better efficacy.
The main limitation of the present study was the small number of animals that were included. This was due
in part to a mortality rate that was higher than expected, probably due to complications such as hemorrhagic
transformation and malignant edema that are difficult to anticipate. Exclusion rates are rarely reported in stroke
research, which actually represents one of the methodological flaw of preclinical studies. Basalay et al. recently
reported a 25% exclusion rate at 24 h post-surgery due to the combination of mortality rate and hemorrhagic
transformations in a bicentre international study using the same tMCAO model in r ats48. For long-term stud-
ies, the mortality rate is increased as seen in the current study, where the mortality post-surgery exceeded our a
priori hypothesis: this is a further element to be taken into account when designing a therapeutic trial to reach
the adequate statistical power. Nevertheless, the study was designed as an observational study, results are shown
for individual animals and statistical analysis was performed between pooled (corticostriatal and striatal lesions)
lesions and sham-like (hypothalamic lesions) groups only. We therefore believe these results are robust and that
they are of interest to the stroke community by addressing the need to standardize preclinical stem-cell trials and
design high-quality studies. The next step will be to validate the selected neurofunctional and imaging readouts
in a larger exploratory study.
Conclusion
This study determined the optimal neurofunctional and imaging readouts for the follow-up of rats in the chronic
stage of ischemic stroke, the relevant timescale, and adequate sample size to evaluate the therapeutic effects of
intracerebral administration of hASCs, in line with international recommendations34. We conclude that an
exploratory preclinical trial based on both readouts would be feasible only in the framework of a multicenter trial,
which in turn would necessitate appropriate funding and/or an industrial partnership. Such rigorous approaches
are paramount for the successful translation of preclinical stem-cell research for the benefit of stroke patients.
Methods
Animals and ethics statement. All experimental procedures involving animals and their care conformed
to European regulations for animal use (APAFIS agreement number: APAFIS#4688-2016032514131943). This
study was approved by our institutional ethic committee “Comité d’éthique pour l’Expérimentation Animale
Neurosciences Lyon” (CELYNE-CNREEA number: C2EA-42). The rats were housed three to four per cage
(except in the first 2 days post-surgery where they were housed one per cage) in a temperature and humidity-
controlled environment (21.2 ± 3 °C), on 12:12 h light–dark cycle, having free access to tap water and standard
diet except during neurofunctional testing when they were put under food restriction for motivation (see details
Scientific Reports | (2022) 12:4700 | https://doi.org/10.1038/s41598-022-08713-z 9
Vol.:(0123456789)www.nature.com/scientificreports/
below). Rats were housed, regardless of type of lesion or treatment, in a standard Plexiglas box covered with
mulch and enriched with red-colored cylindrical plastic tubes. Male Sprague Dawley OFA rats (Crl:OFA(SD),
Charles River, France) aged 6–8 weeks were used, with a mean weight of 199 ± 13 g at the start of the experiment,
i.e. when they started habituation and training for the staircase task. Rats body weight was 268 ± 17 g at D0 when
they underwent surgery.
Sample size, inclusion criteria and blinding. The RIGOR guidelines were used to design the study49.
Data were reported according to ARRIVE (Animal Research: Reporting of In Vivo Experiments) g uidelines23.
Inclusion criteria were: lesion on D4 T2-weighted imaging, regardless of size and location, and complete neuro-
functional and imaging follow-up. No formal sample size was calculated for this observational, descriptive study.
We aimed at including 15 rats within 1 year. We thus planned to enroll 25 animals, assuming a 20% exclusion
rate for low-learners on the staircase test37 and 25% exclusion for the tMCAO model due either to mortality or
to absence of lesion on T2-weighted imaging at D448. All data were anonymized and analyses were performed
blindly. For the staircase test analysis, treatment group allocation was concealed by filming the rats from the side
so that rats that had undergone intracerebral administration could not be identified.
Ischemic stroke model. The animal model of ischemic stroke was the previously described tMCAO
odel50. Rats were anesthetized with a mixture of isoflurane and ambient air (4% during induction and between
m
1 and 2% during surgery) (ISO-VET, Piramal Healthcare, Morpeth, UK). Analgesia was obtained with subcuta-
neous administration of buprenorphine (Buprecare, Axience) at 0.05 mg/kg, injected after anesthesia induction.
Briefly, the model was performed by introducing the thread (Doccol corporation, USA) through the external
carotid artery. The thread was kept in place for 60 min. Because we aimed at inducing variability in a limited
number of subjects (in order to investigate lesion subtypes), the thread size was the same for all rats (0.39 mm)
and not adapted to the rat weight as we usually do. In these conditions, hypothalamic lesions are seen in a non-
negligible proportion of operated rats, while striatal and corticostriatal lesions are equally expected51. Definitive
occlusion of the internal carotid artery and external carotid artery was performed. Temperature was controlled
with a rectal probe throughout the surgical procedure with a heating pad set at 37 °C. The effectiveness of occlu-
sion was checked by the presence of a lesion on D4 T2-weighted imaging.
Stem‑cells. Surgical residue was harvested according to French regulations and declared to the Research
Ministry (DC no 2008162) following written informed consent from the patients. Human stromal vascular
fraction (SVF) was isolated from lipoaspirate obtained from healthy volunteers undergoing liposuction. Adi-
pose tissue was digested with collagenase (0.120 U/ml, Roche, Indianapolis, IN, USA) at 37 °C for 30 min and
under constant shaking. Digestion was stopped by adding Dulbecco’s Modified Eagle’s Medium (DMEM with
Glutamax®, Gibco®, Invitrogen, Carlsbad, CA, USA) containing 10% fetal calf serum (FCS, HyClone, Logan, UT,
USA). Floating adipocytes were discarded and cells from the SVF were pelleted, rinsed with medium, centri-
fuged (300×g for 5 min at 20 °C) and incubated in an erythrocyte lysis buffer for 20 min at 37 °C. The cell suspen-
sion was centrifuged (300×g for 5 min, 20 °C) and cells were counted using the Trypan blue exclusion method.
A total of 40,000 SVF cells/cm2 were plated and grown in proliferation medium containing DMEM (Gibco®, Life
technologies), HAM-F12 l-Glutamine (Gibco®, Life Technologies, St Aubin, France) (v/v), 10% FCS (HyClone),
10 ng/ml basic fibroblast growth factor (FGF2, Miltenyi Biotec, Paris, France), 10 μg/ml Gentamicin and 100 IU/
ml Penicillin (Panpharma, Fougères, France). The medium was changed three times a week until 80% confluence
was reached. At subconfluency, cells were detached with Trypsin-0.01%-EDTA ( Gibco® (Invitrogen, Carlsbad,
CA, USA) and centrifuged for 10 min at 300×g and amplified in subculture at 4000 cells/cm2 density during two
passages.
Stem‑cell administration. A subgroup of animals received clinical-grade human mesenchymal stem cells
derived from human adipose tissue (hASCs, codecoh number AC 2019-3476). Coordinates for stereotaxic injec-
tion were calculated from D4 MRI to inject cells in the striatal part of the lesion. Rats were anesthetized with
the same protocol as for stroke induction and placed in a stereotaxic frame (Stoelting, Chicago, IL, USA) with a
mask delivering isoflurane during the procedure. After opening the skin and careful drilling of the chosen entry
point, 500,000 hASCs were prepared in 10-µl medium solution and injected in 1 min through a 26-gauge needle
(RN-type, NH-BIO) with a UltraMicropump III with Micro4Controller (World Precision Instruments, Fried-
berg, Germany). The needle was kept in place for 2 min before careful progressive removal. The control subgroup
did not undergo intracerebral surgery, as we aimed at assessing the impact of intracerebral administration on
neurofunctional and imaging readouts.
Neurofunctional testing. Staircase test. Staircase testing was performed under restricted feeding to
maintain body weight at 90% of normal (0.05-g/g of weight)36,38. Weight was checked every day during the re-
striction period and the quantity of diet given daily after the staircase experiment was adapted in case of weight
loss. No diet restriction was imposed for 2 days before and 7 days after stroke to allow good recovery from
surgery. After a period of habituation to the experimenter (1 week) and to the pellets (Dustless precision pellets,
purified, 45 mg, Bio-Serv, Flemington), rats were placed for 10 min 5 days a week in the home-made staircase
box38,39. Rats with sufficient training (pellet retrieval ≥ 6 pellets in 10 min) were selected before stroke induction.
Unilateral stroke was performed to impair the dominant side when rats were lateralized (i.e., taking more pellets
on one side than the other: side bias > 60%), otherwise they were operated on the right side. Rats were filmed
during their task (Sony Xperia ZD compact) and analyses were made by a blinded observer after anonymization
of the movies. The number of pellets retrieved per side using the paw only was evaluated for each test session.
Scientific Reports | (2022) 12:4700 | https://doi.org/10.1038/s41598-022-08713-z 10
Vol:.(1234567890)www.nature.com/scientificreports/
With this apparatus, only the ipsilateral paw can take the pellet on the ipsilateral side and vice-versa. Data were
averaged by blocks of 4 tests to obtain 1 side-bias value per week. Side bias was used to evaluate neurofunctional
deficit and was calculated as contra/(ipsi + contra) performance, with ‘ipsi’ corresponding to the brain-spared
side and ‘contra’ to the brain ischemic side36. Staircase tests were carried out in the morning or in the afternoon
in alternation.
Neuroscore. The neuroscore was a scale from 0 to 20 that included sensorimotor tasks: gait, limb placing,
alk52. A higher score indicates a more severe deficit. The test was
parachute reflex, lateral resistance, beam w
performed in the morning.
MRI. For in vivo MRI, anesthesia was induced and maintained in the same way as during the surgery. The
animals were placed in an MRI-compatible rats cradle. The respiratory rhythm was monitored by a pressure
sensor linked to a monitoring system (ECG Trigger Unit HR V2.0, RAPID Biomedical, Rimpar, Germany). MRI
acquisitions were performed on a horizontal 7T BRUKER Biospec MRI system (Bruker Biospin MRI GbmH
Bruker, Germany) equipped with a set of gradients of 440 mT/m and controlled via Bruker ParaVision 5.1 work-
station. A Bruker birdcage volume coil (inner diameter = 72 mm and outer diameter = 112 mm) was used for
the signal transmission, and a Bruker single loop surface coil (25 mm diameter) was used for signal reception.
Two sequences were used: anatomical T2-weighted imaging (T2WI) and diffusion tensor imaging (DTI). Sup-
plementary Table S1 presents the acquisition parameters.
Images analyses. Bruker raw data were converted in Nifti format using the open source medical image con-
verter Dicomifier (https://github.com/lamyj/dicomifier). For assessment of lesion size, T2WI data were analyzed
blindly using ImageJ software (National Institute of Health, USA imagej.nih.gox/ij/) by manually contouring
the lesion, the ipsilateral and the contralateral hemispheres. The DTI parametric maps (fractional anisotropy
FA, mean diffusivity MD, axial diffusivity AD and radial diffusivity RD) thus directional color-coded fractional
anisotropy maps were obtained, after motion correction between volumes based on a rigid registration, using
FSL (FMRIB Software Library, The University of Oxford). Then, affine registration according to the FA map at
W5 was applied to individual maps using FSL. The internal capsule was analyzed to evaluate the ipsilesional
corticospinal tract disruption and remodeling in analogy to patient studies19,53. A manual region of interest
was used to delineate the ipsilesional striatum, where the internal capsule is located. Then the internal capsule
was automatically obtained by thresholding according to a FA value superior to 0.3. The contralateral ROI was
obtained by mirroring the ipsilateral ROI.
Immunohistochemistry (IHC). Rat brains were coronally sectioned in 10 µm using a cryostat (LEICA,
Microsystems). Tissue sections on slides were fixed with 4% PFA for 10 min at RT and rinsed in PBS buffer.
Immunohistochemistry (IHC) staining were performed on Discovery XT Automate (Roche), with the DAB
Map Detection Kit (RUO), DISCOVERY (Cat#05266360001, Roche). Sections were subjected to heat-mediated
antigen retrieval with Tris–EDTA Buffer (pH8) for 12 min at 95 °C. Incubation with primary antibody GFAP
(Cat#2334, Dako) at 1/1000 was performed for 1 h at 37 °C. Tissues sections were incubated with Biotinylated
Goat anti-rabbit IgG secondary antibody (Cat#BA1000, Vector) for 30 min at 37 °C. Sections were counter-
stained with hematoxylin. Slides were scanned on AxioScan Z1 (Zeiss) with a 20X objective.
Statistical analysis. Statistical analysis was performed with R for Mac (The R foundation for statistical
Computing). Data are given as median [25%; 75%] interquartile unless specified otherwise. Because the residual
normality hypothesis was not verified, for longitudinal data, differences between time-points were evaluated
with Friedman test followed by Conover post hoc test with p-value adjustment according to Holm method. Dif-
ferences between two groups at a given time point were evaluated with a two-sided Wilcoxon–Mann–Whitney
tests. The Pearson correlation test was used for correlation analysis. A p-value inferior to 0.05 was considered
significant. Sample size calculation were made with G*Power 3.9.11.2 for a power of 0.8, an alpha error of 0.05
and 2-sided Wilcoxon–Mann–Whitney tests for two groups using the data obtained in the study at week 5 post-
stroke (as further specified in the “Results” section).
Data availability
The processed data required to reproduce these findings and perform the statistical analyses are available to
download at the figshare repository—https://figshare.com (https://figshare.com/s/15af2a099076389d2a5e).
Received: 26 October 2021; Accepted: 9 March 2022
References
1. Benjamin, E. J. et al. Heart disease and stroke statistics-2017 update: A report from the American Heart Association. Circulation
135(10), e146–e603 (2017).
2. Powers, W. J. et al. 2018 guidelines for the early management of patients with acute ischemic stroke: A Guideline for Healthcare
Professionals from the American Heart Association/American Stroke Association. Stroke 49(3), e46–e110 (2018).
3. Savitz, S. I., Cramer, S. C. & Wechsler, L. Stem cells as an emerging paradigm in stroke 3: Enhancing the development of clinical
trials. Stroke 45(2), 634 (2014).
4. Krause, M., Phan, T. G., Ma, H., Sobey, C. G. & Lim, R. Cell-based therapies for stroke: Are we there yet? Front. Neurol. 10, 656
(2019).
Scientific Reports | (2022) 12:4700 | https://doi.org/10.1038/s41598-022-08713-z 11
Vol.:(0123456789)www.nature.com/scientificreports/
5. Li, J. et al. Mesenchymal stem cell therapy for ischemic stroke: A look into treatment mechanism and therapeutic potential. J.
Neurol. 268(11), 4095–4107 (2021).
6. Laso-Garcia, F. et al. Cell-based therapies for stroke: Promising solution or dead end? mesenchymal stem cells and comorbidities
in preclinical stroke research. Front. Neurol. 10, 332 (2019).
7. Fernandez-Susavila, H., Bugallo-Casal, A., Castillo, J. & Campos, F. Adult stem cells and induced pluripotent stem cells for stroke
treatment. Front. Neurol. 10, 908 (2019).
8. Chiu, T. L. et al. Intracerebral transplantation of autologous adipose-derived stem cells for chronic ischemic stroke: A phase I
study. J. Tissue Eng. Regen. Med. 16, 1–3 (2021).
9. Rodriguez-Frutos, B. et al. Stem cell therapy and administration routes after stroke. Transl. Stroke Res. 7(5), 378–387 (2016).
10. Chen, J. et al. Therapeutic benefit of intracerebral transplantation of bone marrow stromal cells after cerebral ischemia in rats. J.
Neurol. Sci. 189(1–2), 49–57 (2001).
11. Steinberg, G. K. et al. Clinical outcomes of transplanted modified bone marrow-derived mesenchymal stem cells in stroke: A phase
1/2a study. Stroke 47(7), 1817–1824 (2016).
12. Kalladka, D. et al. Human neural stem cells in patients with chronic ischaemic stroke (PISCES): A phase 1, first-in-man study.
Lancet 388(10046), 787–796 (2016).
13. Balkaya, M. & Cho, S. Optimizing functional outcome endpoints for stroke recovery studies. J. Cereb. Blood Flow Metab. 39, 2323
(2019).
14. Boltze, J. et al. Stem cells as an emerging paradigm in stroke 4: Advancing and accelerating preclinical research. Stroke 50(11),
3299–3306 (2019).
15. Bosetti, F. et al. Translational stroke research: Vision and opportunities. Stroke 48, 2632 (2017).
16. Corbett, D. et al. Enhancing the alignment of the preclinical and clinical stroke recovery research pipeline: Consensus-based core
recommendations from the Stroke Recovery and Rehabilitation Roundtable Translational Working Group. Neurorehabil. Neural
Repair 31(8), 699–707 (2017).
17. Burke Quinlan, E. et al. Neural function, injury, and stroke subtype predict treatment gains after stroke. Ann. Neurol. 77(1), 132–145
(2015).
18. Stinear, C. M. et al. Functional potential in chronic stroke patients depends on corticospinal tract integrity. Brain 130(Pt 1), 170–180
(2007).
19. Lee, J. et al. Efficacy of intravenous mesenchymal stem cells for motor recovery after ischemic stroke: A neuroimaging study. Stroke
53(1), 20 (2022).
20. Puig, J. et al. Diffusion tensor imaging as a prognostic biomarker for motor recovery and rehabilitation after stroke. Neuroradiology
59(4), 343–351 (2017).
21. Kim, B., Schweighofer, N., Haldar, J. P., Leahy, R. M. & Winstein, C. J. Corticospinal tract microstructure predicts distal arm motor
improvements in chronic stroke. J. Neurol. Phys. Ther. 45(4), 273–281 (2021).
22. Missault, S. et al. Neuroimaging of subacute brain inflammation and microstructural changes predicts long-term functional
outcome after experimental traumatic brain injury. J. Neurotrauma 36(5), 768–788 (2019).
23. Percie du Sert, N. et al. The ARRIVE guidelines 2.0: Updated guidelines for reporting animal research. Br. J. Pharmacol. 177(16),
3617–3624 (2020).
24. Bagdasarian, F. A., Yuan, X., Athey, J., Bunnell, B. A. & Grant, S. C. NODDI highlights recovery mechanisms in white and gray
matter in ischemic stroke following human stem cell treatment. Magn. Reson. Med. 86(6), 3211–3223 (2021).
25. Son, J. P. et al. Brain morphological and connectivity changes on MRI after stem cell therapy in a rat stroke model. PLoS ONE
16(2), e0246817 (2021).
26. Strech, D. & Dirnagl, U. 3Rs missing: animal research without scientific value is unethical. BMJ Open Sci. 3, e000035 (2019).
27. Macleod, M. R. et al. Good laboratory practice: preventing introduction of bias at the bench. Stroke 40(3), e50–e52 (2009).
28. El Amki, M. et al. Hypothalamic, thalamic and hippocampal lesions in the mouse MCAO model: Potential involvement of deep
cerebral arteries? J. Neurosci. Methods 254, 80–85 (2015).
29. Moisan, A. et al. Intravenous injection of clinical grade human MSCs after experimental stroke: Functional benefit and microvas-
cular effect. Cell Transplant. 25(12), 2157–2171 (2016).
30. Sammali, E. et al. Intravenous infusion of human bone marrow mesenchymal stromal cells promotes functional recovery and
neuroplasticity after ischemic stroke in mice. Sci. Rep. 7(1), 6962 (2017).
31. Moisan, A. et al. Intracerebral injection of human mesenchymal stem cells impacts cerebral microvasculature after experimental
stroke: MRI study. NMR Biomed. 25(12), 1340–1348 (2012).
32. Boltze, J., Lukomska, B., Jolkkonen, J., MEMS-IRBI Consortium. Mesenchymal stromal cells in stroke: Improvement of motor
recovery or functional compensation? J. Cereb. Blood Flow Metab. 34(8), 1420–1421 (2014).
33. Schaar, K. L., Brenneman, M. M. & Savitz, S. I. Functional assessments in the rodent stroke model. Exp. Transl. Stroke Med. 2(1),
13 (2010).
34. Cui, L. L., Golubczyk, D., Tolppanen, A. M., Boltze, J. & Jolkkonen, J. Cell therapy for ischemic stroke: Are differences in preclinical
and clinical study design responsible for the translational loss of efficacy? Ann. Neurol. 86(1), 5–16 (2019).
35. Schallert, T. Behavioral tests for preclinical intervention assessment. NeuroRx 3(4), 497–504 (2006).
36. Trueman, R. C. et al. Systematic and detailed analysis of behavioural tests in the rat middle cerebral artery occlusion model of
stroke: Tests for long-term assessment. J. Cereb. Blood Flow Metab. 37(4), 1349–1361 (2017).
37. Cirillo, C. et al. Focal malonate injection into the internal capsule of rats as a model of lacunar stroke. Front. Neurol. 9, 1072 (2018).
38. Montoya, C. P., Campbell-Hope, L. J., Pemberton, K. D. & Dunnett, S. B. The “staircase test”: A measure of independent forelimb
reaching and grasping abilities in rats. J. Neurosci. Methods 36(2–3), 219–228 (1991).
39. Pagnussat Ade, S., Michaelsen, S. M., Achaval, M. & Netto, C. A. Skilled forelimb reaching in Wistar rats: Evaluation by means of
Montoya staircase test. J. Neurosci. Methods 177(1), 115–121 (2009).
40. Podraza, K. M. et al. Improved functional outcome after chronic stroke with delayed anti-Nogo-A therapy: A clinically relevant
intention-to-treat analysis. J. Cereb. Blood Flow Metab. 38(8), 1327–1338 (2018).
41. Kloth, V., Klein, A., Loettrich, D. & Nikkhah, G. Colour-coded pellets increase the sensitivity of the staircase test to differentiate
skilled forelimb performances of control and 6-hydroxydopamine lesioned rats. Brain Res. Bull. 70(1), 68–80 (2006).
42. Llovera, G. et al. Results of a preclinical randomized controlled multicenter trial (pRCT): Anti-CD49d treatment for acute brain
ischemia. Sci. Transl. Med. 7(299), 299ra121 (2015).
43. Zerna, C., Hill, M. D. & Boltze, J. Towards improved translational stroke research: Progress and perspectives of the recent National
Institute of Neurological Disorders and Stroke Consensus Group Meeting. Stroke 43, 2341 (2017).
44. Zhang, J. et al. Preconditioning with partial caloric restriction confers long-term protection against grey and white matter injury
after transient focal ischemia. J. Cereb. Blood Flow Metab. 39(7), 1394–1409 (2019).
45. de Carvalho, T. S. et al. Hypocaloric diet initiated post-ischemia provides long-term neuroprotection and promotes peri-infarct
brain remodeling by regulating metabolic and survival-promoting proteins. Mol. Neurobiol. 58(4), 1491–1503 (2021).
46. Aung, W. Y., Mar, S. & Benzinger, T. L. Diffusion tensor MRI as a biomarker in axonal and myelin damage. Imaging Med. 5(5),
427–440 (2013).
47. Zhuo, J. et al. Diffusion kurtosis as an in vivo imaging marker for reactive astrogliosis in traumatic brain injury. Neuroimage 59(1),
467–477 (2012).
Scientific Reports | (2022) 12:4700 | https://doi.org/10.1038/s41598-022-08713-z 12
Vol:.(1234567890)You can also read