Neanderthal palaeoecology in the late Middle Palaeolithic of western Iberia: a stable isotope analysis of ungulate teeth from Lapa do Picareiro ...
←
→
Page content transcription
If your browser does not render page correctly, please read the page content below
JOURNAL OF QUATERNARY SCIENCE (2021) 00(0) 1–20                                                          ISSN 0267-8179. DOI: 10.1002/jqs.3363

Neanderthal palaeoecology in the late Middle Palaeolithic of western
Iberia: a stable isotope analysis of ungulate teeth from Lapa do Picareiro
(Portugal)
MILENA CARVALHO,1,2* EMILY LENA JONES,1 M. GRACE ELLIS,2,3 JOÃO CASCALHEIRA,2,4 NUNO BICHO,2,4
DAVID MEIGGS,5 MICHAEL BENEDETTI,2,6 LUKAS FRIEDL2,7 and JONATHAN HAWS2,8
1
 Department of Anthropology, University of New Mexico, Albuquerque, NM, USA
2
 Interdisciplinary Center for Archaeology and Evolution of Human Behaviour (ICArEHB), Universidade do Algarve, Faro, Portugal
3
 Department of Anthropology and Geography, Colorado State University, Fort Collins, CO, USA
4
 Faculdade de Ciencias Humanas e Sociais, Universidade do Algarve, Faro, Portugal
5
 Department of Sociology and Anthropology, Rochester Institute of Technology, Rochester, NY, USA
6
 Department of Earth and Ocean Sciences, University of North Carolina Wilmington, Wilmington, NC, USA
7
 Department of Anthropology, University of West Bohemia, Plzen, Czech Republic
8
 Department of Anthropology, University of Louisville, Louisville, KY, USA
Received 20 October 2020; Revised 24 June 2021; Accepted 31 July 2021

        ABSTRACT: Adaptation to Late Pleistocene climate change is an oft‐cited potential contributor to Neanderthal
        disappearance in Eurasia. Accordingly, research on Neanderthal behaviour – including subsistence strategies, mobility,
        lithic technology, raw material procurement and demography – often focuses on linking changes observable in the
        archaeological record to specific phases of climate and environmental change. However, these correspondences are often
        tenuous because palaeoclimatic and archaeological records are rarely available on the same scale. In Iberia, a critical
        location for understanding the demise of Neanderthals, some research indicates that Neanderthal populations were
        unable to recover from environmental degradations known as Heinrich Events, while other studies suggest that enclaves of
        Neanderthal populations survived for several millennia longer in refugial zones. Here, we present a palaeoenvironmental
        reconstruction study using analysis of δ13C and δ18O of herbivore tooth enamel recovered from two Mousterian deposits
        at Lapa do Picareiro, a site located in Portuguese Estremadura. We then use these data, combined with other site‐based
        palaeoenvironmental indicators, to assess whether central Portugal acted as a refugium during periods of unfavourable
        climate, and to test whether Neanderthals in Portuguese Estremadura reorganised their mobility strategies after severe
        climate episodes. © 2021 The Authors. Journal of Quaternary Science Published by John Wiley & Sons Ltd.

        KEYWORDS:        herbivores; Middle Palaeolithic; Neanderthals; palaeoecology; stable isotope analysis

Introduction                                                                 However, some studies suggest that late Neanderthal popula-
                                                                             tions in southern Europe were shielded from adverse environ-
About 40 000 years ago, Neanderthal populations disappeared                  mental conditions because they either remained in or
as modern humans spread across Eurasia during the Middle to                  contracted to refugial zones, or environments with more
Upper Palaeolithic Transition (MUPT). Although a consensus                   favourable conditions (see Jochim, 1987) during Heinrich
may be emerging around demography as the main factor                         Events (e.g. Sepulchre et al., 2007).
involved in the demise of Neanderthals, the underlying causes                   The Iberian Peninsula holds important clues for understanding
for demographic imbalances remain uncertain (Vaesen                          the dynamics that led to the demise of Neanderthals (e.g.
et al., 2021). One major area of investigation focuses on                    Finlayson et al., 2006; Zilhão et al., 2017; Marín‐Arroyo
responses to abrupt climatic and environmental deterioration                 et al., 2018; Haws et al., 2020). The region was arguably the
(Finlayson and Carrión, 2007; Finlayson and Giles‐                           home of the last and potentially latest surviving Neanderthals
Pacheco, 2000; Sepulchre et al., 2007; Staubwasser et al., 2018;             (Finlayson et al., 2006; Zilhão et al., 2010); it is also a place
Stewart, 2005, 2007; Vaesen et al., 2021). This approach                     where the MUPT is highly variable, with regions such as Vasco‐
centres on the rapid and dramatic climatic oscillations of MIS 3,            Cantabria and Portuguese Estremadura containing their own
particularly the Greenland Stadials (cold) and Interstadials                 distinct records (Straus, 2005, 2018; Zilhão, 2001; Bicho, 2004).
(warm) and the onset of Heinrich Events (e.g. Finlayson, 2004;               Iberia has long been considered a refugium for both plant and
Van Andel and Davies, 2003; Zilhão, 2006). A considerable                    animal communities during times of adverse climate conditions
amount of research suggests that Neanderthal populations were                (Finlayson et al., 2006) and a place where Neanderthal and
unable to adapt to or recover from the cold and dry conditions               modern human populations may have overlapped and even
of these events (d'Errico and Sanchez‐Goñi, 2003; Müller                     interacted (Marín‐Arroyo, et al. 2018; Haws et al., 2020).
et al., 2011; Van Meerbeeck et al., 2009; Finlayson and Giles‐                  However, linking observed changes in the archaeological
Pacheco, 2000; Stewart, 2004a,b; Stewart et al., 2003a).                     record to specific climate phases is a difficult endeavour (see
                                                                             Discussion in Jimenez‐Espejo et al., 2007); the error ranges of
*Correspondence: M. Carvalho, University of New Mexico, as above.            radiometric dating techniques are usually too large to
E‐mail: mcarvalho@unm.edu

© 2021 The Authors. Journal of Quaternary Science Published by John Wiley & Sons Ltd.
This is an open access article under the terms of the Creative Commons Attribution‐NonCommercial‐NoDerivs License, which permits use and
distribution in any medium, provided the original work is properly cited, the use is non‐commercial and no modifications or adaptations are made.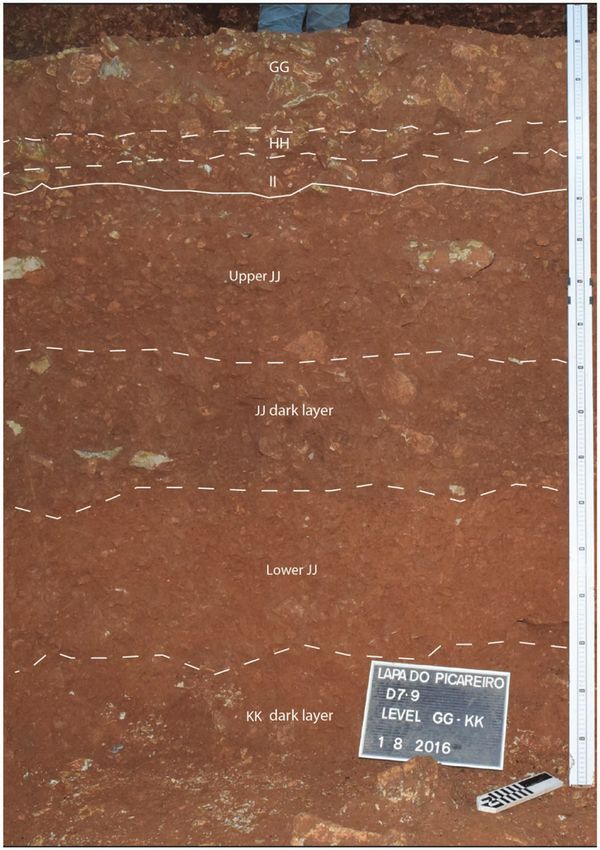
2                                                        JOURNAL OF QUATERNARY SCIENCE

determine a precise climate phase, especially close to the                        factors in the distribution of Neanderthals in Iberia (Finlayson
limit of radiocarbon calibration curves, and palaeoclimatic                       and Giles‐Pacheco, 2000; Stewart et al., 2003a,b; Stew-
reconstructions are limited, meaning we often need to rely on                     art, 2004a,b). A handful of contested dates suggest that
palaeoclimatic records obtained from sites that are hundreds of                   Neanderthals survived until c. 37–35k cal a BP in its southern
kilometres away. This, combined with the fact that Nean-                          refugial extremes while modern humans persisted in the open
derthals adapted successfully to a variety of climates and                        steppe environments of the north (e.g. Straus et al., 1993;
environments over their preceding 300 000 years (e.g.                             Straus, 1996, 2018; Zilhão, 2000, 2006, 2009; Zilhão
Finlayson 2004), makes environmental arguments for their                          et al., 2010, 2017). Other models posit that Neanderthals
demise difficult to support. Nonetheless, Neanderthal behaviour                   and modern humans had distinct ecological niches (d'Errico
appears to have been heavily influenced by the environment.                       and Sanchez‐Goñi, 2003; Sepulchre et al., 2007; Finlay-
Climatic                                                                          son, 2004; Finlayson and Giles‐Pacheco, 2000; Finlayson and
and environmental factors did have a role in the distribution                     Carrión, 2007; Jimenez‐Espejo et al., 2007). It may be that
of Neanderthal sites, and often, major technological and                          particular niche parameters, or the specific biotic or abiotic
behavioural reorganisations occurred after severe climate                         variables that make up a niche, were more important drivers of
episodes (e.g. Pettitt, 2003; Banks et al., 2021).                                Neanderthal distribution, and eventually disappearance, than
   In this paper, we use δ13C and δ18O analysis of herbivore                      others. Precipitation may have been a particularly important
teeth from late Middle Palaeolithic deposits (51 800–42 420 cal                   niche parameter: areas with higher levels of precipitation seem
a BP) at Lapa do Picareiro, a cave site in central Portugal, to                   to have been home to more Neanderthal sites, suggesting that
explore the relationship between climate, environment and                         moisture, rather than temperature, was critical for Nean-
Neanderthal extinction in Portuguese Estremadura. We present                      derthals (Jennings et al., 2011).
δ13C and δ18O data from red deer (Cervus elaphus) and ibex                           However, the limited MUPT record in much of Iberia
(Capra pyrenaica) tooth enamel recovered from two Mousterian                      beyond the northern and eastern coastal regions, especially in
layers at Picareiro, Levels KK and JJ. We then compare these                      Portugal, and often poor chronological control of transitional
data with previously published regional and site‐based                            deposits mean that hypotheses and models are built upon
geoarchaeological palaeoenvironmental records and to                              relatively small sample sizes and contested radiocarbon dates.
observed changes in occupation intensity and in raw material                      Late Neanderthal survival is increasingly questioned as re‐
procurement to answer the following questions: (1) Do the δ13C                    evaluations of radiocarbon dates point to much older ages (e.g.
and δ18O values of herbivore teeth at Picareiro provide local                     Wood et al., 2013; Higham et al., 2014; Cunha et al., 2019),
palaeoenvironmental information? (2) Is there evidence of a                       and as discoveries of possible early Aurignacian sites may
stable environment dominated by woodland forests and/or                           place modern humans in southern Iberia several millennia
higher humidity levels during Neanderthal occupations that                        earlier than previously known (Haws et al., 2020; Cortés‐
would indicate refugial conditions? (3) Was there a reorganisa-                   Sánchez et al., 2019), if modern humans were its maker (see
tion in human behaviour and technology, observed through                          Straus, 2020). Furthermore, it is unlikely that the fate of
changes in occupation intensity and raw material procurement                      Neanderthals was determined solely by climate, as Nean-
strategies, after episodes of severe climate change?                              derthals lived through 300 000 years of successful adaptations
                                                                                  to constantly changing environments (Finlayson 2004). Nean-
                                                                                  derthals had an extensive understanding of their surrounding
MIS 3, refugia, and ecological Neanderthal                                        landscape and the ecological communities within them,
extinction                                                                        exploited multiple environments due to their seasonal mobility
Environmental conditions during MIS 3 (~60–30k cal a BP)                          and varied subsistence strategies (e.g. Finlayson, 2004), made
fluctuated dramatically and relatively quickly, with changes                      improvements in tool‐making and raw material procurement
occurring over millennial and even centennial‐scale cycles                        (e.g. Baena et al. 2017) and often occupied diversity hotspots
(Jouzel et al., 1987; Voelker, 2002; Fletcher et al., 2010). This                 (e.g. Finlayson 2004). In other words, the observed plasticity in
period was marked by Greenland Interstadials, Stadials and                        Neanderthal ecology leaves open the discussion on the
Heinrich Events (when large quantities of icebergs floated into                   significance of climate in the extinction of Neanderthals.
the North Atlantic Ocean as far south as 37°N, resulting in                          Perhaps most importantly, drawing direct links between the
near‐catastrophic disruption of the Atlantic Meridional Over-                     archaeological record and climatic events is nearly always
turning Circulation; Grousset et al., 2001; Rasmussen                             challenging at best, due to differences in scale. For archae-
et al., 2014). The latter caused considerable cooling of sea                      ologists working in Iberia, much of the palaeoenvironmental
surface temperatures, which on land manifested as rapid                           information available for the Late Pleistocene derives from
onsets of extremely cold and dry conditions (Dansgaard                            pollen and deep‐sea sediment cores, and to a lesser extent, ice
et al., 1993; Heinrich, 1988; Kissel, 2005; Rasmussen                             cores. However, each palaeoclimatic proxy reflects information
et al., 2014).                                                                    on a multitude of temporal and spatial scales. Reconstructions
   In Iberia, these cycles resulted in the oscillation of the North               based on pollen records can reflect different catchment areas
Atlantic Polar Front between the northern strip of the Iberian                    and therefore contain information pertinent to local, subregio-
Peninsula (Galicia to the Basque Country) and slightly south of                   nal, regional and continental scales. Pollen obtained from deep‐
central Iberia (~39°N) (Baas et al., 1997; Hemming, 2004).                        sea marine sediments can reflect conditions that are basin‐wide,
The shifting polar front meant the boundary between the                           resulting in records that are indicative of continental or regional
Eurosiberian and Mediterranean bioclimatic zones wavered.                         conditions, while terrestrial pollen records are indicative of a
Greenland Interstadials and Stadials, and Heinrich Events                         more spatially limited area, reflecting regional, subregional and
continually modified the landscapes in which Neanderthals                         potentially local scales (see Jimenez‐Espejo et al., 2007 and
lived, with the cyclical deteriorations affecting human                           Jones, 2016). In addition to pollen, deep‐sea sediment cores
ecodynamics, technology and other aspects of culture                              contain foraminifera‐based δ18O records reflecting broad
(e.g. Melchionna et al., 2018; Müller et al., 2011; Obreht                        regional conditions (see Discussion in Jones, 2016). Ice cores
et al., 2017; Staubwasser et al. 2018).                                           produce oxygen isotope records on millennial and sometimes
   As might be expected given these conditions, relative                          centennial scales, but these are based on the δ18O composition
stability in climate and environment seem have been crucial                       of water in global‐scale hydrological systems.
© 2021 The Authors. Journal of Quaternary Science Published by John Wiley & Sons Ltd.                            J. Quaternary Sci., Vol. 00(0) 1–20 (2021)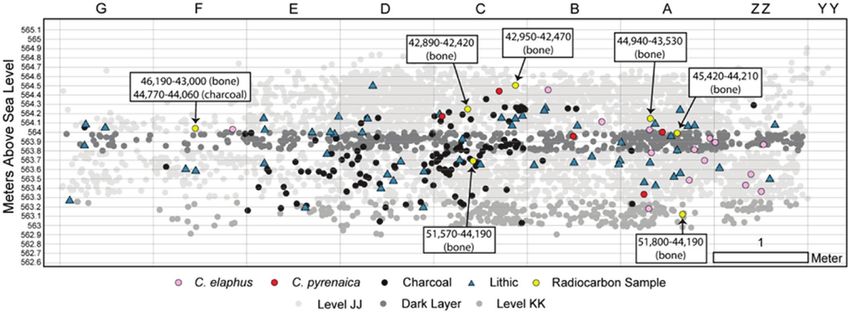
NEANDERTHAL PALAEOECOLOGY IN W. PORTUGAL                                                                  3

   The archaeological record, too, is susceptible to issues of                    distributions, or the proportion of plants using C3 versus C4
scale. At any given site, human occupation can be continuous                      photosynthetic pathways, of the territories in which an
(e.g. long term) or punctuated (i.e. short term), representative                  individual foraged during the period of tooth mineralisation
of a single event or, as is especially true of cave or rockshelter                (e.g. Fricke et al., 1998; Nelson, 2005; Schoeninger, 1995). In
sites, a palimpsest of many events and constrained by large or                    a temperate environment such as Europe, where C3 plants
small ranges of radiometric dates with differing error margins.                   dominate, the δ13C values of C3 plants are typically driven by
Thus, linking archaeological evidence to specific climate                         light and water stresses because C3 plants change respiration
phases is almost always an extremely conservative effort,                         rates to cope with limited precipitation and large quantities of
where changes in human behaviour tend to be assigned to                           insolation (Ehleringer et al., 1986). The δ13C values of plants
broad climate events such as Marine Isotope Stages. In reality,                   become enriched where evaporative stresses are high (forest
archaeological evidence of human activity could have formed                       upper canopies, open steppes and savannas) and depleted in
on millennial or even centennial scales under environmental                       environments where evaporative stresses are low, such as the
conditions that are essentially different from those used to                      vegetation available on forest floors (e.g. Vogel, 1980;
broadly describe the assigned Marine Isotope Stage (see                           Kohn, 2010; Cerling et al., 1997). In temperate settings, the
Discussion in Pederzani et al., 2021). This makes it particularly                 δ13C composition of a plant located in open areas can be
difficult to assess whether reorganisations in technology and                     elevated by 2–5‰ in comparison with those encountered in
behaviour (sensu Pettitt, 2003; see Bradtmöller et al., 2012 for                  closed forested environments, even for the same species of
the same concept applied to modern humans) occurred after                         plants, confirming that the canopy effect operates in non‐
severe climate events.                                                            tropical environments as well (e.g. Drucker et al., 2008). Thus,
   One way in which archaeologists have successfully secured                      the δ13C composition of tooth enamel from non‐migratory
a direct contextual connection between archaeological evi-                        herbivores can be a measure of how open (i.e. fewer trees due
dence and the climatic or environmental context of its                            to drier conditions) or closed (i.e. more trees due to wetter
deposition is through the creation of site‐based faunal tooth                     conditions) (Drucker et al., 2008) local vegetation systems
enamel stable isotope records obtained from faunal assem-                         were. However, interpreting this isotopic data requires an
blages that are either anthropogenic or in direct association                     understanding of a herbivore's ecology.
with artefacts or other archaeological evidence of human                             Red deer is one such herbivore commonly used in this type
activity (Pederzani et al., 2021). By using local, site‐based                     of analysis because it is ubiquitous in archaeological
records in direct association with archaeological evidence,                       assemblages, widely tolerant of different environments, and
the issues of scale, though not completely resolved, are                          studies show that changes in local environmental conditions
minimised.                                                                        are reflected in the isotopic values of its tissues (Richards and
   We employ this approach using the red deer and ibex teeth                      Hedges, 2003; Drucker et al., 2003, 2008, 2011; Stevens
from late Middle Palaeolithic deposits at Lapa do Picareiro, a                    et al., 2006, 2014). This ecologically plastic cervid can live in
cave site in central Portugal with occupations spanning the                       a variety of environments such as steppe, and boreal and
MUPT. We use this site‐based palaeoenvironmental record to                        closed temperate forests (Geist, 1998; Drucker et al., 2008).
demonstrate the influence of climate and environment on                           Red deer are flexible in terms of diet, as they are considered an
Neanderthal populations in Portuguese Estremadura, a parti-                       opportunistic mixed feeder (Straus, 1981; Hofman, 1989),
cularly understudied area in the study of Neanderthal                             foraging on forbs, foliage and other edible tree parts, grasses
extinction. Our goals for this study are threefold: (1) to assess                 and sedges (Gębczyńska, 1980; Heptner et al., 1989; Gebert
whether the use of δ13C and δ18O analysis obtained from                           and Verheyden‐Tixier, 2001). These characteristics have been
herbivore teeth can successfully reconstruct the local vegeta-                    shown at various Palaeolithic sites, where the δ13C composi-
tion and moisture regimes in the area immediately surrounding                     tion of Late Pleistocene red deer bones (collagen) in western
Lapa do Picareiro during different late Neanderthal occupa-                       Europe displays a range of values (δ13C diet = c. −29 to −24‰)
tions and if these link to specific climate events; (2) to evaluate               that in context suggest that red deer occupied both open and
whether Portuguese Estremadura was a refugium for Nean-                           closed habitats or foraged at a variety of elevations (Drucker
derthals during periods of adverse climate conditions; and (3)                    et al., 2008, 2011; Pilaar Birch et al., 2016; Stevens et al., 2014;
to ascertain whether Neanderthals in the area reorganised their                   Jones et al., 2019, 2020; Feranec et al., 2010). Modern red
behaviour or technological systems after severe climate                           deer migration behaviour varies because many factors (e.g.
episodes through observations in raw material use in the                          food availability, climate, mate availability, wildlife manage-
different Neanderthal occupations at this site.                                   ment practices, anthropogenic disturbance) can affect their
                                                                                  behaviour, with migrating distances ranging from 10 to
                                                                                  140 km, and migratory populations mostly located in the cold
Isotopic relationships and environmental factors                                  areas of North America (Boyce, 1991; Craighead et al., 1972).
The composition of δ13C and δ18O in animal teeth, particularly                    In the Late Pleistocene the migrating behaviour is unclear,
herbivore teeth, from archaeological remains is frequently                        though some studies indicate that that observed for other
used in assessments of the palaeodiets and palaeoenviron-                         ungulates such as reindeer during the Pleistocene has not been
ments of Neanderthals, modern humans and other hominins                           identified with Pleistocene red deer (Steele, 2002). The isotopic
(e.g. Bocherens et al., 1999, 2001; Jones et al., 2019; Feranec                   composition of the reconstructed diet of Palaeolithic red deer in
et al., 2010; Nelson and Rook, 2016; Faith, 2018). Here, we                       northern Spain from La Riera (Asturias), Covalejos, El Castillo
use this technique, applied to red deer and ibex tooth enamel,                    (Cantabria) and Valdegoba (Burgos) (roughly −26 to −24‰)
to assess whether the stable isotopic composition of herbivore                    suggests that red deer populations remained local (i.e. did not
tooth enamel can track environmental changes in moisture                          migrate), adapted to episodes of climate change, and foraged in
regimes and vegetation cover.                                                     relatively open temperate forest, mosaic‐like environments
   Environmental conditions, particularly the availability of                     (δ13Ctemperate forest: −23‰ to −33‰, the latter value representing
water, are reflected in the δ13C of plants and the tissues of the                 very closed‐canopy forest; Kohn 2010; Hemming et al. 2005).
herbivores that eat them, in both modern and ancient contexts                        The remains of ibex, another common ungulate in Palaeo-
in western Europe (Drucker et al., 2008). Thus, the δ13C values                   lithic archaeofaunas in Iberia, can also be used in this type of
obtained from herbivore tooth enamel mirror plant cover                           stable isotope analysis. Ibex, though a resilient ungulate, has
© 2021 The Authors. Journal of Quaternary Science Published by John Wiley & Sons Ltd.                             J. Quaternary Sci., Vol. 00(0) 1–20 (2021)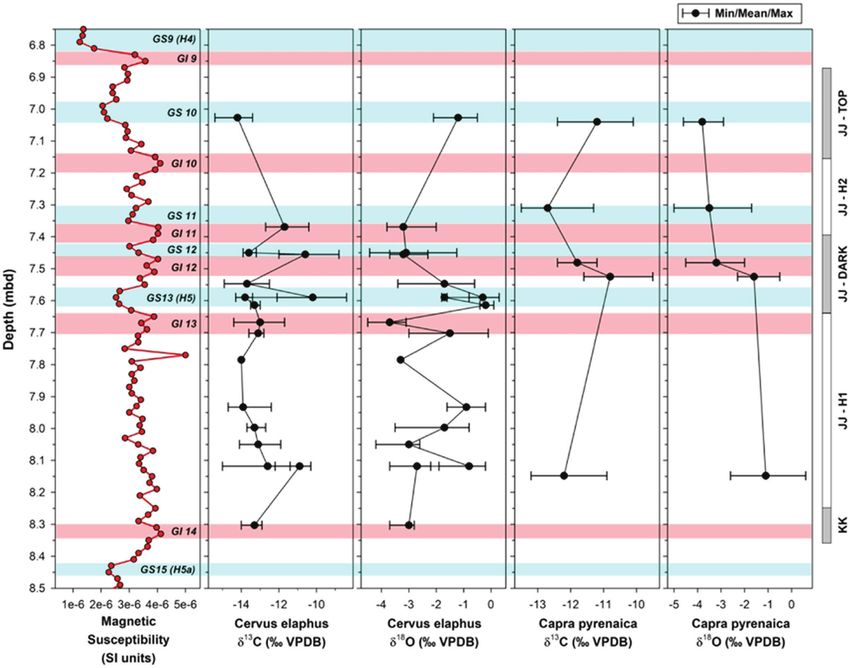
4                                                        JOURNAL OF QUATERNARY SCIENCE

slightly less ecological plasticity than red deer. Ibex are                       herbaceous dicots and to a lesser extent woody plants, red
typically considered high‐altitude ungulates that prefer steep                    deer have more flexible drinking strategies, meaning they
rocky areas in modern times, but archaeological data suggest                      sometimes drink from bodies of water. Because the δ18O
they also occupied lower elevations during the Late Pleisto-                      composition of meteoric water reacts similarly to evaporative
cene (Freeman, 1973; Phoca‐Cosmetatou, 2002). While they                          stresses, the δ18O values of red deer will generally reflect the
tend to graze more than red deer, ibex are flexible feeders,                      amount of evaporative stress in plants (e.g. herbaceous dicots,
shifting altitudinally, searching for food, foraging at the wetter,               woody plants or grasses) and/or meteoric water with values
higher altitudes during the dry summers, and at lower altitudes                   decreasing during times of less evaporative stress (more
in the spring, when there is generally more precipitation at                      precipitation or moisture) and increasing during periods of
lower elevations (Parrini et al., 2003). Other than the                           higher evaporative stress (less precipitation or moisture).
altitudinal movement, caprids like the ibex are assumed to                        However, the δ18O values from ibex teeth should over-
have been non‐migratory in the Late Pleistocene, moving to                        whelmingly reflect evaporative stress in the plants they
different areas in search of mates and adequate foliage (Ferrari                  consume. Variation in the δ18O signature of ibex teeth can
et al., 1988; Richard‐Hansen and Campan, 1992). The δ 13Cdiet                     thus be explained by a change in foraging location (e.g. lateral
data obtained from ibex tissues from the sites at Valdegoba and                   or altitudinal) or environmental change. The δ13C and δ18O
La Reira ranges from −26.4 to 21.9‰, which is slightly                            values observed in a herbivore's tooth enamel will either
enriched for temperate forests, and slightly more elevated than                   reflect where it feeds in the landscape or the environmental/
red deer (e.g. Jones et al., 2020; Feranec et al., 2010). This                    climatic conditions that individual faced, or a mixture of both.
indicates that Iberian ibex in the Late Pleistocene foraged in                    Similar to δ13C, interpreting variations in δ18O data is
environments that were slightly more open or higher in altitude                   dependent on understanding the mobility strategies of the
than red deer (Jones et al., 2020; Feranec et al., 2010).                         studied herbivore. Mobility of an individual can be assessed
   As flexible feeders, the δ13C values of red deer and ibex                      similarly as with δ13C, but a more robust measure uses δ18O:
should reflect mostly herbaceous dicots and woody plants                          by evaluating the range size in δ18O values (more variation =
(depleted δ13C values) during times of more closed‐canopy,                        limited mobility, less variation = higher mobility) (Pilaar Birch
forested vegetation, and wetter climates like those of the                        et al., 2016) and by comparisons with the rate at which the
interstadials. Enriched δ13C values should reflect grasses or                     δ18O composition of plants changes relative to altitude
plants growing in open‐canopy environments, such as the                           (Lachniet and Patterson, 2009; Andreu et al., 2011; Hartman
steppe that prevailed in southern Iberia during cold/arid stadial                 et al., 2015). Studies of the former have shown that for non‐
events and Heinrich Events. However, current evidence has                         migrating individuals, current data on modern populations
shown that both red deer and ibex populations remained local                      suggest that red deer should display a range of 3–4‰ and ibex
during the Late Pleistocene in Europe, but this does not rule                     2–4‰, while migrating populations of caribou (Rangifer
out the possibility that these ungulates had different mobility                   tarandus) in North America showed approximately 1‰ in
strategies at other times. It could be that variation in δ13C of                  variation in δ18O (Stevens et al., 2011). In terms of elevation,
both taxa over time is the product of changes in mobility,                        while some studies suggest that there is a depletion of ‐1‰ in
either laterally or altitudinally, instead of being caused by                     plant δ18O values for every 250–280 m gained in elevation
climate change. One can approach this problem isotopically                        (e.g. Lachniet and Patterson, 2009; Andreu et al., 2011;
(Pilaar Birch et al., 2016; Stevens et al., 2011). For both red deer              Hartman et al., 2015), due to the numerous geographic
and caprids like ibex, large variations in the range of intratooth                characteristics that affect how δ18O fractionate in a specific
δ13C (but more so for δ18O) observed in an individual can be a                    location (see Pederzani and Britton, 2019 and references
marker of limited lateral mobility wherein an individual faces                    therein), this calculation should be made in local systems or at
seasonal climate changes in one location throughout the year                      the site‐based level.
which are then recorded in tooth enamel (Pilaar Birch                                The fractionation patterns of δ13C and δ18O described above
et al., 2016), whereas a smaller range in intratooth δ13C values                  have been shown to be true regardless of feeding strategies in
could be indicative of an animal moving laterally to different                    some cases (Drucker et al., 2008; Bonafini et al., 2013).
territories in search of foliage throughout the year, and this would              However, changes in the isotopic composition of teeth from
dampen the isotopic signal of seasons in their teeth (see Pilaar                  evaporative‐sensitive taxa can also be linked to changes in
Birch et al., 2016). Assessing whether altitudinal movement is                    palaeodiet that could be related to changes in food availability,
affecting the isotopic composition of animal tissues is possible                  other types of environmental change, or some other event that
because the δ13C of plants increases by 0.7‰ with every 1000 m                    caused a shift in feeding behaviour (e.g. natural disasters). We
gain in altitude (Körner et al., 1988).                                           side‐step this issue by using more than one herbivore species
   While, in general, δ18O of herbivore tooth enamel tracks the                   to assess whether changes in δ13C and δ18O values reflect
composition of the water consumed by any given animal (e.g.                       climate change and demonstrate the same trends over time.
Quade et al., 1992), δ18O values can also be influenced by
many variables, including the animal's physiology and habitat
characteristics (e.g. elevation, distance to the coast, climate)
                                                                                  Neanderthal reorganisation after severe climate
(see Pederzani and Britton, 2019 and references therein). Like                    Neanderthal lifeways operated in a context of climate change,
δ13C values, δ18O values of meteoric and leaf water are                           and at some sites there is evidence that deteriorations in
sensitive to light and water stresses and fractionate similarly to                climate are followed by changes in their technology,
δ13C, where enriched values suggest more evaporative stress                       behaviour and networks (Pettitt, 2003). The Repeated Replace-
and lighter values suggest less evaporative stress (Quade                         ment Model expands on the idea of climate forcing cultural
et al. 1995). An important physiological property that guides                     change in the context of modern human resilience (Bradtmöl-
the interpretation of δ18O values is the way in which any given                   ler et al., 2012). This model, which borrows from socio‐
taxon consumes a majority of their water. Levin et al. (2006)                     ecological adaptive models (Holling 2001; Walker et al., 2006),
have shown that evaporation‐sensitive herbivores, those who                       places particular emphasis on Heinrich Events as ‘release
take in a majority of their water through their food, will have                   impacts’ or external factors that ‘lead to vital disturbances’ in
δ18O signals in their tissues that reflect the level of evaporation               socio‐ecological systems followed by various modes of
of leaf water. While ibex acquire most of their water from                        reorganisation (p. 41, Bradtmöller et al., 2012). One of the
© 2021 The Authors. Journal of Quaternary Science Published by John Wiley & Sons Ltd.                           J. Quaternary Sci., Vol. 00(0) 1–20 (2021)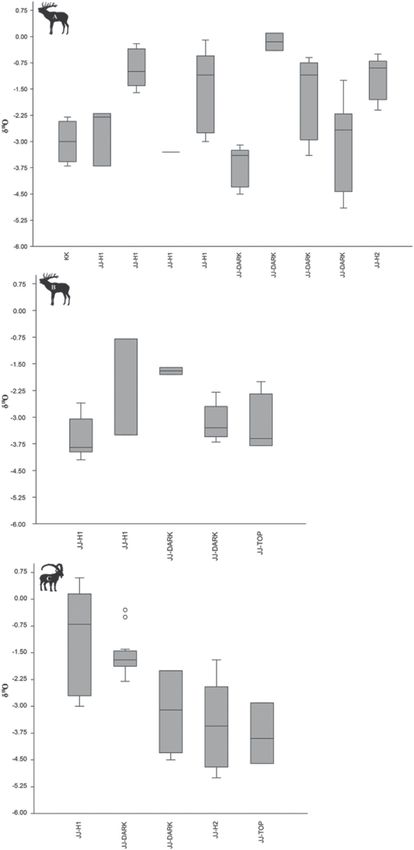
NEANDERTHAL PALAEOECOLOGY IN W. PORTUGAL                                                                  5

ways we identify a reorganisation in behaviour is by looking at                   et al., 2002). Warm events are characterised by peaks in
site occupation intensity through lithic assemblage size and                      Mediterranean forest cover (Haws et al., 2010). However,
the presence or absence of archaeology. If the size (relative to                  western Iberian palaeoenvironmental reconstructions are based
the volume of sediment and other contextual properties) of a                      on an extremely limited number of correlations between marine
lithic assemblage shifts during or after severe climate episodes,                 and terrestrial records. Whereas MIS 3 was a period of relatively
it is possible that this is evidence of a shift in lifeways for                   mild and stable environmental conditions even during Heinrich
Neanderthals. Another way reorganisations are visible in the                      Events in some parts of southern Europe such as southern Italy
archaeological record is through modification of lithic                           (e.g. Columbu et al., 2020), whether Portuguese Estremadura
technology (changes in tool types, raw materials, retouch                         was a refugium during this time is still to be determined.
frequency, etc.) after climatic disturbances, and these mod-                      Information about local environments in Iberia during MIS 3 is
ifications imply different organisational changes. Given that                     generally lacking, and the information available pertains to
lithic assemblages are sometimes small in size and have few                       different proxies operating on different temporal and spatial
diagnostic pieces, reorganisations of lifeways can be difficult                   scales (e.g. Denniston et al., 2018).
to observe. Emphasising raw material procurement strategies,                         Lapa do Picareiro is situated at 570 m above current sea level
however, overcomes this issue because changes in raw                              (a.c.s.l.), about 100 km northeast of Lisbon, on the west‐facing
material types can be observed in assemblages with relatively                     slope of the Serra de Aire, a limestone massif north of the Tagus
small sample sizes. In addition, observed changes in the types                    River Valley (Fig. 1) (Benedetti et al. 2019). Elevations within a
and sources of raw materials can tell us about changes in                         50 km radius of Picareiro range from roughly 200 to 660 m
mobility: if Neanderthals were procuring different raw                            a.c.s.l. Excavations at Picareiro have yielded large amounts of
materials after severe climate episodes, we can assume that                       animal bone, stone tool artefacts and charcoal from 40 strata, of
they were changing their mobility strategies to procure the                       which 36 are of Pleistocene age (E–NN). Deposits at Picareiro
new ones.                                                                         contain evidence of human occupation corresponding to the
   Here, we evaluate behavioural change or reorganisation of                      Middle Palaeolithic and the major Upper Palaeolithic phases,
lifeways at Lapa do Picareiro (central Portugal) by assessing                     including the Aurignacian, Gravettian, Solutrean and Magdale-
whether occupation intensity (measured by lithic assemblage                       nian        (e.g.   Benedetti      et     al.     2019;       Bicho
size) or raw material types changed after climatic disturbances                   et al., 2000, 2003, 2006, 2009; Bicho, 2004; Haws, 2006;
observed in the palaeoenvironmental record generated in this                      Haws et al., 2019, 2020, 2021). Picareiro is a unique site for
study. If Neanderthal occupation intensity and procured raw                       Portugal with deposits spanning the MUPT; the latest Middle
materials changed after a Heinrich Event or stadial period                        Palaeolithic occupation is dated to ~42k cal a BP and the earliest
identified in the stable isotope analysis, it is possible that this is            Upper Palaeolithic is dated to 41–38k cal a BP. The site has
evidence of a reorganisation in technology. However, if                           yielded one of the largest Palaeolithic archaeofaunal assem-
Neanderthals continue to use the same raw materials and site                      blages in Portugal, and preliminary taphonomic studies indicate
occupation remains the same regardless of climate change,                         that these animal remains were deposited by human activity as
could this mean refugial conditions did not force a reorganisa-                   well as by carnivores and raptorial birds (e.g. Haws et al., 2020).
tion? It is important to note that we understand this is not a robust                These factors, combined with the presence of well‐preserved
test of behavioural change or a reorganisation of lifeways, and                   ibex and red deer teeth encountered at varying depths of two
we may not be able to fully answer this question. However, there                  late Middle Palaeolithic levels, Levels KK and JJ, make Picareiro
is an advantage in making this type of observation: by analysing                  an ideal location at which to explore the palaeoecology of the
archaeological traces of human activity from the very deposits                    last Neanderthals in westernmost Iberia. For this paper, we
from which palaeoenvironmental conditions were isotopically                       analysed the δ13C and δ18O compositions of 22 red deer and
reconstructed, we can generate a more secure connection                           ibex teeth from two late Mousterian occupations. The isotope
between human activity and specific climate episodes.                             samples are grouped into five units based on their provenience
                                                                                  properties, as defined either as related to archaeology or by
                                                                                  stratigraphic characteristics and position: KK, JJ‐H1, JJ‐dark lens,
                                                                                  JJ‐H2 and JJ‐top (see Table 1, Fig. 2).
Materials and methods
Study area and site                                                               Level KK
One potential Neanderthal refugium in Iberia is Portuguese                        Level KK (Fig. 3) is a ~10 cm thick Mousterian deposit, located
Estremadura, an area considered a refugium during other                           roughly 8.35–8.64 m below datum (mbd). It is characterised by
periods of adverse conditions throughout the Pleistocene                          medium to large clasts with a yellowish red fine matrix that is
(Figueiral and Terral, 2002; Haws et al., 2010). Estremadura is                   slightly to moderately hard. This Mousterian level is tentatively
home to numerous well‐known earlier Middle Palaeolithic sites                     radiocarbon‐dated to 51.8–44.2k a cal BP, but this date is
including Gruta Nova da Columbeira, Gruta da Figueira Brava                       essentially the same as one from the overlying Level JJ
and Gruta da Oliveira, as well as the late Middle Palaeolithic                    Horizon. Alternatively, a composite deposition model based
site, Lapa do Picareiro. This limestone‐rich region is a large‐                   on the complete radiocarbon sequence dates suggests KK
scale ecotone where marine ecosystems and terrestrial                             could date to ~55–57k cal a BP (Benedetti et al. 2019). Very
Mediterranean bioclimatic zones overlap (Haws et al., 2010).                      few artefacts (n = 3) and few bones (faunal collections are still
The montane islands, plains and valleys of this area are home to                  undergoing analysis and so final counts are not available) were
Thermo‐ and Meso‐Mediterranean communities of vegetation                          encountered in this level; however, this may be due to the
(Quézel, 1985). During the Late Pleistocene, Portuguese                           limited surface area that has been excavated to this level. One
Estremadura was dominated by steppe‐like environments                             red deer lower second molar makes up this sample group.
and open mountain‐type habitats with predominantly pine
woodlands (González‐Sampériz et al. 2010). Plant species
distribution shifted slightly in elevation during periods of climate
                                                                                  Level JJ
fluctuation; steppic herbs and shrubs generally dominate and                      The remaining four sample groups are located in Level JJ. Level
tree occurrences are low during cold events (Sanchez‐Goñi                         JJ (Fig. 3) is a ~1 m thick deposit with archaeology representing
© 2021 The Authors. Journal of Quaternary Science Published by John Wiley & Sons Ltd.                             J. Quaternary Sci., Vol. 00(0) 1–20 (2021)
6                                                        JOURNAL OF QUATERNARY SCIENCE

Figure 1. Map showing location of Picareiro and other sites mentioned in the text. 1: La Riera, 2: La Cueva de Covalejos, 3: El Castillo, 4:
Valdegoba, 5: Figueira Brava, 6: Columbeira, 7: Buraca Gloriosa, 8: Lapa do Picareiro, 9: Oliveira.

the youngest definitively Middle Palaeolithic occupation at                       (see Benedetti et al., 2019). Because of this, identifying the
Picareiro (Benedetti et al. 2019). Stratigraphic integrity of these               environmental context of Neanderthal occupation has been
deposits is supported by the lack of significant inversions in                    difficult. According to the magnetic susceptibility data,
radiocarbon dates, and minimal to no disturbances by                              Heinrich Event 5 (peaked around 45k a cal BP) may have
burrowing animals (Benedetti et al., 2019). Evidence of Middle                    coincided with the deposition of the dark lens in between the
Palaeolithic human occupation in Level JJ at Picareiro includes                   lithic horizons (Fig. 4; Benedetti et al. 2019).
Mousterian lithic assemblages, tens of thousands of faunal
remains (currently undergoing analysis) that show signs of
butchery, and dispersed charcoal (see Figs. 2 and 4). The                         JJ‐H1
lithics are distributed in two horizons, Horizon 1 and Horizon                    JJ‐H1 is found at roughly 8.35–7.73 mbd and contains lithic
2, and are characterised by discoidal core/flake technology                       Horizon 1. It is characterised by medium clasts in a dark
typical of the Mousterian (Figs. 2 and S1), and raw materials                     reddish brown, very muddy, matrix and radiocarbon dates
include chert, quartz and quartzite. The two artefact horizons                    targeting artefact Horizon 1 place it at c. 51.5–44.1k cal a BP.
are separated by a dark, organic‐rich sediment lens (Fig. 3) that                 The magnetic susceptibility data suggest Level KK was
contains rare lithics and few bones. Based on preliminary                         deposited during Greenland Interstadial/Stadial 15 and Green-
analysis, human activities encountered in Level JJ include                        land Interstadial/Stadial 14. Seven red deer teeth and one ibex
carcass butchering, processing and cooking, and ephemeral                         tooth form this group (see Table 1).
hearth activity. Level JJ has three phases of more intense
human occupation associated with Horizon 1, Horizon 2 and
the anthropic archaeofaunas in the top 20–30 cm of this layer,                    JJ‐dark lens and JJ‐H2
making it an ideal place to track changes in environment and                      The upper half of Level JJ contains both the JJ‐H2 and JJ‐dark
Neanderthal behaviour over time.                                                  lens groups. Upper JJ is characterised by medium to large clasts
   Magnetic susceptibility data (Fig. 4, see also Fig. S2) show                   within a clay‐rich matrix with a lens of dark reddish brown
that the climate oscillated frequently during the deposition of JJ                organic‐rich fine sediment in the lower 20–25 cm of this unit.
© 2021 The Authors. Journal of Quaternary Science Published by John Wiley & Sons Ltd.                           J. Quaternary Sci., Vol. 00(0) 1–20 (2021)
Table 1. Information and summary statistics for all samples in this study. All of the δ13C values in this table have been corrected to account for changes in atmospheric CO2 in the past per Passey et al. (2009) and
raw values can be found in Appendix B. δ13Cdiet was calculated using the fractionation factor of ‐14‰ between enamel and diet according to Passey et al. (2005). L: lower (mandibular), U: upper (maxillary), M:
molar, n: number of sequential samples per tooth, SD: standard deviation, CE: C. elaphus, CP: C. Pyrenaica, BD: below datum, ASL: above sea level.
Unit Specimen ID Tooth n δ13C MEAN δ13C MIN δ13C MAX SD δ13Cdiet MEAN δ18O MEAN δ18O MIN δ18O MAX SD Taxon DEPTH BD (m) DEPTH ASL (m)
JJ‐top B9.1115 L, M1/M2 5 −14.2 −15.4 −13.4 0.75 −28.2 −1.2 −2.1 −0.5 0.65 CE −7.027 564.456
C10.428 L, P3 3 −11.2 −12.4 −10.1 1.14 −25.2 −3.8 −4.6 −2.9 0.85 CP −7.040 564.443
JJ−H2 C9.1315 L, M1/M2 6 −12.7 −13.5 −11.3 0.87 −26.7 −3.5 −5 −1.7 1.27 CP −7.310 564.173
B10.418 L, M3 4 −11.7 −12.7 −10.4 1.08 −25.7 −3.2 −3.8 −2 0.84 CE −7.369 564.114
JJ−dark lens F7.Wall† L, M2 7 −13.6 −13.9 −13.2 0.2 −27.56 −3.1 −4.43 −1.25 1.31 CE −7.450 564.033
A10.826 U, M3 5 −10.6 −12 −8.8 1.17 −24.6 −3.2 −3.7 −2.3 0.52 CE −7.455 564.028
A10.840 L, M1/M2 7 −11.8 −12.4 −11.2 0.45 −25.8 −3.2 −4.5 −2 1.08 CP −7.481 564.002
B10.426 U, M3 12 −10.8 −11.6 −9.5 0.54 −24.8 −1.6 −2.3 −0.5 0.6 CP −7.525 563.958
A10.873 U, M1/M2 5 −13.7 −14.9 −12.5 1.01 −27.7 −1.7 −3.4 −0.6 1.21 CE −7.547 563.936
ZZ11.1457‡ L, M2 2 −10.2 −12.1 −8.4 0.67 −24.2 −0.3 −0.8 0.3 0.18 CE −7.590 563.893
ZZ11.1457‡ L, M3 2 −13.8 −13.4 −14.3 2.63 −27.8 −1.7 −1.6 −1.8 0.76 CE −7.590 563.893
ZZ11.1497 U, M2 2 −13.3 −13.5 −13 0.36 −27.3 −0.2 −0.4 0.1 0.37 CE −7.614 563.869
A10.884 L, M2 5 −13 −14.4 −11.7 1.05 −27 −3.7 −4.5 −3.1 0.6 CE −7.668 563.815
© 2021 The Authors. Journal of Quaternary Science Published by John Wiley & Sons Ltd.
JJ−H1 A10.897 U, M3 5 −13.1 −13.6 −12.8 0.31 −27.1 −1.5 −3 −0.1 1.19 CE −7.702 563.781
A11.595 U, M1/M2 1 −14 −3.3 CE −7.785 563.698
ZZ11.1658 L, M2 5 −13.9 −14.7 −12.4 0.94 −27.9 −0.9 −1.6 −0.2 0.56 CE −7.933 563.550
A11.671 U, M3 3 −13.3 −13.7 −12.7 0.53 −27.3 −1.7 −3.5 −0.8 1.53 CE −7.997 563.486
ZZ11.1750 L, M3 7 −13.1 −14.1 −11.9 0.94 −27.1 −3 −4.2 −2.6 0.58 CE −8.050 563.433
ZZ11.1754‡ L, M1 4 −12.6 −15 −11.4 1.64 −26.6 −0.8 −1.9 −0.2 0.79 CE −8.118 563.365
ZZ11.1754‡ L, M2 3 −10.9 −12.2 −10.3 1.09 −24.9 −2.7 −3.7 −2.2 0.86 CE −8.118 563.365
A10.984 L, M1/M2 6 −12.2 −13.2 −10.9 0.78 −26.2 −1.1 −2.6 0.6 1.48 CP −8.148 563.335
NEANDERTHAL PALAEOECOLOGY IN W. PORTUGAL
KK A11.722 L, M2 4 −13.3 −14 −12.9 0.51 −27.3 −3 −3.7 −2.8 0.57 CE −8.303 563.180
†
This sample was obtained from a previous isotope study in which different pre‐treatment protocols were used, which are listed in Appendix A.
‡
Indicates teeth with corresponding specimen ID numbers that were sampled from the same mandible.
J. Quaternary Sci., Vol. 00(0) 1–20 (2021)
78 JOURNAL OF QUATERNARY SCIENCE
Figure 2. Spatial distribution of samples, lithics, faunal remains (grey circles) and calibrated radiocarbon dates (see Benedetti et al., 2019 for more
information). [Color figure can be viewed at wileyonlinelibrary.com].
depth of ~7.17–7.40 mbd. Magnetic susceptibility data suggest
that JJ‐H2 includes Greenland Interstadial/Stadial 12. For this
group, one red deer tooth and one ibex tooth were selected.
JJ‐top
The final sample group is JJ‐top, and it comprises the top
20–30 cm of Upper JJ, located roughly at 6.87–7.17 mbd. One
date places it at ~43–42.5k cal a BP. It displays the same
stratigraphic properties as JJ‐H2. This portion of Level JJ
contained one lithic artefact, but preliminary results from
ongoing analyses identified faunal remains with cut marks,
percussion marks and breakage patterns consistent with
butchering practices (Haws et al. 2020). One red deer tooth
and one ibex tooth make up this group.
Stable isotope analysis
Information on the teeth sampled is available in Table 1. While
ideally in this type of study, one would sample the same tooth
(e.g. upper M3) across individuals in order to avoid using
multiple teeth from the same individual that may have travelled
vertically through sediments due to bioturbation, sample
selection was driven by the limited availability of red deer and
ibex teeth. Although the M3 is the most suitable for this analysis,
we were forced to use whole teeth and tooth fragments from all
molars and one premolar, including some instances where the
identification of a tooth fragment could not go beyond M1/M2.
Even though sampling is not ideal, we are confident that Lapa do
Picareiro has minimal bioturbation and maintains stratigraphic
Figure 3. Stratigraphic profile showing Levels JJ and KK. Notice the integrity (see Discussion in Benedetti et al., 2019). We sampled
dark band in the middle of Level JJ. [Color figure can be viewed at
wileyonlinelibrary.com] all but one tooth (ID = A11‐595 in JJ‐H1) sequentially to obtain
ranges in variation of δ13C and δ18O values during enamel
mineralisation as data obtained from bulk sampling dampens the
The lens of darker, organic‐rich sediments wedged between signal of variation, (Reade et al., 2015), though we do not assess
the two lithic horizons at an approximate depth of 7.40–7.65 seasonality in depth here. In two cases, we sampled two teeth
mbd (see Fig. 2) forms the JJ‐dark lens group. Magnetic from the same mandible (M1and M2 from ZZ11‐1757 and M2
susceptibility data suggest this phase was deposited during and M3 from ZZ11‐1457) to assess the range of variation of a
Greenland Interstadial/Stadial 13 and Heinrich Event 5 (Fig. 4, local individual red deer. In addition, the δ13C and δ18O values
Fig. S2). This layer contains few lithics (n = 7) but several of one red deer sample (specimen ID = F7.Wall) was obtained
thousand bones. Seven red deer and two ibex teeth make up from a previous analysis using a different pre‐treatment protocol
the JJ‐dark lens group. JJ‐H2 contains lithic Horizon 2. that produced virtually identical results as the protocol used on
A radiocarbon dating assay targeting artefact Horizon 2 the remaining samples. Details of the two pre‐treatment mass
yielded a date of 44.9–42k cal a BP and corresponds to a spectrometry protocols we used are available in Appendix A.
© 2021 The Authors. Journal of Quaternary Science Published by John Wiley & Sons Ltd. J. Quaternary Sci., Vol. 00(0) 1–20 (2021)NEANDERTHAL PALAEOECOLOGY IN W. PORTUGAL 9
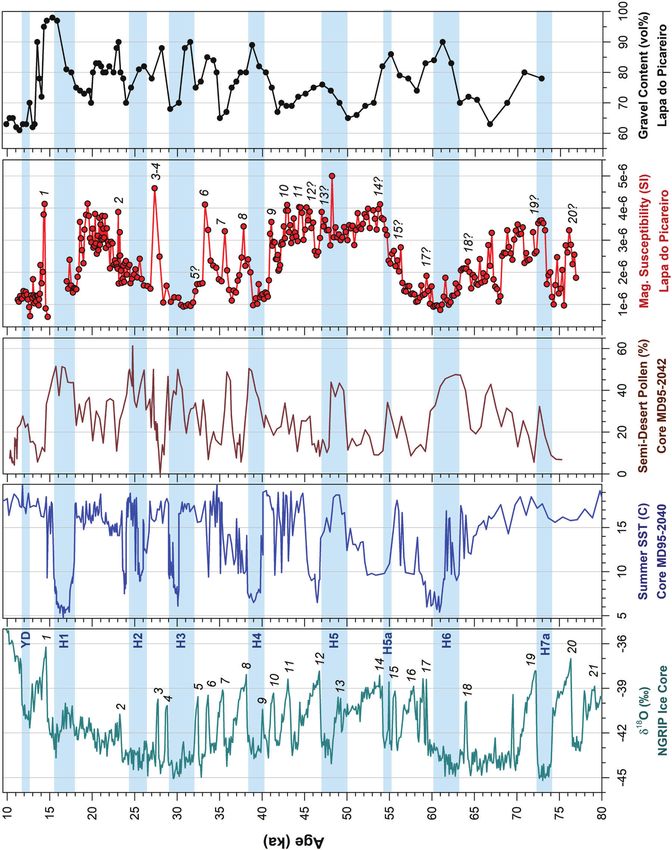
Figure 4. Magnetic susceptibility data obtained from Lapa do Picareiro (Benedetti et al., 2019) and correlations with the δ18O fluctuations in the
NGRIP ice core record (Rasmussen et al., 2014), the MD95‐2040 deep‐sea sediment record (Salguero et al., 2010; Daniau et al., 2007) and gravel
content from Picareiro (Benedetti et al., 2019). The Picareiro magnetic susceptibility data are plotted on the C14 age model presented in Benedetti
et al. 2019, with some small adjustments for new radiocarbon dates presented in Haws et al. (2020). [Color figure can be viewed at
wileyonlinelibrary.com].
Statistical analysis
statistically significant. All quantifications were completed
Although parametric tests can be more robust, nonparametric using the PAST4 statistical package (Hammer et al. 2001).
tests are typically used for data that do not conform to any We use Standard Ellipse Areas (SEAs) to analyse intergroup
given distribution or data sets that fail to meet the assumptions variance and to assess whether red deer and ibex were
of a parametric test (VanPool and Leonard, 2011), a situation foraging in different environments. Although biplots have been
common in isotopic analysis and which is indeed the case for a common way to present isotopic data and allow for
our samples. To analyse variance between samples within a visualisation of an animal's isotopic niche space, there are
group and between groups, we use a Kruskal–Wallis test and a some issues with them (see Layman et al., 2007). Biplots are
post hoc Mann–Whitney pairwise test with a Bonferroni susceptible to inaccuracies due to small sample sizes, which is
correction. P values of10 JOURNAL OF QUATERNARY SCIENCE
convex hull area has been used to describe the niche width of teeth, δ13C values range from −15.4 to −8.4‰ with a mean
an organism (Quevedo et al., 2009) or community (Layman ratio of −12.9‰. Ibex δ13C values had a smaller range, −13.5
et al. 2007). By incorporating Bayesian metrics into convex to −9.5‰, with a mean ratio of −11.6‰, and the δ13C values
hull area calculations, Jackson et al. (2011) overcame this from ibex teeth are slightly more elevated than those of red
sampling issue with SEAs. Overlap in the isotopic niche space deer. For red deer, δ13C values seem to fluctuate increasingly
of two taxa would indicate that they occupy similar isotopic through time as is visible in both the individual and aggregated
niches. Lack of overlap could be indicative of niche δ13C box plots while ibex samples show constant fluctuation of
partitioning; a phenomenon where two competing taxa are values (Figs. 5 and S4). The only statistically significant
driven to different patterns of resource use and/or niches by differences were observed in ibex samples. The variation of
natural selection (Hector and Hooper, 2002; Ma- δ13C values between groups was statistically significant
cArthur, 1958). If the red deer and ibex δ13C and δ18O results (H = 13.59, p = 0.003), and this seems to be driven by the
reflect deteriorating environmental conditions during certain JJ‐dark lens and JJ‐H2 samples (see Table 2). The SEAs
phases of occupation at Picareiro that would force these analysing variance between groups JJ‐H1, JJ‐dark lens and
ungulates to partition their niches, we would expect to see JJ‐H2 groups also support this pattern (Fig. S3).
considerable overlap in the isotopic niches of these two taxa, δ18O
as has been observed in similar studies in Iberia (Jones The δ18O values of both taxa range from −5 to 0.6‰, with a
et al., 2018, 2019, 2020). The parameters used in the mean value of −2.3‰ for all five groups. For red deer, δ18O
calculation of SEAs are available in Appendix C. All SEAs values range from −4.9 to 0.3‰ with a mean ratio of −2.3‰.
were completed using the statistical package SIBER in RStudio The δ18O composition of ibex teeth was very similar, with
(Jackson et al. 2011; RStudio Team, 2020). ranges from −5.0 to 0.6‰ and an identical mean ratio of
−2.3‰. Boxplots of δ18O ranges of individual red deer and
ibex teeth can be found in Fig. 6. The δ18O values obtained
Results from red deer M1/M2 display a similar pattern to the δ13C
values, where there is an increase in fluctuation over time
δ13C (Figs. 6 and S3). However, the M3 data do not show this
The δ13C values of both taxa range from −15.4 to ‐8.4‰ with pattern, potentially due to the smaller sample size. Meanwhile,
the mean ratio of −12.6‰ for all samples. For all red deer ibex δ18O values seem to decrease over time as is visible in
Figure 5. Boxplots showing ranges and standard deviations (whiskers) of δ13C values obtained from (A) individual red deer samples, (B) red deer
samples aggregated by group, (C) individual ibex samples, (D) ibex samples aggregated by group. Centre lines represent medians.
© 2021 The Authors. Journal of Quaternary Science Published by John Wiley & Sons Ltd. J. Quaternary Sci., Vol. 00(0) 1–20 (2021)NEANDERTHAL PALAEOECOLOGY IN W. PORTUGAL 11
Table 2. Results of the post hoc Mann–Whitney test with a mean δ13Cdiet values of individual red deer and ibex from
Bonferroni correction assessing intergroup variation in ibex samples. varying depths of the Picareiro sequence fall within the
Significant values (p ≤ 0.05) are in bold. isotopic range for temperate forests. The most enriched
JJ‐H1 JJ‐DARK JJ‐H2 JJ‐TOP
values (~24‰) are consistent with reconstructed δ13Cdiet
values obtained from herbivores living in an open‐canopy
JJ‐H1 0.04 1 1 environment while the most depleted signal (~−28‰) suggests
JJ‐DARK 0.04 0.02 1 that the canopy of local forests were not completely closed
JJ‐H2 1 0.02 0.5597 (Drucker et al., 2008). Variation in the isotopic data could be
JJ‐TOP 1 1 0.5597 reflecting changes in vegetation over time and not just
variation due to mobility. While δ13C values do not always
indicate evidence of environmental change and can instead
Figs. 6 and S4. No statistically significant differences were reflect differences in feeding behaviour, a shift in foraging
observed in δ18O values for either red deer or ibex. All raw areas, or a mixture of both (Faith 2018), in this instance we
data are available in Appendix B. argue that the changes observed in δ13C values over time at
Picareiro are influenced more heavily by environmental
change than diet or altitudinal mobility. In some instances,
the environmentally driven fluctuations in δ13C data are further
Discussion supported by offshore pollen data showing forest expansion
Because the mineralisation of different teeth happens at during vegetation records of Greenland Interstadial 14, a trend
different times in the first few years of an individual's life, that matches the depleted δ13C values for group JJ‐H1 (Fletcher
the time period recorded in each tooth (P vs M1 vs M2 vs M3) et al. 2010; Roucoux et al., 2015).
varies, and this has implications for the interpretation of The range of δ18O intratooth data for most red deer and all
isotopic data because different portions of different seasons ibex individuals suggests that they belong to local populations,
may be recorded in a tooth. This is evident, for example, in the because the ranges exceed 1‰, which is the observed range in
combined relatively large δ13C and δ18O ranges of the M1 and modern migrating caribou populations in North America
M2 of sample ZZ11‐1754 and M2 and M3 of ZZ11‐14, (Stevens et al., 2011). The exceptions are the ranges of four
demonstrating that one tooth may not show the full extent of red deer individuals in two sampling groups KK (n = 1) and JJ‐
the isotopic composition of their diet. In addition, in δ18O, dark lens (n = 3) which had ranges close to or less than 1‰. It
nursing has an enrichment effect (Roberts et al., 1998), mean- could be that these four red deer individuals travelled to
ing that nursing signals (elevated δ18O values) are observed different areas and were more mobile, or that incremental
most strongly in the M1, and to a lesser extent in the M2 sampling did not pick up on the full range of variation within a
(Stevens et al., 2011). This is evident when comparing the two tooth. Thus, it seems that a majority of the individuals sampled
teeth from ZZ11‐1754, where δ18O values are enriched in the here belonged to non‐migratory populations, meaning that this
M1 compared with the M2. That being said, Figs. 7A and 7B type of analysis functions at an appropriate scale for securely
are a scatterplot of ranges of δ18O and δ13C by tooth type and a linking climate change and human behaviour.
biplot of δ18O and δ13C by tooth type. In both of these plots, Without local baseline information and, in the case of
there seems to be no relationship between tooth type and the herbivores in particular, without information on the sources of
range of variation or δ18O and δ13C values. Still, we interpret δ18O, it is difficult to understand exactly how δ18O fractionates
δ18O data obtained from an M1 or M1/M2 with caution. in an ecosystem (Hamilton et al., 2018). For alpine species
such as ibex, differentiating climate and environmental
influences from dietary influences on δ18O is particularly
Do the δ13C and δ18O values of herbivore teeth difficult. However, some observations can be made. The
from Picareiro provide local palaeoenvironmental
altitude at which an individual is foraging greatly influences
information?
the values of δ18O recorded in their tissues (e.g. Hartman
The Picareiro δ13C results trend similarly to various cold and et al. 2015). Studies evaluating how the δ18O composition of
warm periods identified at the same depths in the magnetic water changes with altitude across Portugal suggests that for
susceptibility record of the site (Fig. 8). Generally, depletions every 100 m gained in elevation, a depletion of ~0.24‰
observed in the isotopic record (indicating an increase in occurs (Thatcher et al., 2020), which is less than values
forested canopies) are paralleled by increases in SI units in the observed elsewhere (~−1‰ for every 250–280 m or
magnetic susceptibility data (increase in precipitation) (Balsam ~0.35–0.4‰ for every 100 m) (e.g. Lachniet and Patter-
et al., 2011) and the opposite is also true. In depths son, 2009; Andreu et al., 2011; Hartman et al., 2015). The
corresponding to Greenland Stadial and Interstadial events elevation gradient for the area immediately surrounding
14 and 13 and Heinrich Event 5, the δ13C data fluctuate Picareiro is ~200–660 m, and if the ibex from Picareiro were
accordingly, with more enriched values during periods foraging in the immediate vicinity of the cave and altitude was
associated with drier, more open‐canopy environments and the main driver of the fluctuation in their δ18O values, we
less forest cover and more depleted values during periods of would expect to see a range of ~0.6‰, which is consistent
more humid, more closed‐canopy or forested environments with the differences in the interindividual mean ibex δ18O
(Fig. 8). However, similar trends in the magnetic susceptibility values, but not consistent with the range of all ibex δ18O
and isotope data were not observed in all instances (Greenland values for all groups (~5.6‰). For the group that contained
Stadial and Interstadial 12). It is possible that the tooth from the more than one ibex sample, JJ‐dark lens, the range of δ18O
depths corresponding to Greenland Stadial 12 belongs to an values was 4‰, meaning that environmental fluctuation did
individual that was alive during a pulse of slightly more have some influence on these values, suggesting that the ibex
forested conditions that does not temporally correspond with δ18O values could be slightly more indicative of environ-
the magnetic susceptibility data. While we are operating at the mental and/or climate change and less so for foraging location,
site‐based scale in our efforts to link human activity to climate at least for the JJ‐dark lens phase of occupation. The δ18O data
phases, these proxy records may not operate at the same scale for both taxa become enriched during drier phases and
throughout the entire sequence. Regardless, it is clear that the depleted in wetter phases, oscillating for the most part
© 2021 The Authors. Journal of Quaternary Science Published by John Wiley & Sons Ltd. J. Quaternary Sci., Vol. 00(0) 1–20 (2021)You can also read