National and subnational coverage and inequalities in reproductive, maternal, newborn, child, and sanitary health interventions in Ecuador: a ...
←
→
Page content transcription
If your browser does not render page correctly, please read the page content below
Rios Quituizaca et al. International Journal for Equity in Health             (2021) 20:48
https://doi.org/10.1186/s12939-020-01359-1

 RESEARCH                                                                                                                                           Open Access

National and subnational coverage and
inequalities in reproductive, maternal,
newborn, child, and sanitary health
interventions in Ecuador: a comparative
study between 1994 and 2012
Paulina Rios Quituizaca1,2* , Giovanna Gatica-Domínguez3 , Devaki Nambiar4 , Jair Licio Ferreira Santos2 ,
Stefan Brück5, Luis Vidaletti Ruas3 and Aluisio J.D. Barros3

  Abstract
  Background: Latin America (LA) has experienced constant economic and political crises that coincide with periods of greater
  inequality. Between 1996 and 2007 Ecuador went through one of the greatest political and socio-economic crises in Latin
  America, a product of neo-liberal economic growth strategies. Between 2007 and 2012 it regained political stability, promoted
  redistributive policies, and initiated greater social spending. To understand the possible influence on the political and economic
  context, we analyzed the coverage and inequalities in five Reproductive, Maternal, and Child Health (RMNCH) and two water
  and sanitation interventions using survey data from a broad time window (1994–2012), at a national and subnational level.
  Methods: The series cross-sectional study used data from four representative national health surveys (1994, 1999, 2004
  and 2012). Coverage of RMNCH and sanitary interventions were stratified by wealth quintiles (as a measure of the
  socio-economic level), urban-rural residence and the coverage for each province was mapped. Mean difference, Theil
  index and Variance-weighted least squares regression were calculated to indicate subnational and temporal changes.
  Results: From 1994 to 2004, Ecuador evidenced large inequalities whose reduction becomes more evident in 2012.
  Coverage in RMNCH health service-related interventions showed a rather unequal distribution among the socioeconomic
  status and across provinces in 1994 and 2004, compared to 2012. Sanitary interventions on the contrary, showed the
  most unequal interventions, and failed to improve or even worsened in several provinces. While there is a temporary
  improvement also at the subnational level, in 2012 several provinces maintain low levels of coverage.
  (Continued on next page)

* Correspondence: paulina.riosq@gmail.com
1
 Central University of Ecuador, Faculty of Medicine, Quito, Ecuador
2
 Riberao Preto Medical School, University of Sao Paulo. FMRP-USP, São Paulo,
Brazil
Full list of author information is available at the end of the article

                                        © The Author(s). 2021 Open Access This article is licensed under a Creative Commons Attribution 4.0 International License,
                                        which permits use, sharing, adaptation, distribution and reproduction in any medium or format, as long as you give
                                        appropriate credit to the original author(s) and the source, provide a link to the Creative Commons licence, and indicate if
                                        changes were made. The images or other third party material in this article are included in the article's Creative Commons
                                        licence, unless indicated otherwise in a credit line to the material. If material is not included in the article's Creative Commons
                                        licence and your intended use is not permitted by statutory regulation or exceeds the permitted use, you will need to obtain
                                        permission directly from the copyright holder. To view a copy of this licence, visit http://creativecommons.org/licenses/by/4.0/.
                                        The Creative Commons Public Domain Dedication waiver (http://creativecommons.org/publicdomain/zero/1.0/) applies to the
                                        data made available in this article, unless otherwise stated in a credit line to the data.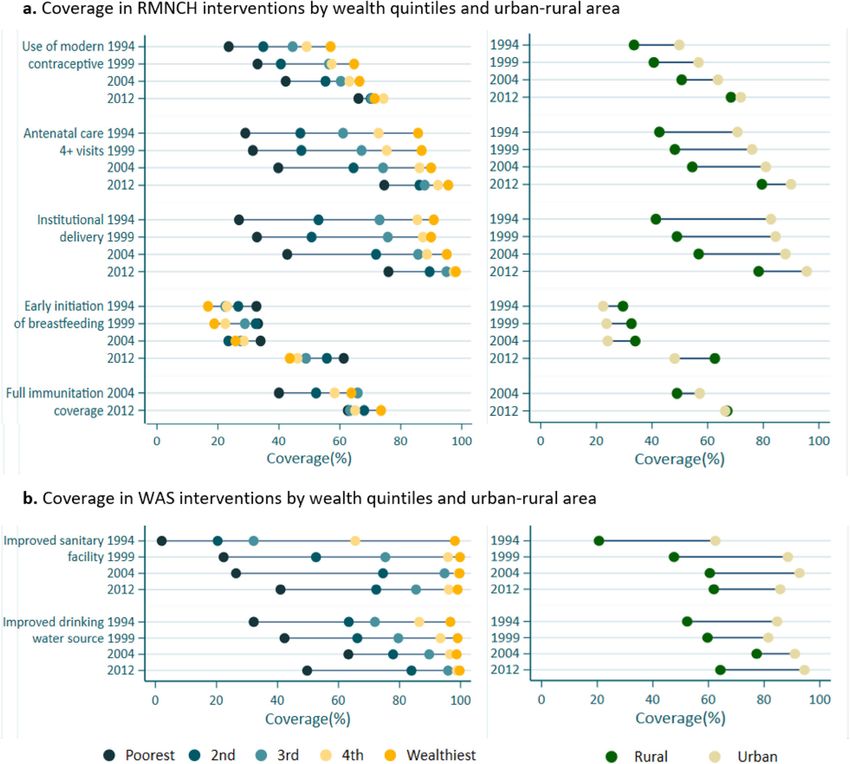
Rios Quituizaca et al. International Journal for Equity in Health   (2021) 20:48                                            Page 2 of 14

  (Continued from previous page)
  Conclusions: The remarkable reduction of inequalities in coverage of RMNCH interventions in 2012 clearly coincides with
  periods of regained political stability, promoted redistributive policies, and greater social spending, different from the
  former neo-liberal reforms which is consistent with observations made in other Latin American countries. Territorial
  heterogeneity and great inequalities specially related with sanitation interventions persists. It is necessary to obtain high
  quality information with sharper geographic desegregation that allows to identify and understand local changes over
  time. This would help to prioritize intervention strategies, introduce multisectoral policies and investments that support
  local governments.
  Keywords: Healthcare disparities, Maternal- child health services, Reproductive health services, Continuity of patient care,
  Socioeconomic factors, Health care surveys, Cross- sectional studies

Key messages:                                                              to be integrated, reducing costs, duplication, and ineffi-
                                                                           ciencies [12].
   In Ecuador, the reduction of inequality in health                         Ecuador is among those Latin American countries that
    service- related RMNCH interventions coincides                         endured a long period of political and socio-economic
    with periods of political stability, promoted                          crisis during the 1990s and 2000s. From 1996 to 2006,
    redistributive policies, and greater social spending,                  the country had a troubled economy and unstable gov-
    but inequalities in sanitation interventions remain                    ernance. This peaked with a hyperinflation in 2000,
    high.                                                                  followed by ‘dollarization’ and liberalization of fiscal pol-
   While there is a temporary improvement also at the                     icies [13–15]. Between 1998 and 2004, Ecuador’s modi-
    subnational level, in 2012 several provinces maintain                  fied Gini index increased from 49.7 to 53.9, the highest
    low levels of coverage, related to local determinants                  value ever seen in the country’s history; accompanied by
    that must be identified and analyzed to improve                        a consistent increase in out-of-pocket expenditure
    interventions in a fairer way.                                         through the year 2006 [13, 16, 17]. In 2004, access to
                                                                           health services was found to be constrained among people
                                                                           with low-income households, indigenous population and
Background                                                                 inhabitants of rural areas in comparison to higher income,
Inequality is a major global challenge, including in Latin                 non-indigenous and urban populations [18, 19].
America, which has experienced periods of dramatic de-                        During the subsequent period - 2006 to 2012- however,
cline in levels of social spending accompanied by eco-                     there were drastic changes in the country: the prevalence
nomic crises and political instability [1]. The widespread                 of poverty declined from 37.6 to 27.3%; the gross domestic
adoption of neo-liberal economic growth strategies has                     product (GDP) increased from 4.2 to 12.6% [16], and the
increased poverty and widened income inequalities in                       Gini index fell from 52.2 to 46.1. Total health expenditure
the provision of health services [2, 3]. In countries such                 as a percentage of GDP increased from 5.9 in 2006 to 9.2
as Ecuador, Bolivia, Argentina and Brazil, periods of                      in 2014 [17]; out-of-pocket expenses reduced significantly
greatest economic and political crisis coincide with                       [16] given a notable increase in public investment in
marked increases in inequality, as measured by the Gini                    health. As a result of these features, Ecuador rose from
Index [4, 5].                                                              the 111th rank in 2000 to the 13th in 2014 according to
  Initiatives like Countdown to 2015 and 2030 have                         the World Health Organization’s (WHO) Health Care Ef-
placed emphasis on Reproductive, Maternal, Neonatal                        ficiency (HCE) Index [20, 21].. Between 2006 and 2014 in-
and Child Health (RMNCH) interventions globally, rely-                     equalities in access to health services by socio-economic
ing on publicly available Demographic and Health Sur-                      status decreased [22].
veys. Over the past two decades, several Latin American                       Existing studies have compared health inequalities in
countries have reported increasing coverage of essential                   shorter periods of time [22–24], and there remains a
RMNCH interventions [6, 7]. To what extent larger eco-                     lack of scientific evidence about inequalities in interven-
nomic and political crises have impacted coverage has                      tion coverage that reflects the changing macroeconomic
been scarcely studied [8–10]. Moreover, the distribution                   and political contexts, particularly through analyses that
of coverage across population subgroups remains under-                     examine subnational level. Using data from four national
studied; and more needs to be done to identify under-                      health surveys in Ecuador, we describe inequalities in
served groups, and (re) allocate resources according to                    coverage of RMNCH and sanitary interventions during
varying needs [8, 11]. Further, based on how interven-                     and after periods of marked political, economic, and so-
tions are faring across population groups, they may need                   cial crisis, between 1994 to 2012.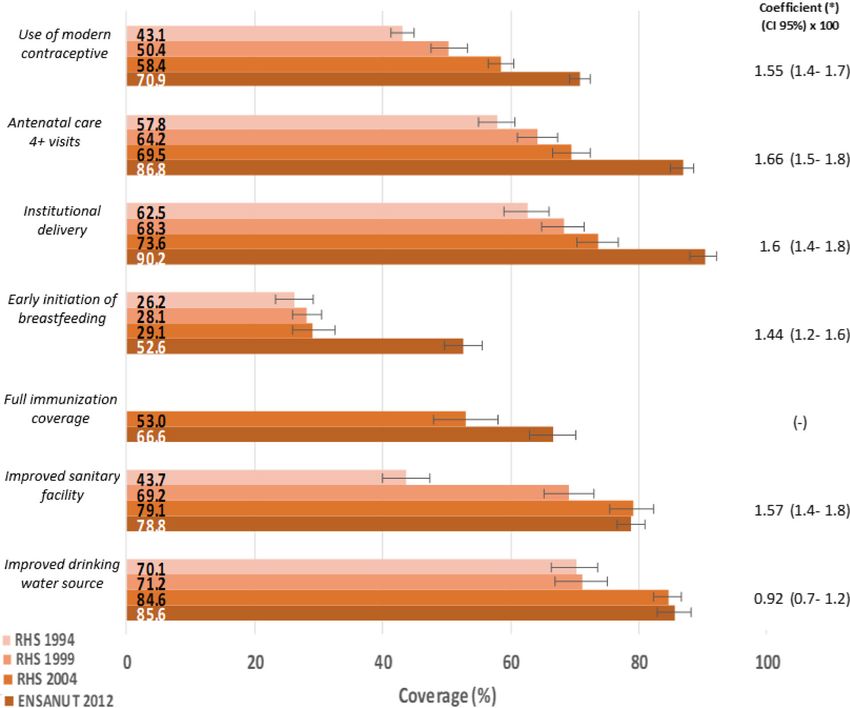
Rios Quituizaca et al. International Journal for Equity in Health   (2021) 20:48                                            Page 3 of 14

Materials and methods                                                      Low and Middle-Income Countries (LMICs) [7, 35–37].
Data sources and selection of indicators                                   Indicators on active assets of the selected households,
The present study is a series cross-sectional analysis                     materials used for housing construction and types of
using nationally representative surveys. For the years                     water and sanitation access facilities were analyzed using
1994, 1999 and 2004, we analyzed data from the Repro-                      Principal Component Analysis (PCA) to generate the
ductive Health Surveys (RHS), which provide data on                        wealth score for each household. Each individual was
women of childbearing age from 15 to 49 years (13,582;                     classified according to the total score of the family in
14,285 and 10,814, women for each survey respectively),                    which s/he resided and finally, the sample was classified
children under 3 and 5 years (8837; 8691 and 4184 chil-                    and divided into quintiles with the Quintile 1 (Q1)
dren for each survey respectively) and information on                      representing the 20 poorest percent and Quintile 5 (Q5)
household assets (14,084; 19,896 and 10,985 households                     representing the 20 wealthiest percent of households
for each survey respectively) [25–27]. The 2012 survey                     [36, 38]. The same methodology was applied for all four
included 18,213 women from 15 to 49 years; 19,949                          surveys. There were no marked demographic changes in
homes and 10,098 children under 5 years of age [28].                       the study period, which facilitated the interpretation of
More information is available in official reports which                    temporal trends [39].
are publicly available [29]. RHS was not available after                     We also disaggregated by place of residence (rural ver-
2004, so we relied on the national survey of health and                    sus urban) and geographic region, as has been done for
nutrition (ENSANUT) of 2012 [28], which had compar-                        inequality analysis in several countries [40]. Following
able indicators.                                                           the definitions used in prior work [41], we compared
  We selected intervention indicators that are consid-                     intervention coverage among the population living in
ered essential across the continuum of RMNCH care at                       urban areas (those living in populated centers with 2000
the community level [9] and used in global Sustainable                     or more inhabitants), to those living in rural areas (less
Development Goal (SDG) monitoring efforts, such as                         than 2000 inhabitants). The subnational desegregation
the Countdown to 2030 initiative [30, 31]. We further                      allows us to identify the sectors that achieved improve-
identified interventions related to access to safe water                   ments and learn from the implemented actions and suc-
and improved sanitation (WAS), which are established                       cessful experiences that can be replicated, as well as
in the existing literature as being highly complementary                   identify neglected subpopulations prioritizing interven-
to RMNCH, and are associated with great gains in                           tions in vulnerable sectors. The difference in the cover-
mother and child survival [32].                                            age between provinces for each year was considered in
  All indicators were operationalized based on standard-                   inequality analyses, as explained in the following section.
ized definitions of coverage of interventions [33] which
represent the proportion of individuals who access the                     Inequality analyses
intervention at the national level and by subgroups, with                  Change in overall coverage over time on a national level
their respective standard error; these indicators were                     We calculated and plotted coverage and standard errors
constructed in simple Microsoft Excel sheets from both                     for each intervention. We used variance-weighted least
surveys (RHS and ENSANUT) ensuring comparability                           squares regression to estimate the absolute annual
across datasets and time periods. The definitions of the                   change in intervention coverage [40].
indicators, their numerator and denominator are pre-                         For inequality analysis, we created equiplot graphs for
sented in the Supplementary annex 1.                                       the seven health interventions, showing the gap across
  Comparability of indicators over time is a well-known                    wealth quintiles and between urban- rural residence over
challenge in studies that use household surveys, due to dif-               time, as done in earlier studies [7, 8, 10]. The equiplot is
ferences in data collection and instrumentation [34, 35].                  a data visualization tool that allows us to see all of the
This study analyzes seven temporally comparable indica-                    indicators and their level of coverage at the same time,
tors in a representative sample while considering the dis-                 providing a visual indication of absolute inequality over
aggregation by population subgroups. Five were RMNCH                       time [37, 42]. An analysis of complex inequality mea-
indicators: Use of modern contraceptive, Antenatal care                    sures was carried out with data from the 2012 survey
(4+ visits), Institutional delivery, Early initiation of breast-           presented in the supplementary annex 2.
feeding, Full immunization; and two were Water and Sani-
tation (WAS) indicators: Improved sanitary facility,                       Change in coverage and inequalities over time by
Improved drinking water source.                                            subnational level
                                                                           We measured coverage of the five indicators across the
Dimensions of inequality                                                   four natural regions that make up Ecuador (Coast,
Socioeconomic status was assessed in this study using an                   mountain, Amazon and insular region). However, the
asset index, following the convention used in various                      Amazon region did not have a breakdown by province
Rios Quituizaca et al. International Journal for Equity in Health (2021) 20:48 Page 4 of 14
in 1994, so following the convention used in other studies (Fig. 2a). There was a remarkable difference in the re-
[25–28], we calculated the coverage and their respective duction of inequalities between the period 2004 to 2012.
standard error for each province for only 3 years 1999, Until 2004, a social gradient can be clearly observed,
2004 and 2012. Two summary measures were used: “mean with a change in 2012 towards a pattern of marginal ex-
difference from best” was an absolute measure for un- clusion where all but the poorest quintile have reached
ordered inequality dimensions that calculates the mean reasonable levels of coverage. An inverse pattern of in-
difference in relation to the best coverage for each indica- equality was observed in the coverage of early initiation
tor and year (the higher the value, the greater the differ- of breastfeeding such that the poorest quintile presented
ence). The second, the Theil index, is a relative summary greater coverage.
measure for unordered dimensions of inequality where The greatest inequality was observed in WAS inter-
“zero” may be interpreted as the absence of inequality and ventions. Over time the population of the poorest quin-
as the value becomes larger, inequality is greater [43]. tile maintained low levels of about 50% coverage in basic
We also measured the variation coverage over time services, indicating a wide gap compared to the richer
and information for the provinces over the four-year population. Even in 2012, where WAS interventions
survey periods was plotted to show the slope of change. show high level of national coverage, the disaggregation
Variance-weighted least squares regression was used to of information by wealth quintiles, demonstrates that
estimate the average of absolute annual change in the still around half of the poorest quintile lacked coverage.
prevalence of each intervention, which allows us to con- (Fig. 2b). We quantified these inequalities in RMNCH
sider the different time intervals between surveys (from and WAS interventions for 2012 data, where, rich people
1994 to 2012), and to test the statistical significance of had 2.4 times greater coverage in improved sanitary fa-
the observed trends [44]. The Moran Index was applied cilities than the poorest (see Supplementary annex 2).
to the values of the regression coefficient, which helps to Figure 2 further indicates greater differences in cover-
understand the degree to which one province spatially age in favor of the population residing in urban areas,
behaves similar to another (indicated by positive values), for all RMNCH interventions except for the breastfeed-
allowing the identification of autocorrelated patterns. ing intervention. Although coverage increased from
We used STATA (Stata corp.) version 15.0 for all ana- 1994 to 2004 for all health service-related interventions
lyzes, considering the design of the survey, such as sam- the breach between rural and urban coverage remained
pling, grouping and stratification weights. The program about the same, most notably for institutional delivery
R was used for plotting of the maps. which kept a difference of about 40%. These coverage
differences decreased by at least half in 2012. These ob-
Results served differences are even more accentuated consider-
Change in overall coverage over time ing WAS interventions. In Ecuador, there is a historical
Coverage of all the RMNCH interventions analyzed in the trend of poorer populations residing in rural areas [45],
present study tended to increase significantly over the which we sought to understand more granularly using
given period, and most drastically between 2004 and 2012 geographically disaggregated analyses.
at the national level (see Fig. 1). The coverage of health
service- related RMNCH interventions (use of modern Subnational inequalities in coverage over time
contraceptive, Institutional delivery, and antenatal care 4+ Disaggregated analysis by provinces allow us to explore
visits) showed the highest slope values, with coverage pro- whether changes in coverage were distributed equally
gressively increasing at a rate of roughly 1.5 to 1.6% each between provinces at three points of time. High absolute
year. The lowest coverage between 1994 and 2004 was of weight mean differences (Diff) were observed in the
early initiation of breastfeeding with notable improvement years 1999 and 2004. Institutional delivery was the inter-
between 2004 and 2012 (29.1 to 52.6%). In contrast, cover- vention with the greatest differences in the years 1999
age of interventions related to sanitation showed a dif- and 2004 (Diff 1999 = 31.6, Diff 2004 = 33.5, Diff 2012 =
ferent pattern, where improved sanitary facilities showed 13.6) with evident improvements in coverage in 2012.
an important progress from 43.7 to 69.2% between 1994 Coverage of health services related interventions in 1999
to 1999, but it did not show any progress between 2004 to and 2004 were more unequally distributed, with cover-
2012, while Improved drinking water source merely in- age becoming more equitable in 2012. The exception to
creased from 84.6% to 85.6 between 2004 to 2012. this, as above, was early initiation of breastfeeding (Diff
1999 = 15.6, Diff 2004 = 27.7, Diff 2012 = 24.2), with poor
Socio-economic and geographic inequalities in coverage coverage in the Ecuadorian coastal region. (see Fig. 3a).
over time In sanitation coverage the weighted mean difference by
The gaps of the coverage of RMNCH interventions for province decreased over time (Diff 1999 = 30.4, Diff
each socioeconomic stratifier decreased over time 2004 = 23.7, Diff 2012 = 16.8) (see Fig. 3b).Rios Quituizaca et al. International Journal for Equity in Health (2021) 20:48 Page 5 of 14 Fig. 1 Coverage of RMNCH and WAS interventions. Sources: National health survey 1994, 1999, 2004, 2012. (*) Annual coefficient of change in percentage points for selected RMNCH interventions. Ecuador 1994–2012. CI Confidence Interval. Sources: Ecuador RHS 1994, RHS 1999, RHS 2004, ENSANUT 2012 Average absolute annual change between all provinces observing the period from 2004 to 2012. Neither RMNC – measured using variance weighted least squares re- H nor sanitary interventions presented hereby significant gression - were positive and statistically significant in spatial autocorrelation applying Moran’s index. This most of the measured interventions. Despite the notable means that no regional patterns were identified, with ex- improvements in the coverage of RMNCH interventions ception of early initiation of breastfeeding, with low cover- in several provinces of the Amazon region, coverage age in almost all the coastal provinces of Ecuador (see trailed other regions throughout all measured time pe- Table 1 and details in supplementary annex 3 and 4). riods. In Sanitation interventions in contrast, most of the coefficient values were low and not significant, Discussion meaning that the improvements between 1994 to 1999 This is the first study in Ecuador that explored the coverage were not sustained and even suffered a reduction of and inequalities pertaining to seven essential RMNCH and coverage in a few provinces for these indicators sanitary interventions at national and sub-national levels in
Rios Quituizaca et al. International Journal for Equity in Health   (2021) 20:48                                                     Page 6 of 14

 Fig. 2 Coverage of intervention by Wealth quintiles and urban-rural area: 2a. RMNCH interventions 2b. WAS interventions. Sources: Ecuador RHS
 1994, RHS 1999, RHS 2004, ENSANUT 2012

the period 1994–2012. During the decade from 1994 to                       1990, Mexico 1995, Ecuador 2000, Bolivia and Argentina
2004 Ecuador had large inequalities, with a general ten-                   2002) [4] coincided with the largest increase in inequal-
dency towards a reduction in inequalities until 2012.                      ity (Gini Index) [5], all of which made it difficult to meet
  This is significant because Ecuador, like other coun-                    the objectives of the 2030 Sustainable Development
tries in Latin America, has endured economic crisis and                    Goals agenda [1]. Despite chronic political conflicts,
political instability through this period of time. Of all                  liberalization policies have been consistently pursued.
presidents democratically elected from 1970 to 2003 in                     Since 1982, most of the Latin American countries ap-
the region, 23% were forced to leave their positions be-                   plied structural adjustment policies, based on the guide-
fore the end of their terms and 40% faced challenges in                    lines of the “Washington Consensus”, including the
their tenure [4, 46]. In 2004, the percentage of poor in                   control of public spending and fiscal deficits [49]. Frus-
Latin America reached 46.9% [47], much higher than it                      tration over inequality has resulted in massive mobiliza-
was the case in 1990 [48]. The political and economic                      tions in the Latin American region in 2019. However,
instability in several Latin American countries (Brazil                    Ecuador joined the ranks of countries with apparent
Rios Quituizaca et al. International Journal for Equity in Health   (2021) 20:48                                                    Page 7 of 14

 Fig. 3 Differences between RMNCH and Sanitary interventions by provinces. Ecuador 1999–2012. (*) Absolute weighted mean difference (Diff) from
 best (percentage points). Sources: Ecuador RHS 1994, RHS 1999, RHS 2004, ENSANUT 2012

improvements in their average health indicators such as                    were not as evident as those between 2004 and 2012;
Chile and Colombia [47, 50].                                               which may be attributable to the prolonged period of
                                                                           political crisis faced between 1997 and 2006 as well as a
Inequalities in coverage over time - RMNCH interventions                   financial crisis in 1999 [13, 15, 51]. In 2002, Ecuador al-
on a national level                                                        located less than 5% of expenditure to public social
The reduction of inequities in health services related                     spending (average in the region 15%) [52] and in 2005 it
RMNCH interventions between the periods 1994–2004                          was one of the countries with the lowest public spending
Rios Quituizaca et al. International Journal for Equity in Health (2021) 20:48 Page 8 of 14
Table 1 Average annual absolute change in percentage points by province and selected intervention. Ecuador 1994–2012
Geographical Province A. Use of modern B. Antenatal care C. Institutional D. Early initiation of E. Improved
Regions contraceptive 4+ visits delivery breastfeeding sanitary facility
Cost Guayas 1.3* 1.5* 0.9* 1.2* 0.5*
Cost El Oro 1.3* 1.8* 1.2* 1.4* 1.4*
Cost Manabi 1.8* 2.2* 2.4* 0 1.5*
Cost Esmeraldas 2.0* 1.6* 2.3* 1.2* 1.2*
Cost Los Rios 2.1* 2.7* 1.8* 1.1* 1.8*
Mountain Pichincha 1.4* 1.1* 1.2* 1.5 0.1
Mountain Imbabura 1.7* 1.2* 1.3* 1.5* 0.9*
Mountain Carchi 1.9* 1.1* 1.0* 2.0* 0.4
Mountain Tungurahua 1.9* 1.9* 1.4* 2.2* 0.9*
Mountain Azuay 1.6* 2.1* 2.6* 1.9* 1.4*
Mountain Canar 1.7* 1.6* 2.0* 2.1* 2.1*
Mountain Bolivar 1.7* 2.2* 1.9* 2.4* 1.7*
Mountain Chimborazo 1.6* 1.6* 3.1* 3.0* 1.4*
Mountain Loja 1.7* 2.2* 2.3* 2.4* 1.9*
Mountain Cotopaxi 1.8* 2.2* 2.8* 2.3* 1.8*
Amazon Pastaza 1.2* 1.3* 1.7* 1.9 0.7
Amazon Sucumbios 2.6* 1.6* 2.6* 1.1* 0.9
Amazon Morona 2.6* 3.6* 3.7* 3.9* -1
santiago
Amazon Napo 2.6* 3.4* 2.7* 2.4* 1.8*
Amazon Orellana 0.5 2.6 5.5* 5.6* 0.2
Amazon Zamora 3.5* 4.0* 2.6* 3.7* 1.7*
Chinchipe
Insular Galapagos 1.1* 1.4* 0.3 1 −0.2*
ɫ
Moran Index - 0.047 −0.103 0.028 0.143 −0.036
(*) Statistically significant increase (positive values in percentage points) or decrease (negative values in percentage points) on coverage over time
(ɫ) Coefficient statistically significant in the Moran Index
on health (only 5.9% of GDP) [17]. The decade between right [55]. Various actions were taken which reinforced
1994 and 2004 was characterized by political instability the leadership of the Ministry of Public Health based on
[14], with a stagnation of the coverage of interventions primary health care [17, 20, 22, 56]. Improvements in
occurring despite reported financial investments in the provisioning of health infrastructure, equipment and in-
health sector [53]. However, programs like the Law on vestment in medicine [17, 57]; increase in health human
Free Maternity and Child Care from 1999 to 2004 were resources (the number of medical professionals per 10,
launched, and may have catalyzed improvements in pri- 000 inhabitants increased from 9.9 to 15.7 between 2008
mary healthcare services utilization and decreased neo- to 2012) [58]. The benefits of these shifts in priority and
natal mortality [54]. As these programs stabilized or investment appear to have had equity impacts: another
were enhanced in the following period, gains from such study found that the percentage of live births attended
interventions may have begun to emerge in the subse- by health personnel in rural areas (constant from 1990
quent period. to 2007), increasing 1.2 percentage points each year be-
Our results show that Ecuador remarkably reduced tween 2008 to 2016 [59].
RMNCH intervention inequalities between 2004 and The reduction in inequalities has been associated with
2012, which is consistent with other studies and indica- greater investment in education, more equitable social
tors that showed a reduction in inequalities in the use of spending, and the implementation of social policies that
health services after 2006 [22–24]. That could be related support vulnerable population subgroups [5, 60, 61]. It is
with the process of transformation of the health sector noted that the quality of governance measured by insti-
that started in 2007, reinforced by the Constitution of tutional capacity in the spending efficiency (bureaucracy,
2008 bolstering the protection of health as a human controls) for such reforms also plays a critical role [62].Rios Quituizaca et al. International Journal for Equity in Health (2021) 20:48 Page 9 of 14
The proportion of total expenditure on health as a shown significant improvement in sanitary facility cover-
proportion of GDP was 8.3% in 2014, increasing 2.8 per- age over time [80], it has not been equitable. For im-
centage points between the period 2007 and 2014 [63]. proved sanitary facilities, the greatest increase was from
Our analysis suggests that there may have been a posi- 1994 to 1999, likely attributable to the FASBASE project
tive and long-term influence of higher public spending [53] which started in 1992 to support projects of basic
on health coverage [64, 65] as has been observed in services and sanitation nationwide. Unfortunately, 1999
other Latin American countries [61]. This is in line with onwards, this intervention stagnated, with coverage re-
the established indirect relationship between public ducing by 2012 in many provinces, except for those
spending decline in the Gini index seen in the period whose local governments prioritized this intervention.
2004–2012 in several Latin American countries [60, 66, Interestingly, while coverage for the WAS indicators was
67]. Overall, the increase in the total health expenditure as 80% nationwide, it was only around 50% for the poorest
a percentage of GDP in Ecuador, together with other fac- quintiles, suggesting marginal exclusion. Other studies
tors such as economic growth, poverty reduction [17, 68], are consistent with these findings, since they show that
improved access to education [69] and reduced income in- Ecuador in 2015 was among the countries with relatively
equalities [70] may have contributed to this trend. lower degrees of concentrated poverty, but great in-
Early Initiation of breastfeeding in Ecuador nearly dou- equalities in access to drinking water and sanitation re-
bled between 2004 and 2012. This change may be attrib- gardless [81].
utable to the aforementioned spending, as well as a host According to the Constitution of the Republic of
of interventions specifically targeting breastfeeding, in- Ecuador, it is the responsibility of municipal govern-
cluding the “Baby friendly Hospital initiative” [71], the ments to provide the public with drinking water, sewer-
Law on Promotion, Support and Protection of Breast- age, sewage treatment, solid waste management and
feeding [72] and compliance with the international code environmental sanitation activities established by law
for the marketing of breast milk substitutes [73], rein- [55].. Health concerns are a shared responsibility be-
forced in 2009, whose interventions can rapidly improve tween the ministries of health and social areas, as well as
breastfeeding practices, when properly administered the municipal governments, given the direct impact on
[74]. This intervention favored the poorest and rural the health of the population, especially the most vulner-
populations, reflective of a global trend where more able. This analysis suggests that greater attention and
advantaged populations tend to have lower rates of intersectoral action is clearly needed to reduce geo-
breastfeeding coverage [7]. Regardless of these advances, graphic inequalities in drinking water and sanitation ac-
the national coverage in 2012 remained low (around cess [79] which has the potential to bring about lasting
50%) similar to countries like Peru or Bolivia [75].. and positive change for women, children, families and
Therefore, research and investment in this area should communities [32]..
be expanded. Overall, the achieved national average is not a suffi-
Despite the aforementioned overall improvements in cient indicator of the country’s progress in terms of
RMNCH intervention, coverage in 2012 was still low health. Intervention coverage distribution across popula-
compared to other countries such as Peru, Brazil and tion subgroups must be assessed to identify vulnerable
Colombia [76, 77], and inequality in favor of the wealthi- population and reduce inequality [8, 11]. Additionally,
est population subgroups persisted. Only the coverage lessons could be drawn from provinces with successful
use of modern contraceptive in 2012 was the interven- intervention outcomes over time, to see whether their
tion that achieved superior coverages compared to Peru, strategies are applicable to similar populations.
Mexico, Bolivia, Guatemala, Colombia and Argentina
[28, 78]; indicating a success in intervention strategies Inequalities in coverage interventions over time on a sub-
which should be further analyzed in future studies. national level
Although previous studies conducted with data from
Inequalities in coverage over time – WAS interventions 2004 and 2009 showed no difference in access to health
on a national level services by provinces [18, 23], the present study extends
Access to improved water sources and sanitation facil- the analysis to three different points in time, observing
ities also influence women’s and children’s health and that the differences between provinces in 1999 and 2004
their ability to receive essential interventions [79]. were greater compared to the differences observed in
Ecuador did not show improvements over time, in these 2012, that is, the coverage achieved at the national level
coverage indicators, despite the fact that the 2008 Con- in this year, were also distributed more equitably at the
stitution promulgated access to public services, educa- subnational level. This is consistent with previous stud-
tion, employment and healthy environments [55]. While ies that showed an improvement in coverage over time
Ecuador joins other countries in the region that have that has favored vulnerable areas [39].Rios Quituizaca et al. International Journal for Equity in Health (2021) 20:48 Page 10 of 14
Different inequality patterns where seen by geographic have occurred in a more current period, which should
regions. For instance, Pichincha the province in the be evaluated when more recent surveys are available.
mountain region that includes Quito, the capital of To achieve comparability throughout the four surveys,
Ecuador shows consistently high coverage compared to all indicators used in the present analyses have been
other mountain provinces with high degrees of poverty, standardized at the International Center for Equity in
such as Bolivar, Chimborazo and Cotopaxi. These prov- Health (ICEH; www.equidade.org).
inces share the lowest coverage of interventions due to a It was not possible to include more coverage indica-
number of characteristics like large percentage of rural tors, as information to calculate them was limited. In the
population, high rates of illiteracy, high total fertility full immunization coverage indicator, a change was re-
rates, and they also present the lowest rate of doctors corded in the vaccination schedule among those re-
per 10,000 inhabitants [58, 82]. In the Amazon region, ported by the 1999 survey and the 2004 survey, which
the greatest improvement in the coverage were observed limits comparability [27]. Moreover, the indicator im-
in the provinces that had low intervention coverage in proved drinking water source showed a change in the el-
1999 [82]. Most of the provinces of the Amazon region ements forming the indicator for 2012, but this did not
have low Gross Domestic Product (GDP) per capita [83], affect the result when it was compared with official re-
with large rural, indigenous, and relatively less educated ports [28]. However, in the breakdown by province, due
population groups [82], Despite this improvements, 2012 to the weakness in this indicator, we considered it better
coverage levels within this region remained compara- to disaggregate only the indicator Improved Sanitary Fa-
tively low. In fact between 1995 and 2006, a pronounced cilities which showed a similar behavior between prov-
increase in poverty and social inequality in rural house- inces and the same conclusion was reached. Finally, with
holds was observed in Paramos of the central highlands regard to the indicator on early initiation of breastfeed-
and the dispersed colonized areas of the Amazon [45]. ing, the survey of 2012 related questions were referring
This study did not identify significant regional patterns only to children younger than 24 months whereas in the
with exception of the breastfeeding intervention which is 2004 survey they were referring to children under 5 years
related with factors such as rurality and indigenous be- [28]. Therefore, these three indicators should be inter-
longing [84]. More consistent information – by ethnic preted with caution.
status and other proxies for social determinants together Inequality analysis by geography is not easy to measure
with a higher level of geographic disaggregation - is in national surveys, especially due to sampling problems
needed given that these factors prevail in smaller sub- that do not allow for a very fine geographic stratification
populations within provinces. This would allow for the [35]. For the first time we have analyzed intervention
identification of regional patterns across provincial bor- coverage of RMNCH geographically disaggregated by
derlines as province boundaries also mask internal provinces in the indicated time period. It must be noted,
inequalities. however, that most official survey reports suggest not
considering data of the Amazonian region disaggregated
Strengths and limitations of the study by provinces, due to the lack of statistically representa-
Adding to the literature on health inequalities in tive samples [25, 26], with exception of the last survey
Ecuador [22, 23, 85] the present study compares cover- 2012 [28]. It was also difficult to obtain high-quality in-
ages of RMNCH and WAS indicators using a broad formation in this region, which must also be interpreted
time-frame of analysis. Critically, data analysis was disag- with caution. We need solid evidence on subnational
gregated by subnational level using geographic informa- health inequalities and other social and cultural determi-
tion systems for mapping, which is especially important nants to improve the analysis.
for Ecuador, which has four socially and structurally dis- It was beyond the scope of this analysis to examine the
tinct regions. The present study can provide useful les- coverage of RMNCH interventions in indigenous popu-
sons to other countries on the effectiveness of lation using ethnicity as a dimension of inequality which
comprehensive analyzes with geographical and temporal is recommended by international organizations and
disaggregation. other studies [86, 87]. Analysis related to this sub-group
However, the reporting periods of data in this survey (which overlaps with those in the poorest quintiles, liv-
were not equidistant – i.e. between 1994, 1999 and 2004, ing in rural areas), is currently underway.
there was a gap of 5 years each, but between 2004 to
2012, the gap was 8 years. Such analyses could reveal Conclusions
clearer insights if the periodicity of surveys were fixed. Ecuador is a country that has endured economic and
Nevertheless, available information provides a reasonable political crises, and yet has achieved progress in both
basis for the present analysis. This study analyzes data RMNCH coverage of interventions, as well as reducing
up to the year 2012, but it is possible that other changes inequalities between 1994 and 2012. In 2012 inequalitiesRios Quituizaca et al. International Journal for Equity in Health (2021) 20:48 Page 11 of 14
in RMNCH health service-related interventions show scholarships that include work permission, tickets and stay. The Central
a more marked reduction, compared to the previous University of Ecuador awarded a grant for the preparation of the project.
decade (1994–2004). These reductions in inequality
Availability of data and materials
coincided with regained political stability, the promotion All data used in this study are available in the repository of the World Bank
of redistributive policies, and greater social spending, database (surveys of the years 1994, 1999 and 2004) link: http://microdata.
different from the neo-liberal reforms that had been worldbank.org/index.php/catalog/?country[]=ecuador; and survey of 2012 in
the National Institute of Statistics and Censuses of Ecuador (INEC), https://
applied for more than 20 years before. These changes www.ecuadorencifras.gob.ec/encuesta-nacional-de-salud-salud-reproductiva-
together with other factors such as improvements in y-nutricion-ensanut-2012/, which have no restrictions to its use by non-
economic conditions and reduction of poverty may have academics.
had an important positive impact on health inequality. In
Ethics approval and consent to participate
contrast, inequalities in coverage of basic sanitation and The institutions that carried out the surveys provided the corresponding
drinking water remained high. Notwithstanding improve- ethical approvals. More information is available in official reports, which are
ment at the subnational level, geographic inequality publicly available in official page of INEC and World Bank database [29].
persists in Ecuador and warrants further study. Policy and
Consent for publication
research attention should also turn to understanding and Not applicable.
acting on the nature and causes of these inequalities so
that Ecuador may join other countries on the UHC path Competing interests
of “leaving no one behind” [88]. The authors declare that they have no competing interests.
Author details
1
Supplementary Information Central University of Ecuador, Faculty of Medicine, Quito, Ecuador. 2Riberao
The online version contains supplementary material available at https://doi. Preto Medical School, University of Sao Paulo. FMRP-USP, São Paulo, Brazil.
3
org/10.1186/s12939-020-01359-1. International Center for Equity in Health, Universidade Federal de Pelotas,
Pelotas, Brazil. 4The George Institute for Global Health, Delhi, India. 5Central
University of Ecuador, Faculty of Biological Sciences, Quito, Ecuador.
Additional file 1.
Received: 14 March 2020 Accepted: 16 December 2020
Abbreviations
RMNCH: Interventions reproductive, maternal neonatal and children;
WAS: Interventions of drinking water sources and improve sanitary facilities; References
ENSANUT: Encuesta nacional de salud y nutrición; RHS: Reproductive health 1. Caribe CE para AL y el. Panorama Social de América Latina 2019 [Internet].
survey; SII: Slope index of inequality; CIX: Concentration index; LMGAI: Ley de CEPAL; 2019 [citado 6 de septiembre de 2020]. Disponible en: https://www.
maternidad gratuita y atención a la infancia; INEC: Instituto nacional de cepal.org/es/publicaciones/44969-panorama-social-america-latina-2019.
estadísticas y censos; WHO: World health Organization; PAHO: Panamerican 2. Dahlgren G, Whitehead M. European strategies for tackling social inequities
health Organization in health: Levelling up Part 2. World Health Organ Reg Off Eur. 20:149.
3. Göttems LBD, de LR MM, LBD G, de LR MM. Neoliberalism in Latin America:
Acknowledgements effects on health system reforms. Rev Saúde Pública. 2020;54:74. [citado 13
The study team would like to gratefully thank the following individuals and de octubre de 2020] Disponible en: http://www.scielo.br/scielo.php?script=
organizations for their support throughout this activity: University of Sao sci_abstract&pid=S0034-89102020000100508&lng=en&nrm=iso&tlng=en.
Paulo, School of Medicine of Ribeirão Preto (FMRP-UPS), to the team of 4. Coelho A. Inestabilidad política y caídas presidenciales en Sudamérica:
teachers of the Doctorate program in Public Health, especially Dr. Jair causas y consecuencias. Política. 2012;50(1):167–94.
Ferreira Santos. The International Center for Equity in Health, Pelotas- Brazil, 5. Andrea CG. Inequality Trends and their Determinants: Latin America over
for the support of the team of researchers, especially Dr. Aluísio J.D. Barros, 1990–2010. Res Gate. 2012:1–46. [citado 8 de septiembre de 2020];
mentor of the project and Dr. Cesar Victora, whose program supports the Disponible en: https://www.researchgate.net/publication/254417127_
training of professionals from countries of Latin America in measuring Inequality_Trends_and_their_Determinants_Latin_America_over_1990-2010.
inequalities. The Central University of Ecuador, Faculty of Medical Sciences, 6. Victora CG, Requejo JH, Barros AJD, Berman P, Bhutta Z, Boerma T, et al.
whose doctoral program finances the training of university teachers. Health Countdown to 2015: a decade of tracking progress for maternal, newborn,
System Global, through the initiative “Publication Mentorship for the first- and child survival. Lancet. 2016;387(10032):2049–59.
time Women authors.” 7. Restrepo-Méndez MC, Barros AJD, Requejo J, Durán P, Serpa LA, GVA F.
Progress in reducing inequalities in reproductive, maternal, newborn, and
Authors’ contributions child health in Latin America and the Caribbean: an unfinished agenda.
PR processed and performed the data analyzes and drafted the manuscript. PAHOWHO Institutional Repos. 2015;38:9–16. [citado 6 de junio de 2018];
GG corrected the national survey databases, analyzed the data obtained and Disponible en: http://iris.paho.org/xmlui/handle/123456789/10003.
contributed to the writing of the manuscript. SB was one of the main 8. PAHO/WHO. Manual para el Monitoreo de las Desigualdades en Salud, con
contributors in writing the manuscript, especially in the scientific discussion. especial énfasis en países de ingresos medianos y bajos [Internet]. In:
DN contributed to the general revision of the final manuscript and Biblioteca sede de la OPS. Washington D.C.: Organización Panamericana de
reorganized the main ideas. JFS assisted in data analysis and writing the la Salud; 2016. citado 14 de noviembre de 2016]. Disponible en: http://
manuscript. LV contributed to the structuring of tables and graphs and their www.paho.org/hq/index.php?option=com_content&view=article&id=125
interpretation. AB was the mentor of the study, because of his extensive 71%3Amanual-monitoreo-desigualdadessalud-paises-ingresos-medianos-
experience in the topic of health inequalities he contributed to the review of bajos&catid=8896%3Apublications&Itemid=42134&lang=es.
data, analysis and structuring of main ideas. All authors read and approved 9. Keats EC, Ngugi A, Macharia W, Akseer N, Khaemba EN, Bhatti Z, et al.
the final manuscript. Progress and priorities for reproductive, maternal, newborn, and child
health in Kenya: a Countdown to 2015 country case study. Lancet Glob
Funding Health. 2017;5(8):e782–95.
The Central University of Ecuador, Faculty of Medical Sciences, doctoral 10. França GVA, Restrepo-Méndez MC, Maia MFS, Victora CG, Barros AJD.
program finances the training of university teachers, through granting Coverage and equity in reproductive and maternal health interventions inRios Quituizaca et al. International Journal for Equity in Health (2021) 20:48 Page 12 of 14
Brazil: impressive progress following the implementation of the Unified 30. Bryce J, Victora CG, Boerma T, Peters DH, Black RE. Evaluating the scale-up
Health System. Int J Equity Health. 2016;15(1):149. for maternal and child survival: a common framework. Intern Health. 2011;
11. WHO. Subsanar las desigualdades en una generación. Comisión sobre 3(3):139–46. PMID: 24038362. https://doi.org/10.1016/j.inhe.2011.04.003..
Determinantes sociales de la salud - Informe Final [Internet]. Ginebra: OMS; 31. World Health Organization. Monitoring and evaluation of health systems
2008. [citado 4 de mayo de 2019]. Report No.: Informe final. Disponible en: strengthening: An operational framework [Internet]. Geneva: World Health
https://www.who.int/social_determinants/thecommission/finalreport/es/. Organization; 2009. [citado 23 de septiembre de 2020]. Disponible en:
12. WHO. Essential Interventions, Commodities and Guidelines for Reproductive, https://www.who.int/healthinfo/HSS_MandE_framework_Nov_2009.pdf.
Maternal, Newborn and Child Health. Geneva, Switzerland: PMNCH de 2011 32. Theiss- Nyland K. Knowledge Summary 30: Water, sanitation and hygiene -
[citado 21 de mayo de 2019]; Disponible en: https://www.who.int/pmnch/ the impact on reproductive, maternal, newborn and child health. The
topics/part_publications/essential_interventions_18_01_2012.pdf. Partnership for Maternal, Newborn and Child Health. 2014:1–4. [citado 2 de
13. Beckerman P, Maldonado F, Solimano A. Crisis y Dolarización en el Ecuador octubre de 2020]. Disponible en: https://www.who.int/pmnch/knowledge/
[Internet]. The World Bank, 1818 H Street, NW, Washington, O.e.20433, USA: publications/summaries/ks30/en/.
Copyright; 2002. Disponible en: http://documents.worldbank.org/curated/ 33. Indicators & Stratifiers [Internet]. www.equidade.org. International center for
en/508021468248977231/pdf/245560SPANISH017814313461501PUBLIC1.pdf. Equity in Health. 2020 [citado 11 abril 2019]. Disponible en: https://www.
14. Ministerio de Relaciones Exteriores Ecuador. Cronologia de Presidentes del equidade.org/indicators.
Ecuador [Internet]. Political Database of the Americas. 2009 [citado 9 de 34. Flenady V, Wojcieszek AM, Fjeldheim I, Friberg IK, Nankabirwa V, Jani JV,
mayo de 2019]. Disponible en: http://pdba.georgetown.edu/Executive/ et al. eRegistries: indicators for the WHO Essential Interventions for
Ecuador/pres.html. reproductive, maternal, newborn and child health. BMC Pregnancy
15. Salgado Wilma. Desencadenantes y beneficiarios de la crisis económica en Childbirth. 2016;16:293. [citado 8 de septiembre de 2020]. Disponible en:
el Ecuador. 1999 [citado 9 de mayo de 2019]; Disponible en: http://www. https://www.ncbi.nlm.nih.gov/pmc/articles/PMC5045645/.
pucesi.edu.ec/webs/wp-content/uploads/2018/03/Salgado-W.- 35. Victora C, Boerma T, Requejo J, Mesenburg MA, Joseph G, Costa JC, et al.
Desencadenantes-y-Beneficiarios-de-la-Crisis-Econ%C3%B3mica-en-el- Analyses of inequalities in RMNCH: rising to the challenge of the SDGs. BMJ
Ecuador..pdf. Glob Health. 2019;4(Suppl 4):e001295.
16. World Bank national accounts data, OECD national accounts data files. 36. Gwatkin DR, Rutstein S, Johnson K, Suliman E, Wagstaff A, Amouzou A.
Ecuador. Data- World Bank. Global Poverty Working Group [Internet]. 2019 Socio-economic differences in health, nutrition, and population within
[citado 13 de junio de 2019]. Disponible en: https://data.worldbank.org/ developing countries: an overview. Niger J Clin Pract. 2007;10(4):272–82.
country/ecuador. 37. Barros AJD, Victora CG. Measuring coverage in MNCH: determining and
17. Miguel MS, Nicolás MC. Reforma de salud en Ecuador: nunca más el interpreting inequalities in coverage of maternal, newborn, and child health
derecho a la salud como un privilegio. Scielo Peru. 2014;31(4):754–61. interventions. PLOS Med. 2013;10(5):e1001390.
18. López-Cevallos DF, Chi C. Assessing the context of health care utilization in 38. The DHS Program - Wealth Index Construction [Internet]. www.dhsprogram.
Ecuador: a spatial and multilevel analysis. BMC Health Serv Res. 2010;10:64. com. The DHS Program Demographic and Health Surveys. USAID. [citado 13
19. López-Cevallos D, Chi C, Ortega F. Equity-based considerations for de mayo de 2019]. Disponible en: https://www.dhsprogram.com/topics/
transforming the Ecuadorian health system. Rev Salud Publica Bogota wealth-index/Wealth-Index-Construction.cfm.
Colomb. 2014;16(3):347–59. 39. Subsecretaria de habitat y asentamientos humanos SHAH. Ministerio de
20. Aldulaimi S, Mora FE. A primary care system to improve health care Desarrollo Urbano y Vivienda (MIDUVI). Tercera Conferencia de las Naciones
efficiency: lessons from Ecuador. J Am Board Fam Med. 2017;30(3):380–3. Unidas sobre la vivienda y el desarrollo urbano sostenible. Habitat III.
21. Chloe Whiteaker, International Monetary Fund, World Health Organization, National Report Ecuador. [Internet]. Quito- Ecuador; 2015 [citado 14 de
World Bank. Most Efficient Health Care Around the World [Internet]. septiembre de 2020]. Disponible en: http://habitat3.org/wp-content/
Bloomberg.com. 2014 [citado 11 de enero de 2020]. Disponible en: https:// uploads/National-Report-Ecuador-spanish.pdf.
www.bloomberg.com/graphics/infographics/most-efficient-health-care- 40. Victora CG, Barros AJD, França GVA, da Silva IC, Carvajal-Velez L, Amouzou A.
around-the-world.html. The contribution of poor and rural populations to national trends in
22. Granda ML, Jiménez WG. The evolution of socioeconomic health reproductive, maternal, newborn, and child health coverage: analyses of
inequalities in Ecuador during a public health system reform (2006–2014). cross-sectional surveys from 64 countries. Lancet Glob Health. 2017;5(4.
Int J Equity Health. 2019;18:31. [citado 5 de junio de 2019]. Disponible en: 41. Andina C. Secretaria General. Seminario Censo 2000 de Población y
https://www.ncbi.nlm.nih.gov/pmc/articles/PMC6368770/. Vivienda de los países Andinos. Informe final [Internet]. Lima- Perú:
23. Gutiérrez JP, Leyva Flores R, Aracena GB. Social inequality in sexual and Secretaria General; 2000. [citado 1 de septiembre de 2020]. Report No.: SG
reproductive health in Ecuador: an analysis of gaps by levels of provincial /SEM.CPV-2000/Informe Fin. Disponible en: https://www.mpl.ird.fr/crea/pdf/
poverty 2009–2015. Int J Equity Health. 2019;18(1):49. Semcenso2000.pdf.
24. Quizhpe E, Sebastian MS, Teran E, Pulkki-Brännström A-M. Socioeconomic 42. Equiplot [Internet]. www.equidade.org. International center for Equity in
inequalities in women’s access to health care: has Ecuadorian health reform Health. 2020. [citado 18 de junio de 2019]. Disponible en: http://www.
been successful? Int J Equity Health. 2020;19(1):178. equidade.org/equiplot.
25. ENDEMAIN. Ecuador - Encuesta de Salud Materna e Infantil 1994 (ENDEMA 43. Hosseinpoor AR, Bergen N, Barros AJD, Wong KLM, Boerma T, Victora CG.
IN 1994) | Data Catalog [Internet]. The World Bank- Data Catalog. 1994 Monitoring subnational regional inequalities in health: measurement
[citado 11 de mayo de 2019]. Disponible en: https://datacatalog.worldbank. approaches and challenges. Int J Equity Health. 2016;15(1):18.
org/dataset/ecuador-encuesta-de-salud-materna-e-infantil-1994. 44. Flores-Quispe M, Restrepo-Méndez MC, Maia MFS, et al. Trends in
26. ENDEMAIN. Ecuador - Encuesta Demográfica y de Salud Materna e Infantil socioeconomic inequalities in stunting prevalence in Latin America and the
1999 (ENDEMAIN 1999) | Data Catalog [Internet]. The World Bank- Data Caribbean countries: differences between quintiles and deciles. Int J Equity
Catalog. 1999 [citado 12 de mayo de 2019]. Disponible en: https:// Health. 2019;18:156. https://doi.org/10.1186/s12939-019-1046-7.
datacatalog.worldbank.org/dataset/ecuador-encuesta-demogr%C3%A1fica-y- 45. Carlos L, Ana L, Renato L, Wladymir W. Mapas de pobreza, consumo por
de-salud-materna-e-infantil-1999. habitante y desigualdad social en el Ecuador : 1995–2006; metodología y
27. ENDEMAIN. Ecuador - Encuesta Demográfica y de Salud Materna e Infantil resultados. ResearchGate. 2008; [citado 9 de septiembre de 2020];
2004 [Internet]. The World Bank- Data Catalog. 2004 [citado 12 de mayo de Disponible en: https://www.researchgate.net/publication/277072521_
2019]. Disponible en: http://microdata.worldbank.org/index.php/catalog/979. Mapas_de_pobreza_consumo_por_habitante_y_desigualdad_social_en_el_
28. Freire WB, Belmont P, Ramírez-Luzuriaga MJ, Mendieta MJ, Silva-Jaramillo Ecuador_1995_-_2006_metodologia_y_resultados.
MK, Monge R, et al. Encuesta Nacional de Salud y Nutrición – ENSANUT – 46. Hochstetler K. Repensando o presidencialismo: contestações e quedas de
Ministerio de Salud Pública- Tomo II [Internet]. Quito- Ecuador: INEC; 2014. presidentes na América do Sul. Lua Nova Rev Cult E Política. 2007;72:09–46.
[citado 12 de mayo de 2019]. Disponible en: https://www.salud.gob.ec/ 47. Shifter M. La rebelión contra las élites en América Latina. The New York Times
encuesta-nacional-de-salud-y-nutricion-ensanut/. [Internet]. 2020 [citado 14 de septiembre de 2020]; Disponible en: https://
29. The World Bank. Central Microdata Catalog [Internet]. Microdata library. www.nytimes.com/es/2020/01/22/espanol/opinion/elites-america-latina.html.
2019 [citado 10 de mayo de 2019]. Disponible en: http://microdata. 48. Comisión Económica para América Latina y el Caribe (NU. CEPAL).
worldbank.org/index.php/catalog/?country[]=ecuador. Panorama Social de América Latina Santiago de Chile 2004. InformesYou can also read