NASA GLOBE Clouds: Documentation on How Satellite Data is Collocated to Ground Cloud Observations - Version 1.2 Last updated: March 31, 2022
←
→
Page content transcription
If your browser does not render page correctly, please read the page content below
NASA GLOBE Clouds:
Documentation on How Satellite Data is
    Collocated to Ground Cloud
           Observations

                    Version 1.2

            Last updated: March 31, 2022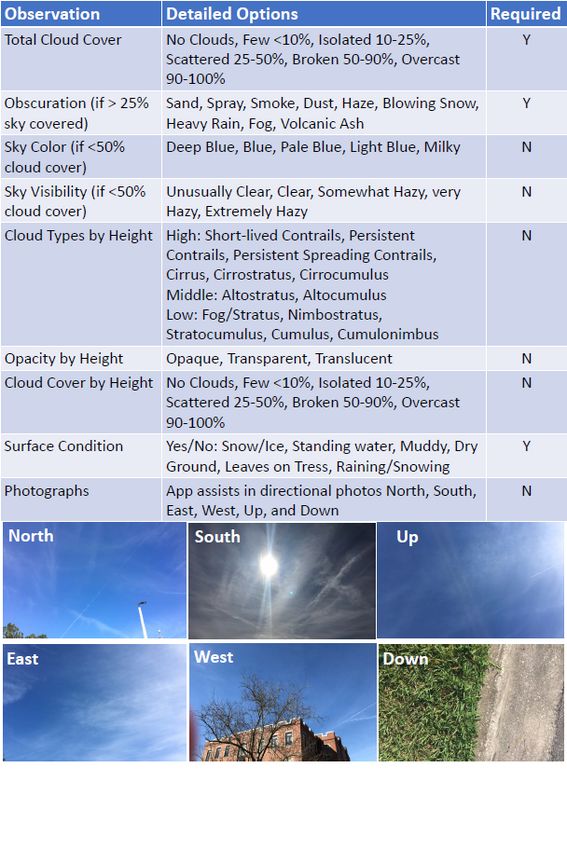
Citation:
Colón Robles, M., T. Rogerson, and K. Ivey, 2022: NASA GLOBE Clouds:
Documentation on How Satellite Data is Collocated to Ground Cloud Observations
(v1.2), Accessed Date,
https://www.globe.gov/web/s-cool/home/satellite-comparison.

Contributors (in alphabetical order):
Dr. Helen Amos
Mr. Kristopher Bedka
Dr. Lin Chambers
Dr. J. Brant Dodson
Mr. Parnchai K. Sawaengphokhai
Mr. Douglas Spangenberg
Mr. Jason Tackett
Mrs. Jessica Taylor

                                                                                 1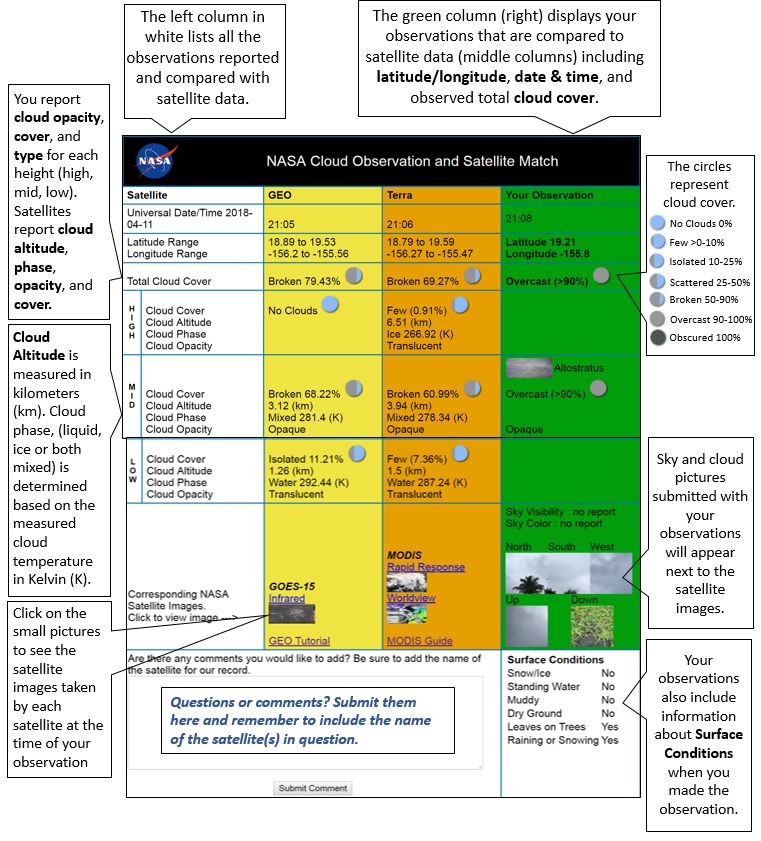
Table of Contents
Abbreviations                                                3
Abstract                                                     3
Background                                                   3
  Description of GLOBE participants                          4
  Description of Ground Observations                         4
Collocation of Ground Observations with Satellite Data       6
Modernization of Code for Aqua and Terra Satellite Matches   6
  Overview                                                   6
  Technical Changes                                          7
  Footprint Definition                                       9
    1.     Geostationary Satellites                          9
    2.     Aqua and Terra                                    10
    3.     CALIPSO                                           11
  Reconciling GLOBE and Satellite Classifications            13
    Altitude                                                 13
    Opacity                                                  13
    Cloud Cover                                              14
    Cloud Phase and Temperature                              14
GLOBE Clouds and Matched Satellite Data Available            14
Useful Links                                                 15
References                                                   15
List of Research Using NASA GLOBE Clouds                     16

                                                              2
Abbreviations
CALIPSO Cloud-Aerosol Lidar and Infrared Pathfinder Satellite Observation,
https://www-calipso.larc.nasa.gov/
CERES Clouds and the Earth’s Radiant Energy System, https://ceres.larc.nasa.gov/
GLOBE Global Learning and Observations to Benefit the Environment,
https://www.globe.gov
GOES Geostationary Operational Environmental Satellite,
https://www.goes.noaa.gov/
FLASHFlux Fast Longwave and Shortwave Flux,
https://ceres.larc.nasa.gov/data/#flashflux-ssf-level-2
S’COOL Students’ Cloud Observations On-Line, https://scool.larc.nasa.gov
SatCORPS Satellite ClOud and Radiation Property retrieval System,
https://satcorps.larc.nasa.gov/
Abstract
The NASA GLOBE Clouds team at NASA Langley Research Center in Hampton, Virginia, USA
receives all cloud observations submitted through the GLOBE (Global Learning and
Observations to Benefit the Environment) Program. Cloud observations submitted through
various protocols and methods, including the GLOBE Observer mobile app, are then collocated
with satellite data from various Earth-observing platforms, a process referred to as a satellite
match. This document is a guide to how the ground-satellite collocation or satellite match is
done by the team. A full description of The GLOBE Program’s dataset can be found in the
GLOBE Data Users Guide (https://www.globe.gov/globe-data/globe-data-user-guide).
Background
Ground-satellite collocation, or satellite matching of cloud observations, started in 2016 for
GLOBE participants when the S’COOL (Students’ Cloud Observations On-Line) Project merged
with GLOBE and became NASA GLOBE Clouds. The S’COOL Project (Chambers et al., 2003
and 2017) collected cloud observations from students, teachers, and the general public and
sent a personalized email to each participant whenever there was a ground-satellite collocation
of cloud observations to report.
The NASA GLOBE Clouds team matches GLOBE cloud observations to corresponding satellite
data (https://www.globe.gov/web/s-cool). GLOBE participants can “opt in” to receive
notifications on their mobile device about polar orbiting satellite flyovers or check online (see
satellite overpass schedule tool). If an observer’s cloud observation is matched to satellite data,
3and the user opted-in to receive emails from GLOBE, the user will receive a Satellite Match
Table for every collocation (see satellite match table example) in a personalized email from
NASA within one week of submitting their observation. The NASA GLOBE Clouds team uses an
application programming interface or API specific for the team to pull cloud observations daily
from The GLOBE Program’s database. The cloud observations can then be matched to multiple
geostationary satellites, CERES instruments onboard Aqua and Terra, and CALIPSO. The
satellite match table includes images from these satellites centered on the observation location.
Description of GLOBE participants
Individuals contributing cloud observations need to be in a GLOBE country (see map of
participating countries, https://www.globe.gov/globe-community/community-map). These
individuals fall into two groups: those that have received formal GLOBE protocol training, and
those that are trained via the tutorials supplied with the GLOBE Observer app. Users that
receive formal training are often classroom educators who want to teach their students the
protocols (i.e., methods) to collect and enter data for GLOBE’s additional protocols (i.e., beyond
what is available in the GLOBE Observer app.) Users that have received formal training can
enter data through other mechanisms in addition to the GLOBE Observer mobile app, including
data entry desktop forms, GLOBE’s Data Entry mobile app, and email data entry. GLOBE
Observer mobile app users need only view the tutorials supplied within the app before
submitting data. Detailed steps for the clouds protocol can be found on the NASA GLOBE
Clouds webpage (https://www.globe.gov/web/s-cool/home/observation-and-reporting).
Description of Ground Observations
Each GLOBE cloud observation contains information about the percent of sky covered by
clouds, the presence of obscurations, and surface conditions (e.g., snow or ice on the ground).
An obscuration occurs when more than 25% of the sky is obscured by either sand, smoke,
haze, heavy snow, fog, spray, dust, blowing snow, heavy rain, or volcanic ash, preventing the
user from seeing the sky or clouds. Optional fields for cloud observations are: sky color
(https://www.globe.gov/web/s-cool/home/observation-and-reporting/sky-color); sky visibility
(https://www.globe.gov/web/s-cool/home/observation-and-reporting/sky-visibility); presence of
low-, mid-, and high-level clouds and contrails; types of clouds and contrails
(https://www.globe.gov/web/s-cool/home/observation-and-reporting/cloud-type); and opacity
(https://www.globe.gov/web/s-cool/home/observation-and-reporting/cloud-visual-opacity; see
Table 1).
Users are encouraged to conduct their observations in an outdoor area with a relatively
unobstructed view of the sky. Users have the option to take photographs of the sky (north,
south, east, west, up) and surface conditions (down). The GLOBE Observer mobile app guides
users to align their smartphone camera in the correct direction and tilted to a 14 degree angle,
then automatically takes the photographs
(https://www.globe.gov/web/s-cool/home/observation-and-reporting/globe-observer-tips-and-
tricks). Table 1 shows the required and optional fields for both GLOBE-trained participants and
4GLOBE Observer users. Data submitted via email cannot include images (see
https://www.globe.gov/globe-data/data-entry).
Table 1. Required and optional fields in GLOBE Clouds
5Collocation of Ground Observations with Satellite
Data
The NASA GLOBE Clouds team collocates submitted observations multiple geostationary
satellites, CERES instruments onboard Aqua and Terra, and CALIPSO. This process is referred
to as a satellite match. A satellite match table is produced that summarizes collocation results.
The table is then sent in a personalized email to the ground observer (see Image 1).
Cloud properties such as height and coverage are generally not directly measured by satellites,
with the partial exception of CALIPSO. The passive-observing satellite instruments carried by
geostationary and Aqua/Terra satellites instead directly measure the visible and infrared
radiation reflected/emitted by Earth. Cloud properties are estimated by an automated retrieval
algorithm, which calculates the most likely cloud properties in a given location based on the
measured radiance. Some algorithms also use data from other sources, such as additional
satellite instruments. The retrieval algorithms are complex and can introduce errors for a variety
of reasons beyond uncertainties in the direct satellite measurements. The satellite-retrieved
cloud properties should not be considered absolute truth, but rather the best estimate of cloud
properties that can be provided by satellite observations.
CALIPSO is a somewhat different case because the onboard lidar directly measures the
presence, altitudes, and extinction rates of hydrometeors, aerosol particles, and other small
objects in the atmosphere. However, CALIPSO requires a retrieval algorithm to determine other
meteorological properties, such as distinguishing cloud hydrometeors from aerosol particles.
The cloud/aerosol height and opacity provided by CALIPSO are likely to be highly accurate, but
other properties are subject to uncertainties from the retrieval algorithm.
Modernization of Code for Aqua and Terra Satellite
Matches
Overview
When a GLOBE Clouds observation is taken within 15 minutes of a satellite overpass, the
observation is matched to satellite data. However, the code used to perform the matching
specifically to Aqua and Terra was written over 20 years ago in Fortran. The code has recently
been rewritten into Python, a modern programming language with widespread support. Not only
does the rewritten code help modernize our infrastructure, but it fixes several bugs found in the
original software, including not handling missing data properly and not properly handling
observations made around midnight UTC. As of 3 April 2022, the rewritten satellite code has
been put into production.
6Technical Changes
• The new code uses a slightly extended matching window of +/- 15:59.9 (compared to
15:00 previously). This was done to maintain backwards compatibility, as the old code
previously matched certain observations within this time rage. This has a side effect of
generating about 7% more matches than before.
• The new code makes proper use of default values in the FLASHFlux* satellite data
product. Default values are values that signal the data is missing and should not be
used. Data with these values are ignored while they were previously zeroed and then
used.
• The new code considers the full matching window even if this matching window extends
across multiple days. For example, an observation made on 1/1/2022 at 23:50 could be
matched to data from 1/2/2022 before 00:05. The old code did not consider matching
windows that extended across multiple days.
• The new code uses hourly FLASHFlux SSF data while the old code uses FLASHFlux
SSFS** data, this may create minor variations. The FLASHFlux SSFS data product
specially created for S’COOL and used when the team transitioned to The GLOBE
Program. This smaller subset was an average of the FLASHFlux SSF data product and
made it easier to manage by the team. FLASHFlux SSFS is no longer made available.
*Fast Longwave and Shortwave Flux (FLASHFlux) data product: It is a low latency (< 7
days from observations) TOA and parameterized surface radiative fluxes at CERES Single
Scanner Footprint (SSF) level and global gridded fluxes. Suitable for quick-look assessment,
educational and applied science uses. Not intended for appending to other CERES data
products for long-term variability studies. https://ceres.larc.nasa.gov/data/#flashflux-ssf-level-2
**The daytime binary SSF SCOOL (or SSFS) validation product contains all subsetted
footprints over SCOOL validation sites which have a solar zenith angle of less than 90 degrees.
The nighttime binary SSF SCOOL validation product contains all subsetted footprints over
SCOOL validation sites which have a solar zenith angle greater than or equal to 90 degrees.
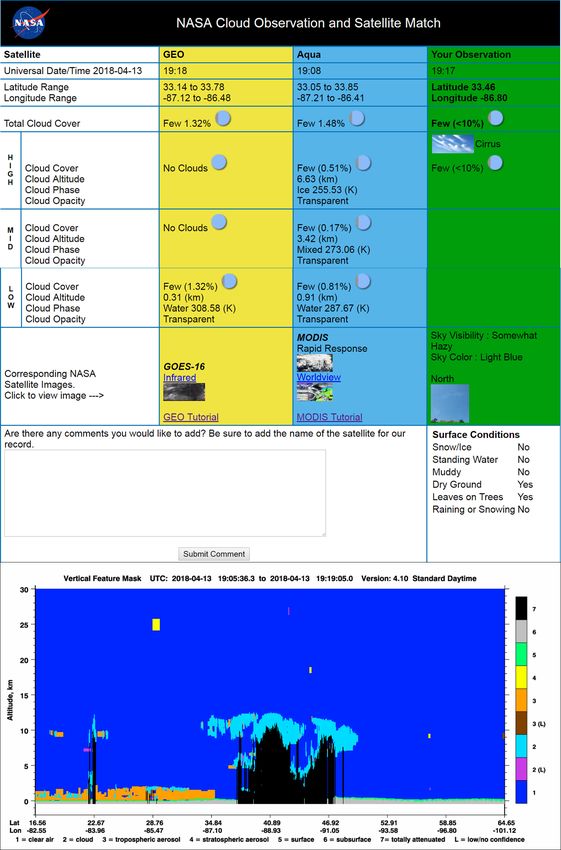
7Image 1. Example Satellite Match Table
8Footprint Definition
The satellite derived products (visible and infrared images) provided in the satellite match table
are centered on the latitude/longitude reported with the observations.
1. Geostationary Satellites
The NASA Langley SatCORPS team, part of the CERES cloud processing group, provides
geostationary satellite data to the NASA GLOBE Clouds team. Matches to geostationary
satellites include both a visible and an infrared image, remapped to 1.0-km resolution. The
resolution of the images, before remapping, can range between 1-3 km for visible and 2-4 km
for infrared projections, depending on the satellite. The full image displayed in the satellite
match table covers 400x400km, with a 40 km diameter area marked by a red circle. Table 2
displays the geostationary satellites used for collocation including the latitude and longitude
bounds of the fields of view they can observe.
Cloud products from geostationary satellites are stored on the NASA GLOBE Clouds system for
up to a month after they are collected. Any observations submitted to the GLOBE Program
beyond a month from the observation date/time cannot be collocated to geostationary satellites.
Cloud retrievals must produce at least 75% valid data (or absence of “no retrieval” flags) within
the 40-km footprint surrounding the ground observer to produce a satellite collocation. In
general, about 2-5% of the total number of pixels over an entire satellite image might result in a
“no retrieval” flag for the cloud product retrieval. This can happen with weak cloud signatures
and conflicting (or bad) input data. Although it happens in low percentages for an entire satellite
image, these “no retrieval” pixels can cluster more near an observer’s location within the 40-km
footprint.
GOES satellites provide half hourly data, as well as hourly full disk data (view of the Earth
centered on the Equator; see NOAA Geostationary Satellite Server for examples) over North
America. Meteosat 11, Meteosat 8, and Himawari-8 data run once per hour for the full disk.
Ground observations will be collocated if observations are within 15 minutes to the available
data. This means that areas within the GOES fields of view will match if observations are within
15 minutes from every half hour or hourly data, as long as the cloud products retrieve at least
75% valid data. Locations within the Meteosat and Himawari fields of view will result in
collocation if observations are within 15 minutes from every hour, as long as the cloud products
retrieve at least 75% valid data.
In Summary:
Matches to geostationary satellites occur if observations are within 15 minutes from every half
hour to hourly data within the GOES field, and 15 minutes within every hour in locations within
the Meteosat and Himawari fields of view (see Table 2). Spatially, the match includes all
geostationary data within a 40 km radius circle around the ground observation and includes both
an infrared and visible image (Colón Robles et al., 2020).
9Table 2. List of geostationary satellites used for collocation
Instrument
Area Coverage
Geostationary Onboard the Longitude
by GLOBE Latitude bounds
Satellite satellite used for bounds
Regions*
collocation
North America,
GOES West Latin America and
https://www.goes.noaa. Imager 60N-60S 105-180W
gov/goesfull.html Caribbean,
Pacific Ocean
GOES East North America,
Advanced
https://www.star.nesdis Latin America and
Baseline Imager 60N-60S 37.5-105W
.noaa.gov/GOES/fulldis Caribbean,
k.php?sat=G16 (ABI)
Atlantic Ocean
Europe and
Eurasia, Near Spinning
Meteosat-11 East and North Enhanced Visible
https://www.goes.noaa. 60N-60S 37.5W-41E
gov/f_meteo.html Africa, Africa, Asia and Infrared
and Pacific Imager (SEVIRI)
Indian Ocean
Europe and
Eurasia, Near Spinning
Meteosat-8 East and North Enhanced Visible
https://www.goes.noaa. 60N-60S 41-95E
gov/f_meteo.html Africa, Africa, Asia and Infrared
and Pacific Imager (SEVIRI)
Indian Ocean
Himawari-8 Advanced
Asia and Pacific
https://www.goes.noaa. Himawari Imager 60N-60S 95-180E
Pacific Ocean
gov/f_himawari-8.html (AHI)
*GLOBE Countries and Regions - https://www.globe.gov/globe-community/community-map
2. Aqua and Terra
The NASA GLOBE Clouds team uses the CERES FLASHFlux SSF data product to match
GLOBE cloud observations to Aqua and terra. A 0.4 degree latitude/longitude radius is used
around the ground observation as a footprint. Any satellite data within this defined footprint are
averaged to provide the comparison. Observations are matched to data derived by instruments
onboard a satellite if the following are met:
● the satellite swath is within the radius defined around the observation
● the satellite passes over the footprint within 15 minutes before or after the observation
● data from the satellite are available for the location and time
Collocations include true color images from the MODIS instruments onboard Terra and Aqua,
centered on the location of the observation and displayed using NASA’s Worldview Visualization
platform (see NASA’s EOSDIS WorldView).
10GLOBE Observer app users can opt to be notified of Aqua and Terra overpasses. Satellite
overpass schedules for Aqua and Terra can also be obtained by using the satellite overpass
calculator (see https://scool.larc.nasa.gov/GLOBE/globe_overpass-en.html.
3. CALIPSO
CALIPSO measures the vertical profile of the atmosphere using a laser beam with an
approximately 70-meter width at the Earth’s surface. This results in a very narrow swath of
observations, leading to fewer satellite matches to ground observations as compared to the
other satellites. Ground observations that are within 10 km and 15 minutes of CALIPSO’s path
will result in a collocation. Observations that are matched, or collocated, with CALIPSO receive
a link to the vertical feature mask for their latitude and longitude. The CALIPSO vertical feature
mask describes the vertical and horizontal distribution of cloud and aerosol layers observed by
the CALIPSO lidar (https://www.globe.gov/web/s-cool/home/satellite-comparison/how-to-read-a-
calipso-satellite-match). Different features are designated by CALIPSO (e.g. cloud or aerosol, or
the cloud ice/water phase) are available for each layer detected (see image 2). A summary of
these results is not displayed on the satellite match table as is done with the other possible
satellites/instruments.
11Image 2. Example Ground Observation with Satellite Collocation with CALIPSO
12Reconciling GLOBE and Satellite Classifications
Altitude
Altitude is the height at which the instruments onboard satellite detects a cloud. Algorithms
designed by scientists are the way altitude is detected, which detections of altitude are based on
observations and weather forecast model data. Cutoff values have been defined by where cloud
types are generally encountered as defined by meteorologist (see the World Meteorological
Organization’s Definitions of Clouds - https://cloudatlas.wmo.int/clouds-definitions.html). The
NASA GLOBE Clouds team uses these same altitude ranges to compare satellite detection of
clouds with ground observations (Table 3). A possible consequence of this set definition is that
a single cloud layer, an extensive nimbostratus cloud for example, can be split by the satellite
into two levels because the cloud may extend beyond the arbitrary cut-off definitions.
Table 3. Definition of altitude ranges to define the three basic cloud levels
Altitude range of
satellite observation GLOBE cloud type
(km)
Above 6 High clouds (contrails, cirrus, cirrocumulus, or cirrostratus)
2-6 Mid level clouds (altostratus or altocumulus)
Low clouds (fog/stratus, stratocumulus, cumulus, nimbostratus, or
0-2
cumulonimbus)
Opacity
Satellites measure opacity in terms of optical depth. The following ranges have been defined to
best compare ground observations of sky opacity to satellite data (table 4)
Table 4. Opacity values selected to match the three options for ground observers
Optical depth range from satellite Opacity category for ground observer
Above 10 Opaque
3-10 Translucent
Transparent Transparent
13Cloud Cover
The same categories and values are used for both ground and satellite reports (see Table 1).
Cloud Phase and Temperature
Cloud phase and temperature are collected from the satellite data and reported to help ground
observers best compare the cloud properties with the cloud type observed. Table 5 shows how
cloud phase is classified (see parameter SSF-107 for CERES example -
https://ceres.larc.nasa.gov/documents/collect_guide/pdf/SSF_CG_R2V1.pdf). Data are
collected for the altitude range and reported on the satellite match table.
Table 5. Cloud Phase Classifications
Liquid Value = 1
Mixed Value >1 but < 2
Ice Value = 2
GLOBE Clouds and Matched Satellite Data
Available
The NASA GLOBE Clouds team is making available a curated, analysis-ready GLOBE dataset
that includes the GLOBE Clouds data and the satellite matched data. The data is provided as
CSV files and posted on the GLOBE Observer website https://observer.globe.gov/get-
data/clouds-data. These are subsets of GLOBE data that have been post-processed by a
scientist on the GLOBE team and are being made available for broader use by the community.
Georeferenced subsets of the clouds data sets are also available:
Dust data, https://observer.globe.gov/get-data/dust-data
Eclipse data, https://observer.globe.gov/get-data/eclipse-data
List of data variables, units, and definitions is available at https://www.globe.gov/web/s-
cool/home/satellite-comparison/data-variable-units-and-definitions.
14Useful Links
1. Satellite Overpass Schedule Tool - https://scool.larc.nasa.gov/GLOBE/globe_overpass-
en.html
2. Satellite Match Table Example - https://www.globe.gov/web/s-cool/home/satelitte-
comparison/how-to-read-a-satellite-match
3. NASA’s EOSDIS Worldview - https://worldview.earthdata.nasa.gov/
4. CALIPSO - Data User’s Guide - Browse Image Tutorial - https://www-
calipso.larc.nasa.gov/resources/calipso_users_guide/browse/index.php
5. CALIPSO Quality Statements -
https://eosweb.larc.nasa.gov/sites/default/files/project/calipso/quality_summaries/CALIO
P_L2VFMProducts_3.01.pdf
6. NOAA Geostationary Satellite Server (with full disk images) - https://www.goes.noaa.gov/
7. Example Ground Observation with Satellite Collocation with CALIPSO:
a. Satellite Match Table - https://scool.larc.nasa.gov/cgi-bin/NASA-
GLOBESatMatch.cgi?observation_id=116-111805-39703922-201804131917
b. Corresponding CALIPSO Vertical Feature Mask - https://www-
calipso.larc.nasa.gov/data/BROWSE/production/V4-10/2018-04-13/2018-04-
13_18-38-38_V4.10_3_6.png
8. Satellite and GLOBE data sets available for download - https://observer.globe.gov/get-
data/clouds-data
9. List of Data Variables, Units, and Definitions - https://www.globe.gov/web/s-
cool/home/satellite-comparison/data-variable-units-and-definitions
References
Chambers, L.H., Young, D.F., Costulis, P.K., Detweiler, P.T., Fischer, J.D., Sepulveda,R.,
Stoddard, D.B., and Falcone, A., (2003). The CERES S'COOL Project. Bull. Amer.
Meteor. Soc., 84, 759–766. DOI: https://doi.org/10.1175/BAMS-84-6-759
Chambers, L.H., McKeown, M.A., McCrea, S.A., Martin, A.M., Rogerson T.M., and Bedka, K.M.,
(2017). CERES S’COOL Project Update: The Evolution and Value of a Long-Running
Education Project with a Foundation in NASA Earth Science Missions. Bull. Amer.
Meteor. Soc., 98, 473–483. DOI: https://doi.org/10.1175/BAMS-D-15-00248.1
Colón Robles, M., Amos, H. M., Dodson, J. B., Bouwman, J., Rogerson, T. M., Bombosch, A.,
Farmer, L., & Taylor, J. E. (2020). Clouds around the world: How a simple data
challenge became a worldwide success. Bulletin of the American Meteorological
Society, in press.
https://journals.ametsoc.org/action/showCitFormats?doi=10.1175%2FBAMS-D-19-
0295.1
15List of Research Using NASA GLOBE Clouds
Colón Robles, M., L. Farmer, J.B. Dodson, J.L. Tackett, C.C. DeFontes, K. Ivey, T.M. Rogerson,
J. Taylor, (2018). Citizen science cloud observations compared to near ground cloud
observations from CALIPSO and MODIS satellite data over the Drake Passage
AGU Fall Meeting Abstracts 2018, IN22B-07,
https://agu.confex.com/agu/fm18/meetingapp.cgi/Paper/412875
Dodson, J.B., Colón Robles, M., Taylor J.E., DeFontes, C.C., Weaver K.L., (2019). Eclipse
Across America: Citizen Science Observations of the 21 August 2017 Total Solar Eclipse.
Journal of Applied Meteorology & Climatology, https://doi.org/10.1175/JAMC-D-18-0297.1
Colón Robles, M., T. M. Rogerson, H. Amos, J. Taylor, and T. Harte, (2019). Leveraging
thousands of contrail observations from GLOBE citizen scientists. Fall Meeting 2019, San
Francisco, CA, Amer. Geophys. Union.
https://agu.confex.com/agu/fm19/meetingapp.cgi/Paper/611549
Starke, M., H. Amos, N. Arnold, T. M. Rogerson, and M. Colón Robles, 2019: Global cloud
cover: A comparison of satellite, model, and volunteer-reported data. Fall Meeting 2019, San
Francisco, CA, Amer. Geophys. Union, Abstract IN51E-0679,
https://agu.confex.com/agu/fm19/meetingapp.cgi/Paper/537030.
Colón Robles, M., Amos, H. M., Dodson, J. B., Bouwman, J., Rogerson, T. M., Bombosch, A.,
Farmer, L., Burdick, A., Taylor, J. E. & Chambers, L.H., (2020). Clouds around the world: How a
simple data challenge became a worldwide success. Bulletin of the American Meteorological
Society. DOI: https://doi.org/10.1175/BAMS-D-19-0295.1
Dodson, J.B., M. Colón Robles, T. Rogerson, J.E. Taylor, (2022). Do citizen science Intense
Observation Periods increase data usability? A deep dive of the NASA GLOBE Clouds data set
with satellite comparisons. Accepted/Forthcoming in Earth and Space Science.
16You can also read