Nanoscale transformations of amphiboles within human alveolar epithelial cells
←
→
Page content transcription
If your browser does not render page correctly, please read the page content below
www.nature.com/scientificreports
OPEN Nanoscale transformations
of amphiboles within human
alveolar epithelial cells
Ruggero Vigliaturo1*, Maja Jamnik2, Goran Dražić3, Marjetka Podobnik2,
Magda Tušek Žnidarič4, Giancarlo Della Ventura5,6,7, Günther J. Redhammer8,
Nada Žnidaršič9, Simon Caserman2 & Reto Gieré1,10
Amphibole asbestos is related to lung fibrosis and several types of lung tumors. The disease-triggering
mechanisms still challenge our diagnostic capabilities and are still far from being fully understood.
The literature focuses primarily on the role and formation of asbestos bodies in lung tissues, but there
is a distinct lack of studies on amphibole particles that have been internalized by alveolar epithelial
cells (AECs). These internalized particles may directly interact with the cell nucleus and the organelles,
exerting a synergistic action with asbestos bodies (AB) from a different location. Here we document
the near-atomic- to nano-scale transformations induced by, and taking place within, AECs of three
distinct amphiboles (anthophyllite, grunerite, “amosite”) with different Fe-content and morphologic
features. We show that: (i) an Fe-rich layer is formed on the internalized particles, (ii) particle grain
boundaries are transformed abiotically by the internal chemical environment of AECs and/or by a
biologically induced mineralization mechanism, (iii) the Fe-rich material produced on the particle
surface does not contain large amounts of P, in stark contrast to extracellular ABs, and (iv) the iron in
the Fe-rich layer is derived from the particle itself. Internalized particles and ABs follow two distinct
formation mechanisms reaching different physicochemical end-states.
Exposure to amphibole asbestos is in many cases associated with asbestosis, pleural abnormalities, bronchogenic
carcinomas and m esotheliomas1. The carcinogenic potency of amphibole asbestos was proven both epidemiologi-
cally and toxicologically2. Asbestos-related tumors are difficult to diagnose and have long latency periods, and it
is not clear whether there is a minimum threshold exposure for c arcinogenesis3. Moreover, the disease-triggering
mechanism of these minerals is still puzzling4, although new findings have recently advanced the understanding
of asbestos-related mesothelioma, lung cancer, and fi brosis1,5,6. To support the medical community in tracking
the fate of elongate mineral particles (EMPs) in cells (EMP is a term that includes asbestos m inerals7), we have
approached the problem from the opposite end: instead of focusing on the amphibole-related transformation of
cells, we studied how amphibole particles internalized by human lung cells are transformed at the near-atomic-
to nano-scale.
Asbestos is an all-inclusive, confusing, non-scientific, industrial term8–12. Moreover, the related malignancies
can also be caused by non-regulated asbestiform m inerals13, with an unclear role of nano-sized EMPs, non-
regulated fibers, cleavage fragments and split mineral particles internalized by human lung cells14–20. For these
reasons, our study focuses on the in-vitro uptake by alveolar epithelial cells (AECs) and the transformation of
amosite (the asbestiform variety of the mineral grunerite) and non-asbestiform amphiboles (anthophyllite and
grunerite). AEC injury is a key trigger, which promotes the development of asbestosis and lung c ancer1,21–24.
Here, we tested the interaction of the three selected minerals with the AEC line A549 (ATCC® CCL185™), to
study the alterations induced by the AECs. Our systematic approach can be more effective in reducing and
1
Department of Earth and Environmental Science, University of Pennsylvania, Philadelphia, USA. 2Department
of Molecular Biology and Nanobiotechnology, National Institute of Chemistry, Ljubljana, Slovenia. 3Department
of Materials Chemistry, National Institute of Chemistry, Ljubljana, Slovenia. 4Department of Biotechnology and
System Biology, National Institute of Biology, Ljubljana, Slovenia. 5Department of Geological Sciences, University
of Roma Tre, Rome, Italy. 6INFN-Istituto Nazionale Di Fisica Nucleare, Frascati (Rome), Rome, Italy. 7INGV, Via
di Vigna Murata 605, 00143 Rome, Italy. 8Department of Materials Science and Physics, University of Salzburg,
5020 Salzburg, Austria. 9Department of Biology, Biotechnical Faculty, University of Ljubljana, Ljubljana,
Slovenia. 10Center of Excellence in Environmental Toxicology, University of Pennsylvania, Philadelphia,
USA. *email: ruggero.vigliaturo@gmail.com
Scientific Reports | (2022) 12:1782 | https://doi.org/10.1038/s41598-022-05802-x 1
Vol.:(0123456789)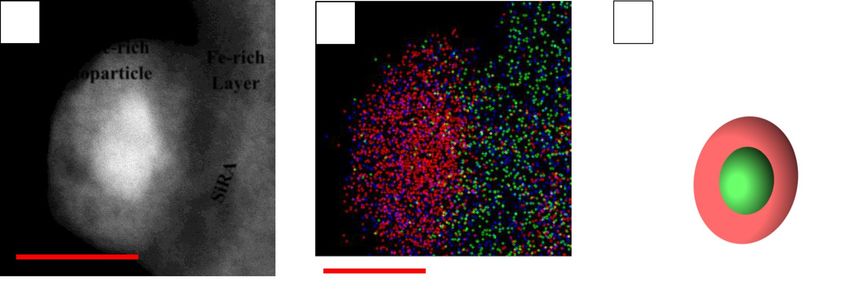
www.nature.com/scientificreports/
Technique1 Feature/property Collected data for systematic analyses on the starting material
acSTEM BF-MAADF,
Shape/morphology Qualitative observation on a minimum of 500 particles
acHRTEM
Observation of 50 SAED patterns and 100 HR images (50 in TEM and 50 in
SAED, acHRTEM and acSTEM BF-MAADF Crystal structure and crystallinity/amorphization
STEM mode)
Recording of mapping areas to obtain the chemical composition of a minimum
acSTEM-EDXS Chemical composition
of 100 particles (dwell time 2 ms per pixel)
Recording of a minimum of 20 EELS spectra from areas of 25 × 25 nm (3 frames
acSTEM Dual-EELS Fe-oxidation state in the crystal structure
for 10 s exposure in the core-loss region)
Table 1. Summary of the S/TEM techniques used for the characterization of both the starting and the
interacted material. 1 Additional Abbreviations: acSTEM = aberration corrected Scanning Transmission
Electron Microscopy; BF = Bright Field; MAADF = Medium-Angle Annular Dark Field; SAED = Selected Area
Electron Diffraction; HR = High-Resolution; EDXS = Energy-Dispersive X-Ray Spectroscopy; EELS = Electron
Energy-Loss Spectroscopy.
partially controlling the involved variables (e.g., chemical composition and surface physicochemical state) than
the frequently used comparison between crystal-chemically and physically dissimilar minerals like chrysotile
vs. amphibole asbestos and/or asbestiform zeolites.
This study focuses on the intracellular transformation of amphibole particles, and complements the extensive
literature describing asbestos bodies (ABs), i.e., extracellular Fe-covered “fibers” found in lung tissue, and their
role in triggering related malignancies. Once internalized, these amphibole particles may act as a source of reac-
tive oxygen species (ROS)25 in close contact with nuclei and cell organelles, and induce DNA damage in concert
with the “external” action and stimuli triggered by asbestos (and ABs)14–20, and the systemic response of the
body to their presence. Asbestos bodies have been characterized in detail26–29, also in terms of Fe-valence state30.
Our study, on the other hand, documents in unprecedented detail the transformation of micro- and nano-sized
EMPs within AECs, using a unique set of transmission electron microscopy (TEM) techniques (Table 1). It thus
provides unmatched information on the physicochemical end-states of internalized EMPs, which so far have not
been reported in the literature. These details may be crucial for the interpretation of biological, toxicological, and
potentially carcinogenic properties and effects, which have so far not yet been determined so exhaustively for
particles internalized by c ells18. The results show that both composition and structure of the amphibole particles
modified within AECs differ considerably from those of extracellular ABs, which have been described in some
detail in the literature. We further observed differences between transformations occurring in abiotic experi-
ments and our in-vitro experiments, and we hypothesize that they can be related to the so-called “vital effect”.
Results
The amphibole particles before the experiments. As mentioned above, the amphibole samples were
selected such as to expose the AECs to minerals with different features, in particular their chemical composition
and shapes. Specifically, grunerite (Gru) and amosite (Amo) have a similar Fe content, significantly higher than
that of anthophyllite (Ath; see the detailed characterization in the Supplementary Information S.1 and S.2). In
terms of morphological features, most of the Amo particles can be classified as asbestos, whereas both Gru and
Ath particles are better categorized as cleavage fragments and/or as mostly non-asbestiform amphiboles.
Combination of HRTEM and BF acSTEM (for abbreviations, see Table 1) revealed that the bulk structures
of all three amphiboles are highly crystalline (Fig. 1a,b; see also Supplementary Information S.2). However, near
the surface of all three minerals there is a transition zone in which the crystallinity is partially lost (Fig. 1c). This
transition zone is in turn covered by a Si-rich amorphous layer (SiRA) of variable extent and thickness (Fig. 1a,d),
in which the Si framework is rearranged (Fig. 1d) and other cations (e.g., M g2+ and C a2+) are depleted (See Sup-
31
plementary Information S.2.3), as previously described by Germine and Puffer in tremolite-actinolite EMPs
extracted from the lungs of miners in Quebec (Canada).
In some cases, regardless of the amphibole species, the SiRA is partially covered by an irregular amorphous
Fe-rich layer32,33. The presence of a discontinuous, oxidized, Fe-rich layer is also reflected by the high Fe-valence
state determined by Dual-EELS (see below) in this region.
Transformation of amphibole particles within AECs. The particles retrieved from within AECs after
the experiments displayed two types of appearances, regardless of their mineralogical identity: type-1 particles
with only limited evidence of dissolution (Fig. 2a,b); these are characterized by a valence state of Fe near the
surface that is statistically identical, or slightly reduced, compared to that at the grain boundaries of the starting
material; and type-2 amphibole particles with pronounced modifications at their surface (Fig. 2c,d), showing
formation of Fe-rich clusters and Fe-rich nanoparticles, and oxidation of a surficial Fe-rich amorphous layer
(additional particles with different habits are shown in Supplementary S.3, Fig. S.3.1).
Type-1 particles are very similar to naturally weathered amphiboles in terms of chemical composition and
physical transformations (Table 2, Supplementary Information Fig. S.3.1c,d, and S.3.2a,b)31–33: both show modi-
fied grain boundaries and both lack Fe-rich clusters and nanoparticles in the Fe-rich layers at their surface.
However, the Fe-rich layer in naturally weathered amphiboles tends to be less extended, and less thick than that
observed for type-1 particles extracted from the AECs (e.g., Supplementary Information Fig. S.2.2.1, and Fig.
Scientific Reports | (2022) 12:1782 | https://doi.org/10.1038/s41598-022-05802-x 2
Vol:.(1234567890)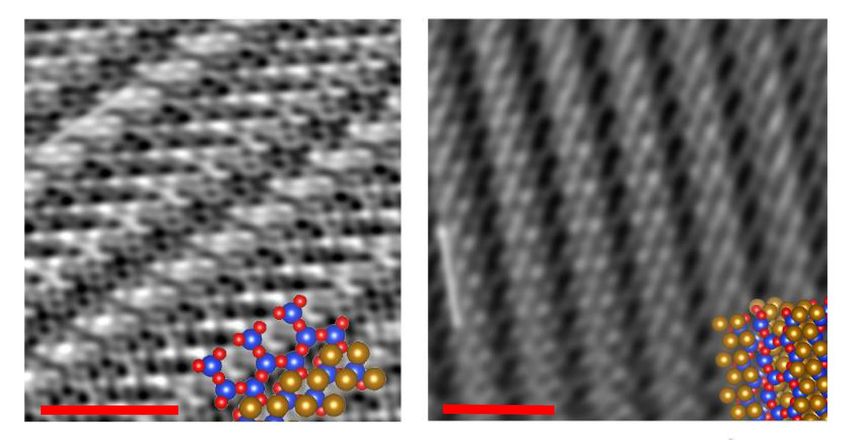
www.nature.com/scientificreports/

                                     a
                                                                                                        Bulk (b)

                                                     c

                                      SiRA (d)

                                                                Transition region (c)                                    20 nm

                                     b                                                      c

                                                                                            2.5 nm

                                                                                            d

                                                                         2.5 nm              2.5 nm

                                  Figure 1.  High-resolution TEM images of an amosite particle boundary (a) Overview of the amosite particle
                                  boundary showing the areas detailed in (b), (c) and (d); (b) TEM-Inverse Fast Fourier Transform (IFFT) image
                                  showing the bulk of the amosite particle, which is crystalline at the atomic scale; (c) Transition region between
                                  the crystalline amosite core and the Si-rich amorphous surface layer (SiRA); it can be identified by the loss of
                                  one of the symmetries; (d) SiRA.

                                  S.3.2a,b). Most of the Amo particles retrieved from the AECs belong to this typology (Fig. 2a,b). The extracted
                                  Gru particles were observed to belong equally to types 1 and 2, whereas the extracted Ath particles were most
                                  extensively transformed and largely belong to type 2.
                                      In both typologies, however, the bulk is highly crystalline, as documented down to the near-atomic scale, in
                                  the starting material as well as after interaction with the AECs (Fig. 3).
                                      The mean Mg/(Mg + Fe) value, determined by acSTEM-EDXS, did not change significantly in the bulk Gru
                                  and Amo particles during their interaction with the AECs, but decreased substantially in the case of Ath (Table 2).
                                  The distinct change in the Ath composition is mainly due to a loss of Mg, Al and Si, which caused a relative
                                  increase in the concentration of Fe (Table 2).
                                      The external amorphous material (most likely a mix of SiRA and Fe-rich material) is also visible after the
                                  interaction between particles and AECs, but it is usually thicker and has a more irregular, rough topography in
                                  comparison to the starting material (Supplementary Information S.3.2). At the grain boundary of all three amphi-
                                  bole types, we observed an Fe-rich layer lying on top of the SiRA. This Fe-rich layer is generally less developed
                                  in type-1 than in type-2 particles. The valence state of Fe at the particle boundary (25 × 25 nm square) of the

Scientific Reports |   (2022) 12:1782 |                https://doi.org/10.1038/s41598-022-05802-x                                                     3

                                                                                                                                              Vol.:(0123456789)
www.nature.com/scientificreports/
a b
c
1 µm 200 nm
c d
c c
0.5 µm 100 nm
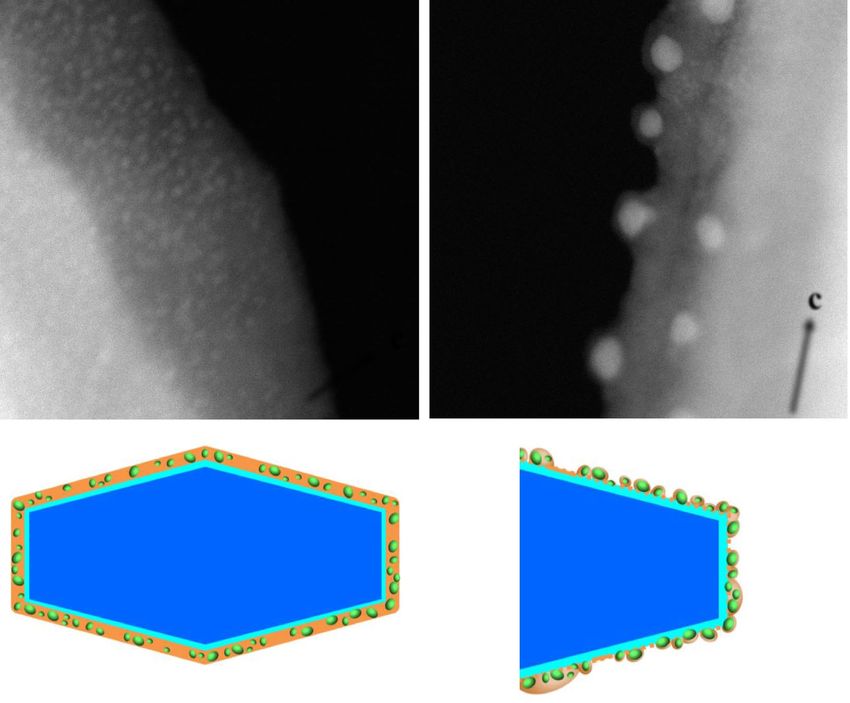
Figure 2. TEM images of amphiboles after interaction with AECs. (a) A nearly non-modified cleavage
fragment of amosite; (b) Detail of the image shown in (a) (red square), in which stepped lamellar boundaries,
rounded corners and streaking along the c-axis can be recognized; (c) acSTEM-HAADF image of an
anthophyllite particle after interaction; the particle is completely covered by an Fe-rich layer containing several
Fe-rich nanoparticles, which are visible as bright spots; (d) BF image of elongated particles of grunerite after
interaction; particles display rough, highly modified grain boundaries, compromised morphology and clear
signs of dissolution of the amorphous layer.
interacted amphiboles is statistically identical, or slightly lower, when compared to that at the grain boundaries
of the starting material (Table 3).
The Fe-rich layer is generally amorphous (Fig. 4a,b) and either occurs as a continuous envelope around the
amphibole particles (Fig. 4a,c), or it only partially covers the SiRA (Fig. 2d, Supplementary Information Fig.
S.3.2.b). When well developed (i.e., in type-2 particles), the Fe-rich layer can be decorated by clusters of F e2+
(Fig. 4a), which seem to develop into amorphous Fe-rich nanoparticles (Fig. 4, and Supplementary Information
S.3, Fig. S.3.2c,d). Here, we define as “clusters” Fe-rich regions of rounded or ellipsoidal shape that do not have
a clear or distinguishable interface with the surrounding Fe-rich layer but are visible mostly because of their
MAADF contrast (e.g., Fig. 4a); their diameter is smaller than 2 nm (measured along the larger axis cutting
through the cluster). In contrast, the “nanoparticles” have a distinct boundary, which clearly separates them from
the surrounding Fe-rich layer (e.g., Fig. 4b); the shape of the nanoparticles is more easily distinguishable even
without the use of MAADF (e.g., Supplementary Fig. S.3.2c, d). The average dimensions of the Fe-rich clusters
Scientific Reports | (2022) 12:1782 | https://doi.org/10.1038/s41598-022-05802-x 4
Vol:.(1234567890)www.nature.com/scientificreports/
Mean σn-1 Max Min Mean σn-1 Max Min Relative difference (in percentages)
Anthophyllite
Na2O N.D – N.D N.D N.D – N.D N.D –
MgO 22.87 1.19 24.43 21.94 7.62 0.68 8.10 7.14 −66.68
Al2O3 6.03 1.00 6.77 4.63 1.61 0.64 2.06 1.15 −73.30
SiO2 59.47 1.96 61.14 56.68 43.22 0.10 43.29 43.15 −27.33
K2O 0.01 0.01 0.02 N.D N.D − N.D N.D −100
Before Interaction After Interaction
CaO 0.17 0.08 0.28 0.09 N.D − N.D N.D −100
TiO2 N.D – N.D N.D N.D – N.D N.D –
MnO 0.28 0.03 0.31 0.25 N.D – N.D N.D −100
FeO 11.25 1.65 13.59 10.03 47.56 1.22 48.42 46.69 + 322.76
Mg/(Mg + Fetot) 0.61 0.11 −81.97
Grunerite
Na2O N.D – N.D N.D N.D – N.D N.D –
MgO 7.87 1.45 8.81 5.38 10.09 0.63 10.88 9.33 + 28.21
Al2O3 0.99 0.25 1.19 0.56 0.94 0.63 1.32 N.D −5.05
SiO2 50.05 1.16 51.33 48.46 55.90 1.23 56.73 54.09 + 11.69
K2O N.D – N.D N.D N.D – N.D N.D –
Before Interaction After Interaction
CaO 0.12 0.07 0.25 0.06 0.08 0.06 0.12 N.D −33.33
TiO2 N.D – N.D N.D N.D – N.D N.D –
MnO N.D – N.D N.D N.D – N.D N.D –
FeO 40.97 2.07 43.51 38.70 32.99 1.95 35.32 30.97 −19.48
Mg/(Mg + Fetot) 0.13 0.19 + 46.15
Amosite
Na2O 0.01 0.02 0.03 N.D N.D – N.D N.D −100
MgO 8.83 0.45 9.15 8.17 6.97 0.02 6.98 6.95 −21.07
Al2O3 0.82 0.39 1.26 0.45 1.02 0.23 1.18 0.86 −24.39
SiO2 54.60 2.01 56.90 52.00 45.79 5.76 49.86 41.72 −16.14
K2O 0.01 0.02 0.04 N.D N.D – N.D N.D −100
Before interaction After interaction
CaO 0.11 0.05 0.19 0.08 0.04 0.01 0.04 0.03 −63.64
TiO2 N.D – N.D N.D N.D – N.D N.D –
MnO 0.32 0.03 0.36 0.29 N.D – N.D N.D −100
FeO 35.31 2.10 38.21 33.29 46.20 5.55 50.12 42.27 + 30.84
Mg/(Mg + Fetot) 0.16 0.10 −37.5
Table 2. Oxide composition (in wt%) of the amphibole particles before (starting material) and after (retrieved
from cells) the interaction with AECs. Data obtained by acSTEM-EDXS bulk analyses. Before the interaction:
n = 100 for each of the minerals; after the interaction: n = 19, 24 and 59 for anthophyllite, grunerite and amosite,
respectively. N.D = not determined
and nanoparticles are 1.24 ± 0.21 nm (46 measurements) and 7.44 ± 2.30 nm (84 measurements), respectively
(Table 4).
Both Fe-rich clusters and nanoparticles are characteristic of the highly modified type-2 particles, and rarely
occur in type-1 particles, implying that they are generated at the grain boundary of the amphibole crystallites
inside the AECs. Each individual Fe-rich cluster or Fe-rich nanoparticle is always embedded in the amorphous
Fe-rich layer and never lies on the surface of the amphibole (Fig. 4, and Supplementary Fig. S.3.2).
The log-normal dimensional distributions of the Fe-rich clusters (Null hypothesis ( H0) = log-normal distri-
bution; Kolmogorov–Smirnov test: D = 0.050; p-value = 0.977; α = 0.05; Chi-square test: chi-square (observed
value) = 2.916; chi-square (critical value) = 14.067; GDL = 7; p-value = 0.893; α = 0.05) and nanoparticles (Null
hypothesis (H0) = log-normal distribution; Kolmogorov–Smirnov test: D = 0.060; p-value = 0.993; α = 0.05; Chi-
square test: chi-square (observed value) = 6.851; chi-square (critical value) = 14.067; GDL = 7; p-value = 0.445;
α = 0.05) (Fig. 5) are consistent with abiogenic and/or biologically induced mineralization (BIM), but not with
biologically controlled mineralization (BCM) processes (BCM would exhibit a negatively skewed size distribu-
tion)34–37. Briefly, during BIM, the precipitation of minerals occurs as a consequence of the interaction between
the biological activity and the environment, whereas during BCM, the subject organism directly controls the
nucleation and growth, the habit, and the location of the mineral through is cellular activity34–37.The dimensions
of the clusters (Table 4, Fig. 5a) were measured on a completely visible Fe-rich layer covering a Gru particle
(e.g., Fig. 4a), whereas those of the nanoparticles (Fig. 5b) were determined on a completely visible Fe-rich layer
covering an Ath particle (e.g., Fig. 4b). Even though this method of using size distributions to determine the
nature of mineralization processes has never been applied to minerals that interacted with, or were generated
by eukaryotic cells, our findings are compatible with the literature data on abiotic amphibole dissolution in
Scientific Reports | (2022) 12:1782 | https://doi.org/10.1038/s41598-022-05802-x 5
Vol.:(0123456789)www.nature.com/scientificreports/
a b
c
c
1.5 nm 1.5 nm
Figure 3. Two different orientations of the crystalline core region of amosite with superimposed crystal
structure, where the blue, red and orange atoms represent Si, O, and Fe, respectively. AcSTEM images showing
(a) a crystal before the interaction with AECs; and (b) a crystal (in a different orientation) after 48 h of
interaction with AECs.
Before After
interaction interaction
Average valence state 2.72 2.56
σn-1 0.14 0.07
Anthophyllite (n = 35) (n = 8)
Maximum 3.12 2.67
Minimum 2.46 2.44
Average valence state 2.43 2.08
σn-1 0.26 0.03
Grunerite (n = 26) (n = 10)
Maximum 2.96 2.13
Minimum 2.06 2.02
Average valence state 2.44 2.28
σn-1 0.31 0.10
Amosite (n = 38) (n = 13)
Maximum 3.10 2.49
Minimum 2.09 2.18
Table 3. Valence state determined by EELS at particle grain boundaries (25 × 25 nm) before and after the
interaction with AECs.
simulated biofluids38–41. We believe that this method could be applied to nanoparticle generation in eukaryotic
systems following further testing.
We used Dual-EELS to highlight differences in the Fe-valence state among the observed Fe-rich objects
(clusters, nanoparticles, and amorphous layer) in the modified surface layers of all analyzed amphiboles retrieved
from the AECs (Table 5). Even though the number of analyses is relatively small for each type of amphibole, the
difference in Fe-valence state is significant between the clusters and the Fe-rich layer, whereby the Fe-rich layer
is in all cases more oxidized than the clusters. This observation also holds when comparing the individual objects
across all types of amphiboles: overall, the Fe-valence state in all analyzed Fe-rich clusters (n = 21) is 2.05 ± 0.05,
whereas that in the surrounding Fe-rich layer (n = 12) is 2.36 ± 0.11 (Table 5). Furthermore, this dataset confirms
that the highest number of Fe-rich nanoparticles (n = 16) was observed on Ath particles, which, in comparison
to Gru and Amo, were most strongly modified chemically during the interaction with the AECs (Table 5).
To investigate possible differences in Fe-valence state and stoichiometry between the Fe-rich objects at the
modified surface of the extracted amphiboles, we combined the ac-STEM-EDX and the Dual-EELS results (with
an estimated overall lateral spatial resolution in the nanometer range, taking into account beam-broadening and
possible electron-channeling effects). This complex analysis was performed on a region near the surface of an
Ath particle, where it was possible to find a Fe-rich nanoparticle and layer suitable for applying all the described
techniques. Figure 6a shows such an Fe-rich nanoparticle and the surrounding amorphous Fe-rich layer. The
Fe-valence state at the core of the Fe-rich nanoparticle (green arrow, Fig. 6) is 2.04 ± 0.04, whereas that in the
surrounding Fe-rich layer (red arrow) is 2.40 ± 0.09. The valence state of the Fe-rich nanoparticle was evaluated
Scientific Reports | (2022) 12:1782 | https://doi.org/10.1038/s41598-022-05802-x 6
Vol:.(1234567890)www.nature.com/scientificreports/
a b
c
c
20 nm 20 nm
c d
Figure 4. acSTEM-MAADF images of (a) visible Fe-clusters, appearing in light grey (examples highlighted
with red arrows), embedded in a Fe-rich layer covering a grunerite particle extracted from AECs (white part of
the image on the left); (b) amorphous Fe-rich nanoparticles (examples highlighted with red arrows) surrounded
by Fe-rich material covering an anthophyllite particle (white part on right side of image) extracted from AECs.
The two diagrams (c,d) show simplified cross-section models of an amphibole particle after its interaction
with the AECs. (c) Crystalline amphibole (dark blue, representing the “bulk”), which is completely covered
by the SiRA (light blue) and an outermost Fe-rich amorphous layer (orange) with embedded amorphous
Fe-rich nanoparticles; (d) Crystalline amphibole whose Fe-rich layer (light orange) is discontinuous and
heterogeneously covers the underlying SiRA.
Minimum Maximum Mean σn-1 n
Cluster diameter (nm) 0.93 1.93 1.24 0.21 46
Nanoparticle diameter (nm) 3.37 14.58 7.44 2.30 84
Table 4. Diameter range and statistical information for the Fe-rich clusters and nanoparticles occurring in the
surficial amorphous, Fe-rich layer on amphiboles.
by considering the thickness ratio of the Fe-rich layer to the enclosed nanoparticle. Characterization by acSTEM-
EDXS revealed a chemical composition of the Fe-rich layer (Fe = 64.33 ± 1.29 wt%; O = 35.67 ± 0.71 wt%) that
is stoichiometrically compatible with ferrihydrite ((Fe3+10O14(OH)2)), whereas the chemical composition of the
Fe-rich nanoparticles (Fe 83.78 ± 1.68 wt%; O = 16.22 ± 0.32 wt%) is stoichiometrically compatible with wüstite
(FeO). Other O-bonding elements were not detected even using Dual-EELS (Supplementary Information Fig.
S.3.4), but they might be present in traces. It must be noted, however, that, although stoichiometrically compatible
with the compositions of these minerals, both the Fe-rich nanoparticles and the Fe-rich layer are amorphous,
Scientific Reports | (2022) 12:1782 | https://doi.org/10.1038/s41598-022-05802-x 7
Vol.:(0123456789)www.nature.com/scientificreports/
a Clusters b Nanoparticles
25 25
20 20
15 15
Frequency
Frequency
10 10
5 5
0 0
1.56
3.12
4.67
6.23
7.79
9.35
10.91
12.46
14.02
15.58
1.00
1.11
1.21
1.32
1.42
1.52
1.63
1.73
1.84
1.94
Class (nm) Class (nm)
Figure 5. Experimentally determined (blue) and calculated (log-normal fits; grey) size distributions of clusters
and nanoparticles occurring in the amorphous Fe-rich layer on amphibole particles extracted from AECs,
indicating an abiogenic or BIM process of particle formation. (a) size distribution of clusters on a grunerite
particle; (b) size distribution of nanoparticles on an anthophyllite particle. The x-axis labels show the upper limit
of each bin (10 bins total for each chart).
Fe-rich clusters Fe-rich nanoparticles Fe-rich layer
n=9 n = 16 n=5
Mean 2.05 2.19 2.35
Ath σn-1 0.05 0.11 0.16
Maximum 2.15 2.45 2.55
Minimum 2.00 2.01 2.14
n = 11 n=2 n=1
Mean 2.04 2.21 2.31
Gru σn-1 0.04 0.20 -
Maximum 2.14 2.35 2.31
Minimum 2.00 2.07 2.31
n=1 n=2 n=6
Mean 2.16 2.25 2.37
Amo σn-1 – 0.06 0.07
Maximum 2.16 2.29 2.46
Minimum 2.16 2.21 2.29
n = 21 n = 20 n = 12
Mean 2.05 2.20 2.36
Overall σn-1 0.05 0.11 0.11
Maximum 2.16 2.45 2.55
Minimum 2.00 2.01 2.14
Table 5. Average Fe-valence state of Fe-rich clusters, nanoparticles, and amorphous layer grown during the
interaction with AECs, as determined by acSTEM Dual-EELS investigations.
Scientific Reports | (2022) 12:1782 | https://doi.org/10.1038/s41598-022-05802-x 8
Vol:.(1234567890)www.nature.com/scientificreports/
Fe-rich layer plus
a Fe-rich layer b c Fe-rich
plus Fe-rich
Fe-rich nanoparticle
nanoparticle
Layer
core Fe-rich layer
10 nm
10 nm
Figure 6. The structure of a nanoparticle lying on the SiRA of an interacted Ath particle extracted from AECs
viewed in acSTEM-HAADF mode. (a) Core (bright grey) with an average Fe-valence state of 2.04, representing
a mixture of core and layer (green arrow), and a “layer” (red arrow) with an average Fe-valence state of 2.40;
(b) Fast EDXS map of the area seen in a) showing the Fe (red), O (blue), and Si (green) signals; (c) Simplified
structure of a nanoparticle.
as documented by acSTEM observations (e.g., Fig. 6a). The matrix with which the nanoparticles and the Fe-
rich layer are in contact is probably a mixture of SiRA and possibly Fe3+-silicates, as evidenced by EDX spectra
(Supplementary Information Fig. S.3.3, Fig. S.3.5). Of note is the absence of Fe-phosphates or other phosphates
in the modified amphibole particle population and, specifically, in the Fe-rich layer (SupplementaryInforma-
tion Fig. S.3.3, Fig. S.3.4). This result allows us to infer that the observed particle transformations probably took
place within the acidic compartments of the AECs (e.g. phagocytic compartments, lysosomes) and/or that the
physicochemical conditions did not allow for phosphorus adsorption or surface coordination. Furthermore,
the absence of phosphorus highlights an important difference between the internalized amphiboles and the
extracellular ABs described in the literature cited above.
Discussion
Our study has documented that amphibole particles exhibit great bulk stability down to the near-atomic- and
nano-scale within AECs, at least up to 48 h of interaction. Our results, however, also demonstrate that during
the interaction with the AECs, the amphiboles were modified at their surface, thus confirming the validity of
a previous model of amphibole alteration, which was based on experiments in simulated body fluids38–41. Our
study, on the contrary, is based on cell-culture exposure experiments, which allows us to propose an expanded
conceptual, albeit speculative model by including details observed at the near-atomic- to the nano-scale on
AEC-internalized amphibole particles. Based on our data and the related literature38–41, our expanded model of
amphibole alteration within AECs can be described as follows:
(a) In nature, crystalline amphibole particles are in some cases either fully or partially covered by a heteroge-
neous SiRA layer, with or without Fe-oxyhydroxide species near its s urface31–33. Fe-rich amorphous nanoparticles
have never been reported at the grain boundary of natural (i.e., environmentally weathered) amphiboles (in our
case, the starting material) within the Fe-rich layer (when present).
(b) Once taken up by AECs, the amphibole particles undergo incongruent dissolution, which is analogous
to what was observed abiotically by Pacella et al.39,41, and Andreozzi et al.40 in both an acidic and a neutral pH
medium. This process depends, amongst other parameters, on the chemical composition of the amphibole and on
the presence or absence of an amorphous, altered surface layer. In our case, in contrast to what has been observed
abiotically38–41, Mg2+ leaching seems to have been more intense for Ath than for Gru and Amo (see Table 2).
(c) During the incongruent dissolution, the grain boundary becomes progressively enriched in Fe. This
process causes the exposure at the particle boundary of F e2+-containing structural sites and the erosion of the
3+ 41
Fe -rich outer layer (if present) , and is associated with a lowering of the average valence state of the surface
layer (although the difference is mostly not statistically significant when observed on areas of 25 × 25 nm by
Dual-EELS, see Table 3). In this first stage, the boundary dissolution is faster than the boundary oxidation. In
agreement with Pacella et al.38,39, Andreozzi et al.40, and Vigliaturo et al.42, we do not expect Fe to be released into
solution (or only in extremely small amounts), unless the particles are internalized in acidic compartments at a
certain point during the experiment (see also Pacella et al.41). In that case, the finite-volume compartment (e.g., a
lysosome) containing the particle would be easily Fe-saturated, promoting re-precipitation of Fe. The amphibole
dissolution and release of Fe in an acidic medium would be consistent with the abiotic experiment conducted
by Pacella et al.41. The boundary Fe2+ is oxidized to Fe3+ within or below the altered amorphous surface layer to
form Fe3+-silicates and, subsequently, Fe3+ oxyhydroxides and/or Fe phosphates38–41. At this stage, the boundary
oxidation has become faster than the boundary dissolution, possibly also as a consequence of the Fe-saturation
in the lysosomes. The notable absence of Fe phosphates in our samples, however, is the most important chemi-
cal difference between our cell experiments and those performed in simulated biofluids38–41, and is probably
Scientific Reports | (2022) 12:1782 | https://doi.org/10.1038/s41598-022-05802-x 9
Vol.:(0123456789)www.nature.com/scientificreports/
due to the segregation of the amphibole particles into acidic cell compartments (i.e., lysosomes); alternatively,
it could be due the absence of the appropriate physicochemical conditions to allow for phosphorus adsorption
or surface coordination.
(d) Simultaneously with the oxidation of the F e2+ at the particle boundary, the amphibole particles dissolve,
thereby partially or completely removing the outermost altered SiRA layer containing M g2+, Ca2+, and N
a+, and
dissolving the silicate s tructure38–40. This process results in an amphibole grain boundary region, in which the
crystalline bulk may be only partially covered by an amorphous layer (see, e.g., Fig. 2d) or nearly devoid of such
a layer (see, e.g., Fig. 2a,b).
(e) Formation of Fe2+-oxide clusters within the outermost F e3+-rich layer (Fig. 4a).
(f) Growth of F e2+-oxide clusters into amorphous F e2+-oxide nanoparticles, which are embedded in the
Fe3+-rich layer (mostly containing F e3+-rich oxyhydroxides) covering the altered SiRA (Fig. 4b).
(g) Partial loss of the Fe-rich layer, resulting in a thinner, residual Fe-rich layer on top of the SiRA, which still
surrounds Fe2+-oxide amorphous nanoparticles (Fig. 6a).
Here, we highlighted a fundamental difference between the previously studied abiotic s ystems38–41 and our
observations in biotic systems (i.e., AECs). In abiotic systems, even at acidic p H41, Fe-rich amphibole particles
are dissolving faster than Fe-poor amphibole particles. In our study, the amphibole particle alterations were more
intense for Ath (lower Fe-content—Table 2), than for Gru, and Amo (higher Fe-content—Table 2). This result
can be explained by two separate non-exclusive hypotheses:
(1) In our 48-h experiment, we cannot know at what time a given particle, which we studied after its extraction
from the AECs, was internalized by the cell, and at what time point the cell might have died without responding
with intracellular c hanges43. Therefore, we do not know exactly how much time was needed for this particle to
reach the observed end-state (due to the experimental setup, the maximum time was 48 h), nor is it possible to
know whether or not the cells were active during the entire experiment (Preliminary data on cell viability are
available in the Supplementary Information S.4 and a dedicated paper in preparation); and.
(2) since a certain end-state of the amphibole surface appears to be able to modulate the reactivity and toxicity
of a particle, the cell might be able to recognize the surface state of a given particle before, during or after uptake
and internalize the particles following different pathways. Specifically, amphibole particles with a surface that
is Fe-poor and/or with highly coordinated Fe atoms (e.g., our Ath) could be released into the cytoplasm after
internalization by endocytosis (possible phagocytosis) and/or engulfment44–46 so that the Fe-undersaturated
environment can promote the alteration of the particle boundary to a poorly reactive or unreactive state (i.e.,33).
In contrast, amphiboles with an Fe-rich surface and/or with poorly coordinated Fe atoms could be segregated
into a vesicle that provides a nearly Fe-saturated environment so that they can be stabilized by forming an Fe-rich
layer that fully covers the particle (as described in detail by Fantauzzi et al.33) within an isolated compartment
without affecting the surrounding DNA material and organelles.
If our second hypothesis is further confirmed, this could be solid proof that the “vital effect”47 plays a major
role in determining the overall reactivity and toxicity of internalized exogenous minerals, whereby the cell is
selecting the environment into which a certain particle will be segregated (i.e., Fe-unsaturated cytoplasm versus
nearly Fe-saturated vesicle). It could also emphasize that the vital effect’s action is dependent on the initial surface
features of the internalized micro- or nano-particles, which can be “recognized” early by the target cells, thus
determining the chemical environment that drives the internalized particle transformations (through BIM) as
well as the stabilization to a certain physicochemical end-state.
The amphibole particles characterized in this study after their extraction from the interior of the AECs
are distinct from the well-known ABs48,49, which take longer (i.e., 4 weeks or more) to form in vivo around
asbestos30,50–54, and are mostly visible in thin sections of lung tissue where they can be studied by optical micros-
copy, SEM and, less frequently, by T EM29. Our research highlights several notable differences between ABs and
the altered amphibole particles extracted from AECs studied here:
(1) Location where the Fe-rich layer of the amphibole particles is produced: in our study, we focused on the
amphibole particles that were internalized and transformed within the AECs, whereas ABs are commonly
generated in contact with the tissue of the lower respiratory t ract55,56 after phagocytosis and failure of lung
clearance57–64. The fact that our high-resolution methods did not detect P within the Fe-rich objects stud-
ied here (i.e., layer, clusters, and nanoparticles) suggests that the particles were internalized within acidic
compartments (e.g., lysosome), at least for a certain amount of time.
(2) Formation mechanism: ABs are formed when the lung-clearance mechanism fails, resulting in “asbestos”
particles being coated with an Fe-protein-mucopolysaccharide57–64. This coating can be generated through
BCM over a period of 4 weeks or more. These formation pathways of ABs are, thus, different from the
amphibole-alteration mechanism described here, which took place within AECs and during a much shorter
interaction time, which points to abiotic or, possibly, BIM processes.
(3) Chemical composition: we have shown that the Fe3+-rich amorphous layer, as well as the Fe-rich nanoparti-
cles and clusters in this surface layer, consist primarily of Fe (with O and H), with no detectable P. Asbestos
bodies are also rich in Fe, but additionally contain substantial amounts of P, Ca, and M g65–67, whereby Ca
acts as an aggregation agent for f erritin64 and P is associated with the ferritin c ore65. Moreover, Fe is not
a dominant component of the ABs formed around crocidolite (i.e., asbestiform riebeckite amphibole),
chrysotile (a serpentine mineral), and/or erionite (a zeolite) 68.
(4) Origin of Fe in the layer that forms around amphibole particles: in our study, the Fe-rich layer with its
enclosed clusters and nanoparticles is most likely derived from the underlying amphibole itself. The most
chemically modified amphibole (EDXS bulk analysis, and surface modification imaging), Ath, is the one
that presents more abundant Fe-rich nanoparticles within a thicker modified Fe-rich layer compared to
Scientific Reports | (2022) 12:1782 | https://doi.org/10.1038/s41598-022-05802-x 10
Vol:.(1234567890)www.nature.com/scientificreports/
the other two amphiboles. In the case of ABs, Fe is mostly derived from the Fe-protein-mucopolysaccha-
rides57–64.
Methods
Studied samples. The three starting materials for our experiments are the UICC (Union for International
Cancer Control) amosite (Amo), described in detail by Pollastri et al.69 and Vigliaturo et al.32, and two non-
asbestiform amphiboles: anthophyllite (Ath) from Kongsberg (Norway), labelled MNHN 29_102, and grunerite
(GRU) from Salem (India), labelled MNHN 97_373, both part of the mineralogical collection of the Muséum
National d’Histoire Naturelle in Paris (France). Ath and Gru were fully characterized in this study (Supple-
mentary Information S.1) by using X-Ray Powder Diffraction (XRPD), Fourier-Transform Infrared (FTIR) and
Raman spectroscopies, Mössbauer Spectroscopy and Electron Probe Micro-Analysis (EPMA). As presented
elsewhere, Ath and Gru were found to consist mainly of bladed and acicular crystallites, whereas the UICC
standard Amo was mainly asbestiform, but also showed some cleavage fragments (Vigliaturo et al., in prep.).
Cell treatment and sample preparation for acS/TEM. The three different amphiboles were sterilized
in 1.5 mL Safe Lock tubes (Eppendorf, Germany) for 20 min at 121 °C (VX-150, Systec, Germany) before each
use with cells to ensure their sterility. The minerals were then suspended in A549 cell growth medium up to a
desired maximum concentration (100 µg/mL) with two 5-min sonic bath cycles interspaced with a 2-min vor-
texing step.
The AECs were seeded on 12-well plates at a density of 6.6 × 10⁵ cells per well one day prior to any experi-
ment. Cells were treated with each of the three amphiboles at a final concentration of 50 µg/mL and incubated
for 48 h at standard culture conditions. After incubation, the medium was changed with a fresh one without
mineral particles, so that non-internalized extra-cellular amphibole particles were washed away and not studied.
Subsequently, the cells were detached using a cell scraper.
The mineral particles were extracted from the AECs with a chemical digestion procedure using a gentle
bleach method63,70,71: the cells were transferred into a 50 mL tube containing 10 mL of NaClO (14 vol.%), then
vortexed and left to rest for 30 min. The suspension in the tube was then centrifuged at 80,000 RPM, and the
NaClO substituted by deionized water. Subsequently, the material was transferred onto lacey-carbon copper grids
(SPI Supplies) for acS/TEM (aberration-corrected Scanning Transmission Electron Microscopy) investigations.
Nanoscale investigations: acS/TEM‑EDXS and Dual‑EELS. The nanoscale investigations were con-
ducted using an atomic-resolution acSTEM (ARM 200 F, JEOL), equipped with a high-brightness Cold Field
Emission Gun (CFEG) operating at 80 kV. The microscope was equipped with an EDXS system (Centurio 100
mm2, JEOL), and an energy filter (QuantumGIF, Gatan, USA) for Dual-EELS. AcSTEM/TEM-EDXS and Dual-
EELS (Electron-Energy-Loss-Spectroscopy) were used systematically to characterize both the natural starting
materials and the minerals extracted from the AECs after interaction with cell cultures for 48 h, as summarized
in Table 1.
AcSTEM-EDXS spectra were collected to compare the chemical composition of the starting materials with
that of the particles after interaction with the AECs. We recorded maps to obtain the chemical composition of at
least 100 particles (dwell time 2 ms per pixel) for each sample. The reduced electron density (Spot size 6) and volt-
age (80 kV) allowed us to minimize beam damage, dispersion effects, and the evaporation of volatile e lements32,72.
Artefact tests. The physicochemical state of the surface depends on the conditions to which an amphibole
particle was exposed either in the environment or during sample preparation and investigation with an electron
beam. Because artefacts at this level of investigation may be generated, all our materials were tested for electron
beam stability and for the possibility of modification by the surrounding medium (Supplementary Information
S.5).
Data availability
All data generated or analyzed during this study are included in this published article (and its Supplementary
Information files).
Received: 19 August 2021; Accepted: 15 December 2021
References
1. Jablonski, R. P., Kim, S. J., Cheresh, P. & Kamp, D. W. Insights into mineral fibre-induced lung epithelial cell toxicity and pulmonary
fibrosis. EMU Not. Mineral. 18, 447–500 (2017).
2. Bernstein, D. et al. Health risk of chrysotile revisited. Crit. Rev. Toxicol. 43(2), 154–183 (2013).
3. U.S. National Research Council. Asbestiform fibres: nonoccupational health risks. National Academy Press, Washington (1985)
4. Gualtieri, A. F. et al. New insights into the toxicity of mineral fibres: A combined in situ synchrotron μ-XRD and HR-TEM study
of chrysotile, crocidolite, and erionite fibres found in the tissues of Sprague-Dawley rats. Toxicol. Lett. 274, 20–30 (2017).
5. Gaudino, G., Xue, J. & Yang, H. How asbestos and other fibers cause mesothelioma. Transl. Lung Cancer Res. 9(Suppl 1), S39–S46
(2020).
6. Cheresh, P. et al. SIRT3 Overexpression Ameliorates Asbestos-Induced Pulmonary Fibrosis, mt-DNA Damage and Lung Fibrogenic
Monocyte Recruitment. Int. J. Mol. Sci. 22(13), 6856 (2021).
7. National Institute for Occupational Safety and Health (NIOSH): Asbestos fibers and other elongate mineral particles: State of
the science and roadmap for research, Revised Edn., Department of Health and Human Services, DHHS (NIOSH) Publication
No. 2011–159, Current Intelligence Bulletin, 62, 1–159. https://www.cdc.gov/niosh/docs/2011-159/default.html. Last asccess: 16
January 2021, 2011.
Scientific Reports | (2022) 12:1782 | https://doi.org/10.1038/s41598-022-05802-x 11
Vol.:(0123456789)www.nature.com/scientificreports/
8. U.S. Department of Labor Occupational exposure to asbestos. Federal Regulation, 40, 47652–47665 (1975)
9. Campbell, W.J., Blake, R.L., Brown, L.L., Cather, E.E., Sjoberg, J.J., Selected silicate minerals and their asbestiform varieties: Min-
eralogical definitions and identification-characterization. Bureau of Mines Information Circular IC-8751, Bureau of Mines. (1977)
10. Case, B. W., Abraham, J. L., Meeker, G., Pooley, F. D. & Pinkerton, K. E. Applying definitions of “asbestos” to environmental and
“low dose” exposure levels and health effects, particularly malignant mesothelioma. J. Toxicol. Environ. Health Part B 14, 3–39
(2011).
11. Williams, C., Dell, L., Adams, R., Rose, T. & Van Orden, D. State-of-the-science assessment of non-asbestos amphibole exposure:
Is there a cancer risk?. Environ. Geochem. Health 35, 357–377 (2013).
12. Della Ventura, G. et al. Infra Red spectroscopy of the regulated asbestos amphiboles. Minerals 8(9), 413 (2018).
13. Baumann, F., Ambrosi, J. P. & Carbone, M. Asbestos is not just asbestos: an unrecognized health hazard. Lancet Oncol. 14, 576–578
(2013).
14. Dodson, R. F., Atkinson, M. A. & Levin, J. L. Asbestos fiber length as related to potential pathogenicity: a critical review. Am. J.
Ind. Med. 44, 291–297 (2003).
15. Suzuki, Y., Yuen, S. R. & Ashley, R. Short, thin asbestos fibers contribute to the development of human malignant mesothelioma:
pathological evidence. Int. J. Hyg. Environ. Health 208, 201–210 (2005).
16. Lemen, R.A., Epidemiology of asbestos-related diseases and the knowledge that led to what is known today. Asbestos, risk assess-
ment, epidemiology, and health effects (Dodson, R.F., Hamnar, S.P., editors). CRC Press, Boca Raton, Florida, USA. 201–308 (2006)
17. Roggli, V. L. The so-called short-fiber controversy literature review and critical analysis. Arch. Pathol. Lab. Med. 139, 1052–1057
(2015).
18. Oberdörster, G. & Graham, U. Predicting EMP hazard: Lessons from studies with inhaled fibrous and non-fibrous nano- and
micro-particles. Toxicol. Appl. Pharmacol. 361, 50–61 (2018).
19. Germine, M. & Puffer, J. H. Analytical transmission electron microscopy of amosite asbestos from South Africa. Arch. Environ.
Occup. H. 75, 36–44 (2019).
20. Vigliaturo, R. et al. Multi-scale characterization of glaucophane from Chiavolino (Biella, Italy): Implications for international
regulations on elongate mineral particles. Eur. J. Mineral. 33, 77–112. https://doi.org/10.5194/ejm-33-77-2021 (2021).
21. Weiss, W. Asbestosis: A marker for the increased risk of lung cancer among workers exposed to asbestos. Chest 115, 536–549
(1999).
22. Huang, S. X., Jaurand, M. C., Kamp, D. W., Whysner, J. & Hei, T. K. Role of mutagenicity in asbestos fibre-induced carcinogenicity
and other diseases. J. Toxicol. Environ. Health Part B 14, 179–245 (2011).
23. Mossman, B. T. et al. Pulmonary endpoints (lung carcinomas and asbestosis) following inhalation exposure to asbestos. J. Toxicol.
Environ. Health Part B 14, 76–121 (2011).
24. Liu, G., Cheresh, P. & Kamp, D. W. Molecular basis of asbestos-induced lung disease. Annu. Rev. Pathol. 8, 161–187 (2013).
25. Schoonen, M. A. A. et al. Mineral-induced formation of reactive oxygen species. Rev. Mineral. Geochem. 64, 179–221 (2006).
26. Hiroshima, K. & Suzuki, Y. Characterization of asbestos bodies and uncoated fibres in lungs of hamsters. J. Electron. Microsc.
(Tokyo) 42(1), 41–47 (1993).
27. Langer, A. M., Rubin, I. B. & Selikoff, I. J. Chemical characterization of asbestos body cores by electron microprobe analysis. J.
Histochem. Cytochem. 20(9), 723–734 (1972).
28. Roggli, V.L., Asbestos Bodies and Nonasbestos Ferruginous Bodies. In: Roggli V.L., Sporn T.A., Oury T.D. (eds) Pathology of
Asbestos-Associated Diseases. Springer, New York, NY (2004)
29. Di Giuseppe, D. et al. Mineral fibres and asbestos bodies in human lung tissue: A case study. Minerals 9(10), 618 (2019).
30. Bardelli, F., Veronesi, G., Capella, S., Bellis, D., Charlet, L., Cedola, A., Belluso, E., New insights on the biomineralisation process
developing in human lungs around inhaled asbestos fibres. Scientific Reports, 7, Article number: 44862 (2017)
31. Germine, M. & Puffer, J. H. Analytical Transmission Electron Microscopy of amphibole fibers from the lungs of Quebec miners.
Arch. Environ. Occup. Health 70(6), 323–331 (2015).
32. Vigliaturo, R., Pollastri, S., Gieré, R., Gualtieri, A. F. & Dražić, G. Experimental quantification of the Fe-valence state at amosite-
asbestos boundaries using acSTEM dual-electron energy-loss spectroscopy. Am. Miner. 104(12), 1820–1828 (2019).
33. Fantauzzi, M. et al. Combined use of X-ray photoelectron and Mössbauer spectroscopic techniques in the analytical characteriza-
tion of iron oxidation state in amphibole asbestos. Anal. Bioanal. Chem. 396, 2889–2898 (2010).
34. Pósfai, M. et al. Crystal-size distributions and possible biogenic origin of Fe sulfides. Eur. J. Mineral. 13, 691–703 (2001).
35. Arató, B. et al. Crustal-size and shape distributions of magnetite from uncultured magnetotactic bacteria as a potential biomarker.
Am. Miner. 90, 1233–1241 (2005).
36. Vasiliev, I. et al. Putative greigite magnetofossils from the Pliocene epoch. Nat. Geosci. 1, 782–786 (2008).
37. Pósfai, M., Kasama, T. & Dunin-Borkowski, R. E. Biominerals at the nanoscale: transmission electron microscopy methods for
studying the special properties of biominerals. EMU Not. Mineral. 14, 377–435 (2013).
38. Pacella, A. et al. Dissolution reaction and surface iron speciation of UICC crocidolite in buffered solution at pH 74: A combined
ICP-OES, XPS and TEM investigation. Geochim. Cosmochim. Acta 127, 221–232 (2014).
39. Pacella, A. et al. Surface alteration mechanism and topochemistry of iron in tremolite asbestos: A step toward understanding the
potential hazard of amphibole asbestos. Chem. Geol. 405, 28–38 (2015).
40. Andreozzi, G. B., Pacella, A., Corrazzari, I., Tomatis, M. & Turci, F. Surface reactivity of amphibole asbestos: A comparison between
crocidolite and tremolite. Sci. Rep. 7, 14696 (2017).
41. Pacella, A. et al. Surface and bulk modifications of amphibole asbestos in mimicked gamble’s solution at acidic PH. Sci. Rep. 11,
14249 (2021).
42. Vigliaturo, R. et al. Mineralogical characterization and dissolution experiments in gamble’s solution of tremolitic amphibole from
Passo di Caldenno (Sondrio, Italy). Minerals 8(12), 557 (2018).
43. Harrington, A. D., Tsirka, S. E. & Schoonen, M. A. A. Quantification of particle-induced inflammatory stress response: a novel
approach for toxicity testing of earth materials. Geochem. Trans. 13(4), 1 (2012).
44. Mossman, B. T., Kessler, J. B., Ley, B. W. & Craighead, J. E. Interaction of crocidolite asbestos with hamster respiratory mucosa in
organ culture. Lab. Invest. 36, 131–139 (1977).
45. Mossman, B. T., Adler, K. B. & Craighead, J. E. Interaction of carbon particles with tracheal epithelium in organ culture. Environ.
Res. 16, 110–122 (1978).
46. Watson, A. Y. & Brain, J. D. Uptake of iron oxide aerosols by mouse airway epithelium. Lab. Invest. 40, 450–459 (1979).
47. Weiner, S., Dove, P.M. An Overview of Biomineralization Processes and the Problem of the Vital Effect. Reviews in Mineralogy
and Geochemistry (ed. Dove, P.M., De Yoreo, J.J., Weiner, S.), 54, 1–29 (2003)
48. Roggli, V.L., Pathology of human asbestosis: A critical review. In: Advances in Pathology, 2, 31–60 (C.M. Fenoglio-Preiser, editor),
Chicago, Illinois, USA (1989)
49. Stewart, M. J. & Haddow, A. C. Demonstration of the peculiar bodies of pulmonary asbestosis (“asbestos bodies”) in material
obtained by lung puncture and in the sputum. J. Pathol. Bacteriol. 32(172), 1 (1929).
50. Marchand, F. Ueber eigenttimliche Pigmentkristalle in den lunge. Verhandlungen der Deutschen Gesselschaft fur Pathologie 10,
223–228 (1906).
51. Fahr, T. Demonstrationen: Preparate und microphotogrammes von einen falle von pneumokoniose. Munchner Medizinische
Wochenschrift 11, 625 (1914).
Scientific Reports | (2022) 12:1782 | https://doi.org/10.1038/s41598-022-05802-x 12
Vol:.(1234567890)www.nature.com/scientificreports/
52. Cooke, W. E. Fibrosis of the lungs due to the inhalation of asbestos dust. BMJ II, 147 (1924).
53. Gloyne, S. R. The presence of the asbestos fibre in the lesions of asbestos workers. Tubercle 10(9), 404–407 (1929).
54. Churg, A. M. & Warnock, M. L. Asbestos and other ferruginous bodies: their formation and clinical significance. Am. J. Pathol.
102, 447–456 (1981).
55. Stanton, M. F. et al. Relation of particle dimension to carcinogenicity in amphibole asbestoses and other fibrous minerals. J. Natl
Cancer Inst. 67, 965–975 (1981).
56. World Health Organization (WHO), Determination of airborne fibre number concentrations; a recommended method, by phase
contrast optical microscopy (membrane filter method), World Health Organization: Geneva, Switzerland, 1–53 (1997)
57. Richter, G. M. Electron microscopy of hemosiderin: presence of ferritin and occurrence of crystalline lattices in hemosiderin
deposits. J. Biophys. Chem. 4, 55–58 (1958).
58. Davis, J. M. G. Electron microscope studies of asbestosis in man and animals. Ann. NY Acad. Sci. 132, 98–111 (1965).
59. Suzuki, Y. & Churg, J. Structure and development of the asbestos body. Am. J. Pathol. 55, 79–107 (1969).
60. Suzuki, Y. & Churg, J. Formation of the asbestos body a comparative study with three types of asbestos. Environ. Res. 3, 107–118
(1970).
61. Haque, A. K. & Kanz, M. F. Asbestos bodies in children’s lungs: an association with sudden infant death syndrome and bronchopul-
monary dysplasia. Arch. Pathol. Lab. Med. 112, 514–518 (1988).
62. Koerten, H. K., Hazekamp, J., Kroon, M. & Daems, W. T. Asbestos body formation and iron accumulation in mouse peritoneal
granulomas after the introductionof crocidolite asbestos fibres. Am. J. Pathol. 136, 141–157 (1990).
63. Morgan, A. & Holmes, A. Concentrations and dimensions of coated and uncoated asbestos fibres in the human lung. Br. J. Ind.
Med. 37, 25–32 (1980).
64. Capella, S., Belluso, E., Bursi Gandolfi, N., Tibaldi, E., Mandrioli, D., Belpoggi, F., In vivo biological activity of mineral fibres. In
Mineral Fibres: Crystal Chemistry, Chemical-Physical Properties, Biological Interaction and Toxicity; Gualtieri, A.F., Ed.; European
Mineralogical Union: London, UK, 307–346 (2017)
65. Harrison, P. M., Fischbach, F. A. & Hoy, T. G. Ferric oxyhydroxide core of ferritin. Nature 216, 1118–1190 (1967).
66. Meyer, J., Private communication. Environmental Research Laboratories, T.N.O., Delft, Holland (1970)
67. Pascolo, L. et al. Synchrotron soft X-Ray imaging and fluorescence microscopy reveal novel features of asbestos body morphology
and composition in human lung tissue. Partic. Fibre Toxicol. 8, 7–17 (2011).
68. Bursi Gandolfi, N., Gualtieri, A. F., Pollastri, S., Tibaldi, E. & Belpoggi, F. Assessment of asbestos body formation by high resolution
FEG-SEM after exposure of Sprague-Dawley rats to chrysotile, crocidolite, or erionite. J. Hazard. Mater. 306, 95–104 (2015).
69. Pollastri, S. et al. The zeta potential of mineral fibres. J. Hazard. Mater. 276, 469–479 (2014).
70. Vigliaturo, R., Capella, S., Rinaudo, C. & Belluso, E. “Rinse and trickle”: a protocol for TEM preparation and investigation of
inorganic fibers from biological material. Inhalation Toxicol. 28(8), 357–363 (2016).
71. Williams, M. G. Jr., Dodson, R. F., Corn, C. & Hurst, G. A. A procedure for the isolation of amosite asbestos and ferruginous bodies
from lung tissue and sputum. J. Toxicol. Environ. Health 10, 627–638 (1982).
72. Vigliaturo, R. et al. Micro- and nano-scale mineralogical characterization of Fe(II)-oxidizing bacterial stalks. Geobiology 18(5),
606–618 (2020).
Acknowledgements
This research was supported by a Rotary Global Grant (GG1640842) awarded to Dr. Ruggero Vigliaturo, grant
P2-0393 from Slovenian Research Agency assigned to Dr. Prof. Goran Dražić, grant and P1-01840391 assigned
to University of Ljubljana and grant P4-0165 to National Institute of Biology (Prof. Gregor Anderluh), both from
Slovenian Research Agency. The study was further supported in part by grants P30-ES013508 and P42-ES023720
awarded by the National Institute of Environmental Health Sciences (NIEHS). The findings are not the official
opinions of NIEHS or NIH. Giancarlo Della Ventura was supported by a grant to the Department of Geologi-
cal Sciences, Roma Tre University (MIUR-Italy Dipartimenti di Eccellenza, ARTICOLO 1, COMMI 314 – 337
LEGGE 232/2016). Thanks are due to Marcello Serracino (CNR-IGAG, Rome) for helping with collection of
EPMA data and Federico Galdenzi (University Roma of Tre) for helping with Raman spectroscopy. Cristiano
Ferraris (Muséum National d’Histoire Naturelle, Paris) allowed us to select the studied samples from the Museum
collection.
Author contributions
R.V.: Conceptualization, Methodology, Validation, Formal Analysis, Investigation, Resources, Data curation,
Writing—Original Draft, Review & Editing, Visualization, Supervision, Project administration, Funding acquisi-
tion; M.J.: Methodology, Validation, Formal Analysis, Investigation, Resources, Data curation, Writing—Original
Draft, Review & Editing, Visualization; G.D.: Conceptualization, Methodology, Validation, Formal Analysis,
Investigation, Resources, Data curation, Writing—Original Draft, Review & Editing, Visualization, Supervision,
Project administration, Funding acquisition; M.P.: Methodology, Validation, Resources, Writing—Original Draft,
Review & Editing, Visualization, Supervision, Project administration, Funding acquisition; M.T.Z.: Methodol-
ogy, Validation, Formal Analysis, Investigation, Resources, Data curation, Writing—Original Draft, Review &
Editing, Visualization, Supervision, Funding acquisition; G.D.V.: Methodology, Validation, Formal Analysis,
Investigation, Resources, Data curation, Writing—Original Draft, Review & Editing, Visualization, Funding
acquisition; G. J. R.: Methodology, Validation, Formal Analysis, Investigation, Resources, Data curation, Review
& Editing N. Ž.: Methodology, Validation, Formal Analysis, Investigation, Resources, Data curation, Review &
Editing, Visualization; S. C.: Methodology, Validation, Formal Analysis, Investigation, Resources, Data cura-
tion, Writing—Review & Editing, Visualization, Supervision; R. G.: Methodology, Validation, Formal Analysis,
Resources, Data curation, Writing—Original Draft, Writing—Review & Editing, Visualization, Supervision,
Funding acquisition.
Competing interests
The authors declare no competing interests.
Additional information
Supplementary Information The online version contains supplementary material available at https://doi.org/
10.1038/s41598-022-05802-x.
Scientific Reports | (2022) 12:1782 | https://doi.org/10.1038/s41598-022-05802-x 13
Vol.:(0123456789)You can also read