Multiphoton microscopy can visualize zonal damage and decreased cellular metabolic activity in hepatic ischemia-reperfusion injury in rats
←
→
Page content transcription
If your browser does not render page correctly, please read the page content below
Multiphoton microscopy can visualize
                 zonal damage and decreased cellular
                 metabolic activity in hepatic
                 ischemia-reperfusion injury in rats

                 Camilla A. Thorling
                 Xin Liu
                 Frank J. Burczynski
                 Linda M. Fletcher
                 Glenda C. Gobe
                 Michael S. Roberts

Downloaded From: https://www.spiedigitallibrary.org/journals/Journal-of-Biomedical-Optics on 19 Jun 2022
Terms of Use: https://www.spiedigitallibrary.org/terms-of-use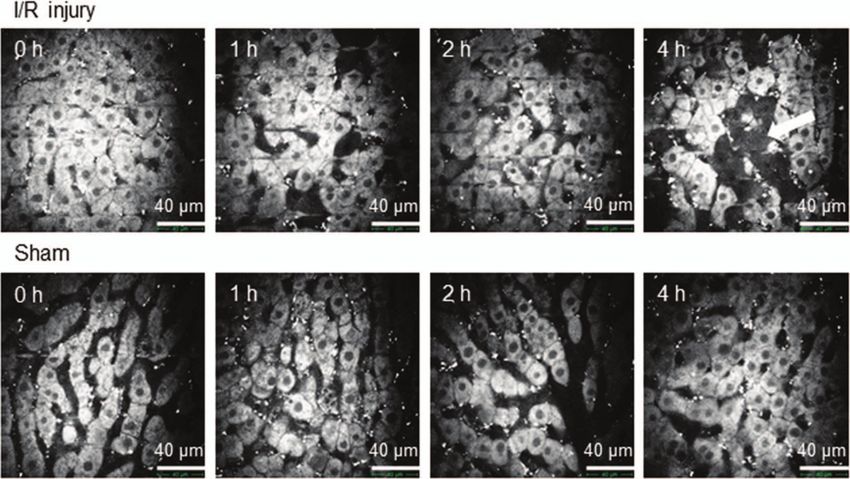
Journal of Biomedical Optics 16(11), 116011 (November 2011)

                Multiphoton microscopy can visualize zonal damage
                and decreased cellular metabolic activity in hepatic
                ischemia-reperfusion injury in rats
                Camilla A. Thorling,a,b Xin Liu,a Frank J. Burczynski,c Linda M. Fletcher,a,d Glenda C. Gobe,a and Michael S. Robertsa,b
                a The University of Queensland, School of Medicine, Woolloongabba, Queensland, 4102, Australia
                b University of South Australia, School of Pharmacy and Biomedical Sciences, Adelaide, Australia
                c University of Manitoba, Faculty of Pharmacy, Canada
                d Princess   Alexandra Hospital, Department of Gastroenterology and Hepatology, Brisbane, Australia

                                Abstract. Ischemia-reperfusion (I/R) injury is a common occurrence in liver surgery. In orthotopic transplantation,
                                the donor liver is exposed to periods of ischemia and when oxygenated blood is reintroduced to the liver, oxidative
                                stress may develop and lead to graft failure. The aim of this project was to investigate whether noninvasive
                                multiphoton and fluorescence lifetime imaging microscopy, without external markers, were useful in detecting
                                early liver damage caused by I/R injury. Localized hepatic ischemia was induced in rats for 1 h followed by 4 h
                                reperfusion. Multiphoton and fluorescence lifetime imaging microscopy was conducted prior to ischemia and up
                                to 4 h of reperfusion and compared to morphological and biochemical assessment of liver damage. Liver function
                                was significantly impaired at 2 and 4 h of reperfusion. Multiphoton microscopy detected liver damage at 1 h of
                                reperfusion, manifested by vacuolated cells and heterogeneous spread of damage over the liver. The damage was
                                mainly localized in the midzonal region of the liver acinus. In addition, fluorescence lifetime imaging showed
                                a decrease in cellular metabolic activity. Multiphoton and fluorescence lifetime imaging microscopy detected
                                evidence of early I/R injury both structurally and functionally. This provides a simple noninvasive technique useful
                                for following progressive liver injury without external markers. C 2011 Society of Photo-Optical Instrumentation Engineers (SPIE).
                                [DOI: 10.1117/1.3647597]

                                Keywords: liver function; multiphoton microscopy; fluorescence lifetime imaging microscopy; histology; nicotinamide adenine dinu-
                                cleotide; zonation.
                                Paper 11298R received Jun. 13, 2011; revised manuscript received Sep. 1, 2011; accepted for publication Sep. 19, 2011; published
                                online Oct. 27, 2011.

                1 Introduction                                                                     brane protein, which mediates electron transfer from NADH to
                Ischemia-reperfusion (I/R) injury of the liver is a common phe-                    oxygen and results in H + being transported to the cytoplasm.
                nomenon and a major cause of morbidity and mortality in                            This yields a gradient that is necessary for ATP synthesis and
                many clinical situations, including hepatic resection and liver                    occurs only in the presence of oxygen.9 Thus, bound NADH is
                transplantation.1, 2 Cellular damage in I/R injury is intensified                  involved in ATP synthesis in aerobic conditions.9 The free form
                when the transplanted liver is reperfused with blood after pro-                    of NADH is mainly located in the cytoplasm, where glycolysis
                longed period(s) of ischemia in the donated liver.3 During or-                     occurs, producing ATP without oxygen.10 Accordingly, free and
                thotopic liver transplantation, oxygenated blood is reintroduced                   protein-bound NADH are involved in the production of ATP and
                to the liver resulting in oxidative stress through free radical                    changes in the ratio between the two forms gives insight into
                production.4 Hepatic injury in the transplanted liver results in                   the metabolic state of a cell.9 The metabolic state can be deter-
                intracellular adenosine triphosphate (ATP) loss, increased mi-                     mined in vivo through the recent advances in microscopy and
                crovascular permeability, inflammatory cell infiltration, and po-                  the inherent fluorescent properties of NADH, as has been shown
                tentially, cell death in the forms of apoptosis and necrosis.5, 6                  in assessing the viability of excised human skin stored under
                As a consequence, oxidative stress may lead to graft failure and                   various conditions.11, 12
                rejection of the transplanted liver.6                                                 Multiphoton microscopy (MPM) has been utilized for the vi-
                    The reduced form of nicotinamide adenine dinucleotide                          sualization of fluorescent molecules within the cell,13 including
                (NADH) is essential in the production of ATP as an electron                        measuring the absorption of nanoparticles into human skin.14
                donor and a coenzyme.7–9 ATP can be produced in two ways:                          MPM enables high-resolution imaging of physiology, morphol-
                1. through glycolysis, an anaerobic process occurring in the cy-                   ogy, and cell-cell interactions in live animals or intact tissue.15
                toplasm; or 2. through oxidative phosphorylation, an aerobic                       The effective resolution in MPM is far superior to confocal
                process occurring in the mitochondria.8 NADH can be free or                        microscopy because fluorescence only arises from the focus.15
                protein-bound where binding occurs to a mitochondrial mem-                         Photodamage in MPM is therefore limited to the focal plane,
                                                                                                   however, the possibility of damage in this region still remains.15
                                                                                                   Confocal microscopy, however, uses single photon excitation
                Address all correspondence to: Michael S. Roberts, University of Queensland,
                                                                                                   resulting in broad exposure to high-energy UV and visible
                Therapeutics Research Centre, School of Medicine, Princess Alexandra Hospital,
                Boulevard 35 Lv1, Ipswich Road, Woolloongabba, Queensland, 4102, Australia;
                Tel: + 61 7 3176 5803; Fax: + 61 3176 5806; E-mail: m.roberts@uq.edu.au.           1083-3668/2011/16(11)/116011/8/$25.00
                                                                                                                                         C 2011 SPIE

                Journal of Biomedical Optics                                                116011-1                                      November 2011 r Vol. 16(11)

Downloaded From: https://www.spiedigitallibrary.org/journals/Journal-of-Biomedical-Optics on 19 Jun 2022
Terms of Use: https://www.spiedigitallibrary.org/terms-of-use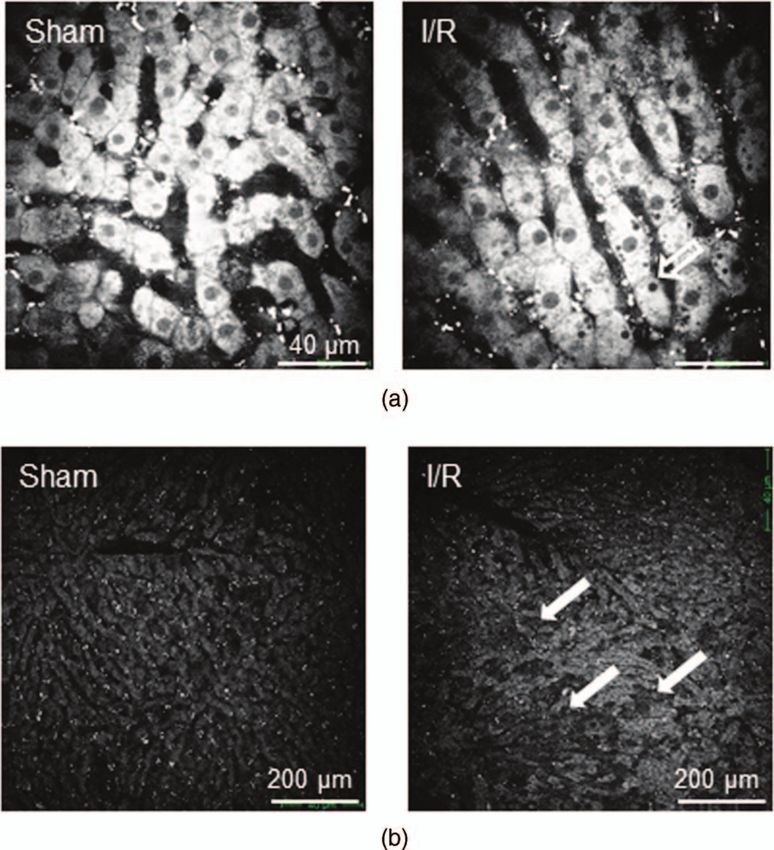
Thorling et al.: Multiphoton microscopy can visualize zonal damage and decreased...

                 excitation sources in the specimen above the focus plane, which                    used in all experiments. Studies were approved by the Animal
                 could damage photosensitive samples.16 MPM is also better                          Ethics Committee of the University of Queensland and were
                 suited for deep-tissue imaging compared to confocal, because                       carried out in accordance with the legislation of Australian au-
                 the infrared light used to generate multiphoton excitation is less                 thorities for the care and use of experimental animals. Animals
                 scattered in biological samples.16 This results in a tightly focused               were housed in the Biological Resource Facility at the Princess
                 beam with high-photon flux enabling deeper imaging into thick                      Alexandra Hospital, where the temperature is maintained at 20
                 tissue while restricting photobleaching and phototoxicity.17, 18                   ± 1◦ C and humidity at 60 to 75%, with artificial light for 12 h
                 The two or more low energy photons in MPM are simultane-                           (7 am to 7 pm) daily. All animals had unlimited access to food
                 ously absorbed in order to excite an electron from a fluorescent                   and water.
                 molecule.19, 20 The photons have similar energies and produce
                 an excitation equivalent to single-photon absorption possessing
                 twice the energy.15 The images originate at the beam focus with                    2.2 Surgical Procedures
                 no out of focus background present.17                                              Rats were anaesthetized by an initial intraperitoneal injection
                     Fluorescence lifetime imaging microscopy (FLIM) is based                       of xylazine 10 mg/kg and ketamine hydrochloride 80 mg/kg.
                 on the average time it takes for an electron to return from the                    Anaesthesia was maintained throughout the experiment by in-
                 excited state to the ground state. It adds to the information from                 traperitoneally administering ketamine (2.2 mg/100 g) and xy-
                 MPM by making it possible to resolve multiple lifetimes from                       lazine (0.25 mg/100 g). Body temperature was controlled by
                 decay data.21 The advantage of FLIM is that it is dependent                        placing them on a heated pad set to 37◦ C. A midline laparo-
                 on excited state reactions, but independent of the concentration                   tomy was performed with the left lobe of the liver exposed for
                 of the fluorescent molecule.22 The concept of FLIM has been                        imaging.
                 simply explained by Lakowicz et al. Briefly, the fluorescence in-
                 tensity cannot reveal any environmental changes, such as protein
                 binding or pH, but FLIM can.23 Therefore, FLIM provides de-                        2.3 I/R Model
                 tails about the structure and dynamics of fluorescent molecules12
                                                                                                    70% ischemia was induced by clamping the portal vein, hep-
                 and is sensitive to changes in conformation, molecular interac-
                                                                                                    atic artery, and bile duct supplying the median and left lobes
                 tions, ion concentrations, pH9 and oxygen concentrations.24 Our
                                                                                                    of the liver using a microvascular clamp. After 60 min of par-
                 previous results using MPM-FLIM focused on nanoparticle and
                                                                                                    tial ischemia, the clamp was removed to allow reperfusion in
                 solvent uptake in both excised14, 25–27 and in vivo28, 29 skin. In
                                                                                                    the liver. Sham rats (controls) underwent the same procedures
                 addition, this method has been used to study fluorescein distribu-
                                                                                                    without clamping the vessels.
                 tion and metabolism in the liver in vivo in rats.14, 30 In the present
                 study, we utilized the autofluorescent properties of the liver cells
                 to investigate cellular damage progression in I/R injury.
                                                                                                    2.4 Tissue Collection
                     NADH has fluorescent properties with peak absorption at
                 350 nm and peak emission of approximately 450 nm.10 The                            Blood (0.2 ml) was collected from the inferior vena cava using
                 free and protein-bound forms of NADH have similar excita-                          a 30-gauge needle before ischemia induction and at 2 and 4 h
                 tion and emission wavelengths, but can be separated using their                    of reperfusion. After the animal was euthanized at the end of
                 distinct fluorescence lifetimes of 0.4 to 0.5 and 2.0 to 2.5 ns,                   4 h reperfusion, the left and median lobes were excised, portions
                 respectively.10 Nicotinamide adenine dinucleotide phosphate                        were either snap frozen in liquid nitrogen and stored at − 70◦ C
                 (NADPH) is another reducing agent used in biosynthesis of fatty                    for later analysis of glutathione (GSH), or immersed into 10%
                 acids and steroids. NADH and NADPH have the same excita-                           buffered formalin for histological assessment.
                 tion and emission wavelengths and fluorescence lifetimes, and
                 cannot be spectrally resolved.31 Hence, NADH and NADPH
                 are referred to as NAD(P)H in this paper. However, NADPH                           2.5 MPM-FLIM
                 has lower fluorescence intensity, lower concentration, and is                      MPM was performed using a DermaInspect system (Jen-
                 roughly constant with respect to metabolic perturbations com-                      Lab GmbH, Jena, Germany) equipped with an ultrashort (85
                 pared to NADH.32 The influence of NADPH is therefore con-                          femtosecond pulse width) pulsed mode-locked 80-MHz Tita-
                 sidered very low, although not insignificant. We have previously                   nium:Sapphire MaiTai laser (Spectra Physics, Mountain View,
                 studied NAD(P)H in ischemic necrosis of the skin and showed                        California). For FLIM, a time correlated single photon counting
                 that MPM-FLIM was useful for noninvasive imaging and to                            830 detector (Becker & Hickl, Berlin, Germany) was incor-
                 monitor the metabolic state of the skin.11                                         porated into the MPM system. The excitation wavelength was
                     Thus, the aim of this study was to investigate whether MPM                     set to 740 nm for FLIM (emission range 350 to 450 nm) and
                 and FLIM are useful tools in detecting disease progression in                      780 nm for imaging of autofluorescence. For imaging of the
                 I/R injury, without the need for external markers.                                 liver, the left lobe was placed on a small metal plate, attached to
                                                                                                    an adjustable stand that could be elevated or lowered as required.
                                                                                                    The plate was slightly raised above the intraperitoneal cavity to
                                                                                                    minimize pressure on the organs underneath. The laser power
                 2 Materials and Methods
                                                                                                    was 15 mW and a BG39 (350 to 650 nm) emission filter was
                 2.1 Animals                                                                        used. The acquisition time for obtaining the images was 13.4 s
                 Male Wistar rats, purchased from the Animal Resource Centre                        per frame. Images were taken pre-ischemia induction, during
                 (Perth, Western Australia), weighing approximately 300 g were                      ischemia, and at 0, 1, 2, and 4 h of reperfusion.

                 Journal of Biomedical Optics                                              116011-2                                      November 2011 r Vol. 16(11)

Downloaded From: https://www.spiedigitallibrary.org/journals/Journal-of-Biomedical-Optics on 19 Jun 2022
Terms of Use: https://www.spiedigitallibrary.org/terms-of-use
Thorling et al.: Multiphoton microscopy can visualize zonal damage and decreased...
2.5.1 Data analysis Table 1 Alanine aminotransferase before (pre) and after ischemia in-
duction at 2 and 4 h of reperfusion. [* p < 0.05 versrus sham, # p
FLIM images were analyzed using SPCImage (Becker & < 0.05 versus pre. Mean ( ± SEM).]
Hickl, Berlin, Germany). Lifetime distributions for NAD(P)H
were obtained by fitting photon count F(t) profiles from each
ALT (U/L) ALT (U/L) ALT (U/L)
image to a bi-exponential decay function (F(t) = α1 e−t/τ1
+ α2 e−t/τ2 ). The reduced chi-square coefficient was used to in- Pre 2h 4h
dicate goodness-of-fit. Two lifetimes, τ 1 and τ 2 represent the
“fast” and “slow” lifetimes of free and protein-bound NAD(P)H, I/R injury (n = 6) 50 ( ± 5) 1120 ( ± 308)*# 1820 ( ± 600)*#
respectively. The amplitudes α 1 and α 2 represent the relative
concentration fraction of NAD(P)H, where α1 + α2 = 100.12 Sham (n = 4) 40 ( ± 7) 40 ( ± 17) 60 ( ± 20)
The ratio of a1 and a2 is the best way to determine the
free and protein-bound state of NAD(P)H, therefore show-
ing the metabolic changes of the cell. In this study the ac- 2.7 Serum Biochemical Measurements
tual ratio of α 1 and α 2 is shown. In addition, the ratio of
α 1 and α 2 is also presented as pseudo color images exported Plasma concentration of alanine aminotransferase (ALT) was
from the analyzing software, where a change in color indi- measured using a Hitachi 747 analyzer (Hitachi Ltd., Tokyo,
cates a change in ratio. Actual changes in lifetimes, τ 1 and Japan) in the Pathology Department at Princess Alexandra
τ 2 , are not shown in this study. For statistical analysis, stu- Hospital, Brisbane.
dent t-test for paired samples and one-way ANOVA with
Tukey’s adjustment for multiple comparisons were used. Re- 2.8 Determination of Total Glutathione (GSH)
sults were considered statistically significant with a p-value
GSH was determined using the Glutathione assay kit (Cayman
≤ 0.05.
Chemical Company). The kit is based on the reaction between
GSH and DTNB [5,5 -dinitro-bis-2-(nitrobenzoic acid)], which
produces a yellow colored TNB (5-thio-2-nitrobenzoic acid).
2.6 Histopathological Analyses The production of TNB is directly proportional to the concen-
Staining of haematoxylin and eosin (H&E), ApopTag (for apop- tration of GSH.
tosis) and immunohistochemistry for ED1 (for macrophages)
was performed according to standard procedure. Visualization of
ApopTag and ED1 localization was facilitated with diaminoben-
3 Results
zidine hydrochloride, which stained brown in positively-labeled 3.1 Alanine Transaminase (ALT)
cells. Fixed liver was sub-sectioned onto each slide (two to three The model of ischemia used resulted in extensive liver dam-
sections at 5 μm from different slices of each liver), stained, age as measured by increased liver ALT. ALT was significantly
and then scanned using an Aperio ScanScope XT slide scan- (p < 0.05) increased at 2 (1120 ± 308 U/L) and 4 h (1820
ning system (Aperio Technologies Inc., Vista, California) at ± 600 U/L) of reperfusion compared to sham (Table 1).
20× magnification. The Aperio ImageScope V10.2. software
was used to visualize and score the slides. Severity of tissue
damage was quantified in five areas per slide by two indepen- 3.2 Oxidative Stress
dent personnel using a previously described method.33 Three As a measure of oxidative stress, GSH concentration at 4 h
sets of parameters were studied: a. cellular degeneration defined I/R was determined in excised livers. GSH concentration was
as cellular swelling and vacuolation, and reversible changes in significantly (p < 0.05) reduced in the I/R group compared to
nuclear density; b. infiltration of neutrophils, monocytes, and sham (Table 2).
macrophages; and c. necrosis defined by cells showing pykno-
sis, karyorrhexis, karyolysis, and cytolysis. These parameters
were graded as follows. Grade 1: no change from normal; Grade 3.3 Histopathological Findings
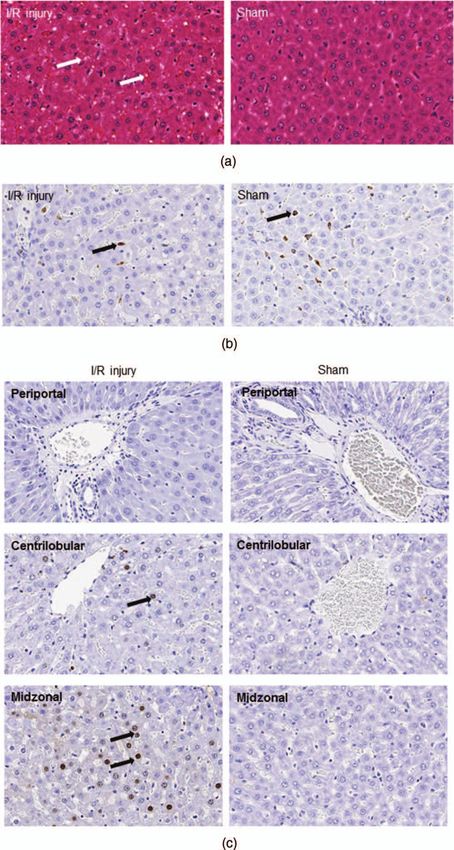
2: a limited number of isolated cells (up to 5% of cells); Grade Mild to moderate structural alterations in the liver were found in
3: groups of cells (5 to 30% of the total cell number); and the I/R injury group [Fig. 1(a)]. Cellular vacuolation was present
Grade 4: diffuse cell damage (higher than 30% of the total cell in all sections from the I/R injury group, with scores from 2 to
number). In addition, zonal localization of tissue damage was 4 for cell degeneration. Some inflammatory cell infiltration was
recorded.
Using immunohistochemistry for ED1, the number of mono-
Table 2 Levels of oxidative stress were measured by glutathione con-
cytes and macrophages were identified by counting ED1- centration in the liver at 4 h of reperfusion in I/R injury and compared
positive cells in the sinusoids in 10 random fields per to sham rats ( ± SEM). (* p < 0.05 versus sham.)
slide. Apoptotic cells were identified enzymatically using
ApopTag labeling, and positive nuclei were counted in 10
Glutathione concentration (μmoles/g liver)
random fields per region per liver slide. The three differ-
ent regions were 1. periportal (cells surrounding the portal I/R injury (n = 6) 1460 ( ± 100)
tract), 2. centrilobular (cells surrounding the central vein), and
3. midzonal (cells between the periportal and centrilobular Sham (n = 5) 550 ( ± 130)*
zones).
Journal of Biomedical Optics 116011-3 November 2011 r Vol. 16(11)
Downloaded From: https://www.spiedigitallibrary.org/journals/Journal-of-Biomedical-Optics on 19 Jun 2022
Terms of Use: https://www.spiedigitallibrary.org/terms-of-use
Thorling et al.: Multiphoton microscopy can visualize zonal damage and decreased...

                 Table 3 Semi-quantitative categorization of the morphological injury
                 parameters in liver tissue after I/R injury. Scoring from 1 to 4, where 1
                 is no and 4 is a major change ( ± SEM). (* p < 0.05 versus sham.)

                                                            Sham                I/R injury

                                                           (n = 5)               (n = 6)

                 Cell degeneration                      1.1 ( ± 0.08)         2.0 ( ± 0.3)*

                 Inflammatory cell infiltration

                    –Neutrophils                          1.0 ( ± 0)          1.3 ( ± 0.1) *

                    –Monocytes/macrophages                1.0 ( ± 0)          1.4 ( ± 0.1)*

                 Necrosis                                 1.0 ( ± 0)           1.3 ( ± 0.2)

                 present in sham and I/R rats at 4 h of reperfusion (Table 3).
                 There was no statistical difference in the number of monocytes
                 and macrophages, stained with ED1, as seen in Fig. 1(b). The
                 number of monocytes and macrophages tended to be slightly
                 decreased in I/R injury (240 ± 50) compared to the sham group
                 (310 ± 70), however this was not significantly different.
                    The number of apoptotic cells was statistically increased in
                 the centrilobular and midzonal regions compared to the same
                 regions in the sham group [Fig. 1(c), Table 4] (p < 0.05). There
                 was a slight increase in the number of apoptotic cells in the
                 periportal region, however, not statistically significant (Table 4).

                 3.4 MPM-FLIM
                 The autofluorescence of the liver in vivo was imaged with high
                 resolution at 0, 1, 2, and 4 h of reperfusion. Figure 2 shows
                 representative images from one rat in the I/R injury group and
                 one in the sham group. A large dark area is seen at 4 h of
                 reperfusion in the I/R group, which cannot be seen to the same
                 extent in sham rats (Fig. 2). In addition, vacuoles were formed
                 within the cells in some of the images taken after ischemia, and
                 this was not seen in sham rats. Figure 3(a) shows an example of
                 such a phenomenon at 1 h of reperfusion. The same experiment
                 was done using a lower magnification objective to visualize the
                                                                                                    Fig. 1 Histology of liver tissue after I/R injury. (a) H&E stained liver
                 entire liver acinus. Figure 3(b) shows sample images from one
                                                                                                    tissue shows increased vacuolation in the I/R group. White arrow
                 rat before the start of ischemia (control) and at 4 h of reperfusion.              indicates vacuoles. (b) ED1 stained liver showing monocytes and
                 Dark patches are evident in different areas around the acinus at                   macrophages stained in brown. Black arrows show inflammatory cells.
                 4 h of reperfusion that was not seen in the sham group.                            (c) ApopTag stained liver showing apoptotic cells in the three differ-
                     FLIM measures the relative contribution of free/bound                          ent regions in the liver lobule, periportal, centrilobular, and midzonal.
                                                                                                    Black arrows indicate apoptotic cells. Magnification 20×, sham n = 5,
                 NAD(P)H in the liver in vivo in I/R injury. The relative con-                      I/R n = 6.
                 centrations of free (α1) and bound (α2) NAD(P)H were calcu-
                 lated and plotted against time (Fig. 4). The ratio of free/bound
                                                                                                    NAD(P)H was significantly increased after 2 and 4 h of reper-
                                                                                                    fusion [p < 0.05; Fig. 4(a)]. This increase was due to a statis-
                 Table 4 Number of apoptotic cells in the three regions of the liver
                                                                                                    tical increase and decrease in the relative concentration of free
                 lobule. ApopTag-labeled nuclei were counted in 10 different fields per
                 zone of the liver acinus (mean ± SEM). (* p < 0.05 versus I/R injury,              [Fig. 4(b)] and bound [Fig. 4(c)] NAD(P)H, respectively.
                 # p < 0.05 versus periportal and centrilobular.)                                       Another way of showing the relative concentration of
                                                                                                    free/bound NAD(P)H is to false color the images obtained from
                                         Periportal         Midzonal          Centrilobular         the FLIM analysis. Figure 4(d) shows sample images from one
                                                                                                    rat in the I/R injury group and another from the sham group.
                 I/R injury (n = 6)     17.8 ± 4.9       89.5 ± 19.5#        43.2 ± 12.8            The color of the images (from blue to red) indicates the ratio of
                                                                                                    free/bound NAD(P)H. At 1, 2, and 4 h of reperfusion there is a
                 Sham (n = 5)           7.4 ± 2.5          5.2 ± 1.7*         2.0 ± 0.6*            shift in the color to yellow, indicating an increase in the ratio as
                                                                                                    seen in the color bar.

                 Journal of Biomedical Optics                                                116011-4                                       November 2011 r Vol. 16(11)

Downloaded From: https://www.spiedigitallibrary.org/journals/Journal-of-Biomedical-Optics on 19 Jun 2022
Terms of Use: https://www.spiedigitallibrary.org/terms-of-use
Thorling et al.: Multiphoton microscopy can visualize zonal damage and decreased...
Fig. 2 Multiphoton microscopy images of liver in vivo in I/R injury at various reperfusion time points compared to sham rats. The white arrow
indicates a large dark area not seen in the sham group.
4 Discussion of tissue components such as NADH,34 flavine adenine
Fluorescence microscopy can provide valuable information dinucleotide,35 and other flavoproteins.36 However, most pre-
on tissue morphology without the need for histological vious studies have been conducted in vitro with only a few
assessment.34 The technique utilizes the autofluorescence studies performed on live animals.34 External markers for liver
damage such as rhodamine 123 and propidium iodide have pre-
viously been used to study mitochondrial permeability transition
and necrosis, respectively.37, 38 However, the aims of this study
were to investigate whether we could use the autofluorescent
properties of the tissue to detect cell damage using MPM in
combination with FLIM. MPM uses a high-pulsed laser, which
provides low average energy received by the sample imaged.39 In
addition, MPM restricts excitation of a fluorescent molecule to
the focal plane of the microscope.39 Consequently, MPM signif-
icantly improves the quality of images acquired from biological
tissue, by reducing photodamage and photobleaching of tissue
compared to conventional fluorescence microscopy.17, 19, 20
The model of ischemia used resulted in extensive liver dam-
age, as measured by increased liver ALT (Table 1) and depletion
of one of the cellular defence mechanisms against free radi-
cals (GSH) (Table 2). Early ischemia reperfusion injury has in
previous studies resulted in similar increases of ALT and GSH
levels.40, 41 It has been shown that this injury is mediated through
a release in free radicals both within the cell and outside through
Kupffer cell activation.42
It was evident that hepatocytes became vacuolated after 1 h
of reperfusion, indicating cellular stress43 that was not evident
in sham rats [Fig. 3(a)]. In addition to the fluorescence inten-
sity images, traditional H&E staining of the liver also showed
vacuolation in the hepatocytes [Fig. 1(a)], which confirms the
Fig. 3 Multiphoton microscopy images of liver tissue on cellular and findings of Sireli et al., who reported swollen hepatocytes with
acinus levels. (a) Images recorded at 1 h of reperfusion in the I/R group vacuolated cytoplasm during I/R injury.44 Additional immuno-
using high and (b) at 4 h using low magnifications (40× and 10×,
respectively). White opened arrow indicates vacuolation and solid ar-
histological staining for monocytes and macrophages showed
rows indicate increased dark areas. no increase in the number of these inflammatory cells in the I/R
Journal of Biomedical Optics 116011-5 November 2011 r Vol. 16(11)
Downloaded From: https://www.spiedigitallibrary.org/journals/Journal-of-Biomedical-Optics on 19 Jun 2022
Terms of Use: https://www.spiedigitallibrary.org/terms-of-useThorling et al.: Multiphoton microscopy can visualize zonal damage and decreased...
Fig. 4 Changes in free and bound levels of NAD(P)H recorded by fluorescence lifetime imaging microscopy. (a) Ratio of free/bound NAD(P)H was
significantly increased at 2 and 4 h of reperfusion in the I/R group compared to sham. This increase was shown to be due to an increase in (b)
free NAD(P)H and a decrease in (c) bound NAD(P)H, respectively. (d) Relative concentration of free/bound NAD(P)H is expressed in pseudo color
images. The color of the cells in I/R injury shifts toward yellow over time indicating an increase in the ratio of free/bound NAD(P)H. This increase
was not seen in sham rats. *p < 0.05 versus sham (n = 4).
injury group. Since the liver has its own macrophages, called clei that stained positive with the ApopTag as shown in Fig. 1(c),
Kupffer cells, that line the sinusoids, it is probable that ED1 but had apparently normal structure after the (4 h) reperfusion,
would stain those as well.45 The number of Kupffer cells should may ultimately take either pathway. Our group is now focusing
stay constant in the liver, which would explain why the num- on the long term damage of hepatic I/R injury. A review of the
ber of stained monocytes and macrophages are similar in both literature suggests that there is an altered distribution of zonal
groups.45 damage associated with different liver diseases. For example,
In the images recorded by MPM, large dark areas were no- hypoxia and free radical production have been reported to affect
ticed at 4 h of reperfusion in the I/R injury group that could not be cells around the central vein in alcohol induced liver injury,49
seen in any of the sham rats. A decrease in fluorescence is most whereas midzonal parenchymal cells were more susceptible to
likely due to a decrease in NAD(P)H fluorescence, which oc- oxidative stress in cancer and cirrhosis.50 Furthermore, liver
curs in cell death.46 Using high magnification, this dark area was damage was more pronounced in centrilobular and midzonal
seen in three out of four I/R animals. We, therefore, suspected a regions after acetaminophen administration.51
zonal spread in the liver damage and investigated this at lower The brighter parts of the images are likely explained by an
magnification. While the results showed variation in intensity of increase in NAD(P)H concentration during I/R injury. Barbiro
light and dark, the dark areas of the liver were localized away et al. showed a significant increase in NADH levels in hepatic
from the periportal region. To confirm the heterogenic spread in I/R injury,52 and similar results have been reported in hypoxic
the damage the harvested livers were histopathologically ana- hepatocytes in vitro.53 NADH loses fluorescence during oxida-
lyzed. ApopTag stained cells, staining DNA damaged nuclei,47 tion to NAD(P) + , thus NAD(P)H fluorescence can be used to
were significantly increased in the centrilobular and midzonal monitor metabolism.54 However, measuring total concentration
regions, but not in the periportal region. Early ischemia reper- of NAD(P)H can be misleading because it is not possible to know
fusion injury induces a burst of free radicals,42 which in turn whether the fluorescence is derived from free or protein-bound
cause DNA strand breaks in the nuclei of the cells. Although NAD(P)H.32 FLIM is, therefore, a better probe for studying
the strand breaks may predetermine progress to apoptosis, they changes in NAD(P)H because the lifetime of the molecule is
may also be repairable and so the injury is reversible. Apop- significantly enhanced with binding.32 The amplitude (α) can
Tag enzymatic labeling, by its very nature,48 will label both be related to the concentration of NAD(P)H9, 54, 55 and the ratio
repairable and apoptosis-inducing DNA strand breaks. The nu- of free/bound (α1/ α2) NAD(P)H was calculated at different
Journal of Biomedical Optics 116011-6 November 2011 r Vol. 16(11)
Downloaded From: https://www.spiedigitallibrary.org/journals/Journal-of-Biomedical-Optics on 19 Jun 2022
Terms of Use: https://www.spiedigitallibrary.org/terms-of-useThorling et al.: Multiphoton microscopy can visualize zonal damage and decreased...
reperfusion time points. A significant increase was seen at 2 and and cold hypoxia-reoxygenation in primary-cultured rat hepatocytes-
4 h of reperfusion [Figs. 4(a) and 4(d)]. This was attributed to an JNK(1)/SAPK(1) involvement in apoptosis,” Hepatology 32(5), 1029–
1036 (2000).
increase in free and a decrease in bound NAD(P)H [Figs. 4(b)
7. T. Nishikawa, D. Edelstein, X. L. Du, S. Yamagishi, T. Matsumura, Y.
and 4(c)]. It is possible that the increase in free/bound NAD(P)H Kaneda, M. A. Yorek, D. Beebe, P. J. Oates, H. P. Hammes, I. Giardino,
seen in this study is attributable to the Pasteur effect, where and M. Brownlee, “Normalizing mitochondrial superoxide production
cellular respiration is shifted to glycolysis, producing ATP in blocks three pathways of hyperglycaemic damage,” Nature 404(6779),
anaerobic conditions.56, 57 An increase in glycolysis leads to 787–790 (2000).
8. M. Erecinska and D. F. Wilson, “Regulation of cellular energy
an increase in lactic acid production,35 which was previously
metabolism,” J. Membr. Biol. 70(1), 1–14 (1982).
reported in pig liver during warm ischemia.58 In addition, in- 9. V. V. Ghukasyan and F.-J. Kao, “Monitoring cellular metabolism with
creased levels of lactic acid were seen in patients undergoing fluorescence lifetime of reduced nicotinamide adenine dinucleotide,”
hepatectomy, which further coincides with the theory of shift to J. Phys. Chem. C 113, 11532–11540 (2009).
glycolysis in I/R injury of the liver.59 Our group has previously 10. D. K. Bird, L. Yan, K. M. Vrotsos, K. W. Eliceiri, E. M. Vaughan,
P. J. Keely, J. G. White, and N. Ramanujam, “Metabolic mapping
shown an increase in free NAD(P)H in skin after zinc oxide of MCF10A human breast cells via multiphoton fluorescence lifetime
application in vivo.28 imaging of the coenzyme NADH,” Cancer Res. 65(19), 8766–8773
In conclusion, liver damage associated with I/R injury, with (2005).
up to 4 h of reperfusion, was structurally characterized by a 11. W. Y. Sanchez, T. W. Prow, W. H. Sanchez, J. E. Grice, and M. S.
zonal distribution of vacuolated and degenerating hepatocytes, Roberts, “Analysis of the metabolic deterioration of ex vivo skin from is-
chemic necrosis through the imaging of intracellular NAD(P)H by mul-
increased apoptosis, and mild necrosis. The damage was mainly tiphoton tomography and fluorescence lifetime imaging microscopy,”
localized in the midzonal region. MPM was able to detect both J. Biomed. Opt. 15(4), 046008 (2010).
cellular degeneration and the zonal spread of damage, by show- 12. M. S. Roberts, Y. Dancik, T. W. Prow, C. A. Thorling, L. L. Lin, J.
ing irregular fluorescence intensity of the hepatocytes. FLIM E. Grice, T. A. Robertson, K. Konig, and W. Becker, “Non-invasive
imaging of skin physiology and percutaneous penetration using fluo-
added to these results by detecting changes in cellular respi-
rescence spectral and lifetime imaging with multiphoton and confocal
ration, which was attributed by an increase in free NAD(P)H microscopy,” Eur. J. Pharm. Biopharm. 77(3), 469–488 (2011).
and a decrease in bound NAD(P)H in I/R injury. This is an im- 13. Y. Liu, H. C. Chen, S. M. Yang, T. L. Sun, W. Lo, L. L. Chiou, G.
portant and novel finding in that it allows us to follow disease T. Huang, C. Y. Dong, and H. S. Lee, “Visualization of hepatobiliary
development without the administration of an external marker excretory function by intravital multiphoton microscopy,” J. Biomed.
Opt. 12(1), 014014 (2007).
in vivo.
14. M. S. Roberts, M. J. Roberts, T. A. Robertson, W. Sanchez, C. Thorling,
Y. Zou, X. Zhao, W. Becker, and A. V. Zvyagin, “In vitro and in vivo
Acknowledgments imaging of xenobiotic transport in human skin and in the rat liver,”
National Health and Medical Research Council (NHMRC J. Biophotonics 1(6), 478–493 (2008).
15. W. R. Zipfel, R. M. Williams, and W. W. Webb, “Nonlinear magic:
#569710) is acknowledged for funding this project. Clay Win-
multiphoton microscopy in the biosciences,” Nature Biotechnol. 21(11),
terford and colleagues at Queensland Institute of Medical Re- 1368–1376 (2003).
search (QIMR) prepared the histology and immunohistochem- 16. M. T. Butko, M. Drobizhev, N. S. Makarov, A. Rebane, B. C. Brinkman,
istry. Goce Dimeski and colleagues at Queensland Pathology and J. G. Gleeson, “Simultaneous multiple-excitation multiphoton mi-
Services, Princess Alexandra Hospital, conducted ALT mea- croscopy yields increased imaging sensitivity and specificity,” Bmc
Biotechnol. 11(20), (2011).
surements. Professor Yan Yang, Department of Pharmacology, 17. R. M. Williams, W. R. Zipfel, and W. W. Webb, “Multiphoton mi-
Anhui Medical University, Hefei, China, is thanked for helping croscopy in biological research,” Curr. Opin. Chem. Biol. 5(5), 603–608
to set up the animal model and for professional advice. (2001).
18. K. Konig, “Multiphoton microscopy in life sciences,” J. Microsc. 200,
83–104 (2000).
References 19. K. W. Dunn and P. A. Young, “Principles of multiphoton microscopy,”
1. Y. Takamatsu, K. Shimada, K. Yamaguchi, S. Kuroki, K. Chijiiwa, Nephron. Exp. Nephrol. 103(2), e33–e40 (2006).
and M. Tanaka, “Inhibition of inducible nitric oxide synthase prevents 20. H. S. Lee, Y. Liu, H. C. Chen, L. L. Chiou, G. T. Huang, W. Lo, and
hepatic, but not pulmonary, injury following ischemia-reperfusion of C. Y. Dong, “Optical biopsy of liver fibrosis by use of multiphoton
rat liver,” Dig. Dis. Sci. 51(3), 571–579 (2006). microscopy,” Opt. Lett. 29(22), 2614–2616 (2004).
2. J. Baumann, S. Ghosh, T. Szakmany, G. Jancso, A. Ferencz, E. Roth, 21. N. D. Evans, L. Gnudi, O. J. Rolinski, D. J. Birch, and J. C. Pickup,
and L. Bogar, “Short-term effects of N-acetylcysteine and ischemic pre- “Glucose-dependent changes in NAD(P)H-related fluorescence lifetime
conditioning in a canine model of hepatic ischemia-reperfusion injury,” of adipocytes and fibroblasts in vitro: potential for non-invasive glucose
Eur. Surg. Res. 41(2), 226–230 (2008). sensing in diabetes mellitus,” J. Photochem. Photobiol., B 80(2), 122–
3. M. L. Hart, C. Much, D. Kohler, J. Schittenhelm, I. C. Gorzolla, G. L. 129 (2005).
Stahl, and H. K. Eltzschig, “Use of a hanging-weight system for liver 22. P. I. H. Bastiaens and A. Squire, “Fluorescence lifetime imaging mi-
ischemic preconditioning in mice,” Am. J. Physiol. Gastrointest. Liver croscopy: spatial resolution of biochemical processes in the cell,” Trends
Physiol. 294(6), G1431–G1440 (2008). Cell Biol. 9(2), 48–52 (1999).
4. R. Chavez-Cartaya, N. V. Jamieson, P. Ramirez, J. Marin, and G. Pino- 23. J. R. Lakowicz, H. Szmacinski, K. Nowaczyk, K. W. Berndt, and M.
Chavez, “Free radical scavengers to prevent reperfusion injury follow- Johnson, “Fluorescence lifetime imaging,” Anal. Biochem. 202(2), 316–
ing experimental warm liver ischaemia. Is there a real physiological 330 (1992).
benefit?,” Transpl. Int. 12(3), 213–221 (1999). 24. S. Kumar, C. Dunsby, P. A. De Beule, D. M. Owen, U. Anand, P.
5. G. Sener, O. Tosun, A. O. Sehirli, A. Kacmaz, S. Arbak, Y. Ersoy, and M. Lanigan, R. K. Benninger, D. M. Davis, M. A. Neil, P. Anand,
G. Ayanoglu-Dulger, “Melatonin and N-acetylcysteine have beneficial C. Benham, A. Naylor, and P. M. French, “Multifocal multiphoton
effects during hepatic ischemia and reperfusion,” Life Sci. 72(24), 2707– excitation and time correlated single photon counting detection for
2718 (2003). 3-D fluorescence lifetime imaging,” Opt. Express 15(20), 12548–12561
6. D. Crenesse, J. Gugenheim, J. Hornoy, K. Tornieri, M. Laurens, B. Cam- (2007).
bien, G. Lenegrate, R. Cursio, G. De Souza, P. Auberger, C. Heurteaux, 25. A. V. Zvyagin, X. Zhao, A. Gierden, W. Sanchez, J. A. Ross, and
B. Rossi, and A. Schmid-Alliana, “Protein kinase activation by warm M. S. Roberts, “Imaging of zinc oxide nanoparticle penetration in
Journal of Biomedical Optics 116011-7 November 2011 r Vol. 16(11)
Downloaded From: https://www.spiedigitallibrary.org/journals/Journal-of-Biomedical-Optics on 19 Jun 2022
Terms of Use: https://www.spiedigitallibrary.org/terms-of-useThorling et al.: Multiphoton microscopy can visualize zonal damage and decreased...
human skin in vitro and in vivo,” J. Biomed. Opt. 13(6), 064031 42. L. M. Colletti, S. L. Kunkel, A. Walz, M. D. Burdick, R. G. Kunkel,
(2008). C. A. Wilke, and R. M. Strieter, “The role of cytokine networks in
26. B. Geusens, M. Van Gele, S. Braat, S. C. De Smedt, M. C. A. Stuart, the local liver injury following hepatic ischemia/reperfusion in the rat,”
T. W. Prow, W. Sanchez, M. S. Roberts, N. N. Sanders, and J. Lambert, Hepatology 23(3), 506–514 (1996).
“Flexible nanosomes (SECosomes) enable efficient siRNA delivery in 43. A. Takano, Y. Shibayama, and K. Nakata, “The morphogenesis of the
cultured primary skin cells and in the viable epidermis of ex vivo human vacuolation of liver cells,” Liver 4(2), 97–104 (1984).
skin,” Adv. Funct. Mater. 20(23), 4077–4090 (2010). 44. P. Sileri, S. Schena, S. Morini, C. Rastellini, S. Pham, E. Benedetti, and
27. Q. Zhang, P. Li, and M. S. Roberts, “Maximum transepidermal flux for L. Cicalese, “Pyruvate inhibits hepatic ischemia-reperfusion injury in
similar size phenolic compounds is enhanced by solvent uptake into the rats,” Transplantation 72(1), 27–30 (2001).
skin,” J. Controlled Release 154(1), 50–57 (2011). 45. M. Naito, G. Hasegawa, Y. Ebe, and T. Yamamoto, “Differentiation
28. L. L. Lin, J. E. Grice, M. K. Butler, A. V. Zvyagin, W. Becker, T. and function of Kupffer cells,” Med. Electron. Microsc. 37(1), 16–28
A. Robertson, H. P. Soyer, M. S. Roberts, and T. W. Prow, “Time- (2004).
correlated single photon counting for simultaneous monitoring of zinc 46. A. A. Heikal, “Intracellular coenzymes as natural biomarkers for
oxide nanoparticles and NAD(P)H in intact and barrier-disrupted vol- metabolic activities and mitochondrial anomalies,” Biomark. Med. 4(2),
unteer skin,” Pharm. Res. 28, 2920–2930 (2011). 241–263 (2010).
29. T. W. Prow, J. E. Grice, L. L. Lin, R. Faye, M. Butler, W. Becker, E. 47. A. D. Ormerod, P. Copeland, I. Hay, A. Husain, and S. W. Ewen, “The
M. Wurm, C. Yoong, T. A. Robertson, H. P. Soyer, and M. S. Roberts, inflammatory and cytotoxic effects of a nitric oxide releasing cream on
“Nanoparticles and microparticles for skin drug delivery,” Adv. Drug normal skin,” J. Invest. Dermatol. 113(3), 392–397 (1999).
Deliv. Rev. 63(6), 470–491 (2011). 48. J. Hughes and G. Gobe, “Identification and quantification of apoptosis
30. C. A. Thorling, Y. Dancik, C. W. Hupple, G. Medley, X. Liu, A. V. in the kidney using morphology, biochemical and molecular markers,”
Zvyagin, T. A. Robertson, F. J. Burczynski, and M. S. Roberts, “Multi- Nephrology (Carlton) 12(5), 452–458 (2007).
photon microscopy and fluorescence lifetime imaging provide a novel 49. J. J. Maher, “Exploring alcohol’s effects on liver function,” Alcohol
method in studying drug distribution and metabolism in the rat liver Health Res. World. 21(1), 5–12 (1997).
in vivo,” J. Biomed. Opt. 16, 086013 (2011). 50. C. Mouta Carreira, S. M. Nasser, E. di Tomaso, T. P. Padera, Y. Boucher,
31. Q. Yu and A. A. Heikal, “Two-photon autofluorescence dynamics imag- S. I. Tomarev, and R. K. Jain, “LYVE-1 is not restricted to the lymph
ing reveals sensitivity of intracellular NADH concentration and con- vessels: expression in normal liver blood sinusoids and down-regulation
formation to cell physiology at the single-cell level,” J. Photochem. in human liver cancer and cirrhosis,” Cancer Res. 61(22), 8079–8084
Photobiol., B 95(1), 46–57 (2009). (2001).
32. H. D. Vishwasrao, A. A. Heikal, K. A. Kasischke, and W. W. Webb, 51. S. L. Arnaiz, S. Llesuy, J. C. Cutrin, and A. Boveris, “Oxidative stress by
“Conformational dependence of intracellular NADH on metabolic state acute acetaminophen administration in mouse-liver,” Free Radic Biol.
revealed by associated fluorescence anisotropy,” J. Biol. Chem. 280(26), Med. 19(3), 303–310 (1995).
25119–25126 (2005). 52. E. Barbiro, Y. Zurovsky, and A. Mayevsky, “Real time monitoring of
33. R. J. Dinis-Oliveira, J. A. Duarte, F. Remiao, A. Sanchez-Navarro, M. rat liver energy state during ischemia,” Microvasc. Res. 56(3), 253–260
L. Bastos, and F. Carvalho, “Single high dose dexamethasone treat- (1998).
ment decreases the pathological score and increases the survival rate of 53. N. S. Chandel, G. R. Budinger, S. H. Choe, and P. T. Schumacker,
paraquat-intoxicated rats,” Toxicology 227(1–2), 73–85 (2006). “Cellular respiration during hypoxia. Role of cytochrome oxidase as the
34. R. Weigert, M. Sramkova, L. Parente, P. Amornphimoltham, and A. oxygen sensor in hepatocytes,” J. Biol. Chem. 272(30), 18808–18816
Masedunskas, “Intravital microscopy: a novel tool to study cell biology (1997).
in living animals,” Histochem. Cell Biol. 133(5), 481–491 (2010). 54. T. H. Chia, A. Williamson, D. D. Spencer, and M. J. Levene, “Multipho-
35. P. P. Provenzano, K. W. Eliceiri, and P. J. Keely, “Multiphoton mi- ton fluorescence lifetime imaging of intrinsic fluorescence in human and
croscopy and fluorescence lifetime imaging microscopy (FLIM) to mon- rat brain tissue reveals spatially distinct NADH binding,” Opt. Express
itor metastasis and the tumor microenvironment,” Clin. Exp. Metastasis 16(6), 4237–4249 (2008).
26(4), 357–370 (2009). 55. R. Niesner, B. Peker, P. Schlusche, and K. H. Gericke, “Noniterative bi-
36. B. G. Wang, K. Konig, and K. J. Halbhuber, “Two-photon microscopy exponential fluorescence lifetime imaging in the investigation of cellular
of deep intravital tissues and its merits in clinical research,” J. Microsc. metabolism by means of NAD(P)H autofluorescence,” ChemPhysChem
238(1), 1–20 (2010). 5(8), 1141–1149 (2004).
37. T. P. Theruvath, Z. Zhong, P. Pediaditakis, V. K. Ramshesh, R. T. 56. M. C. Skala, K. M. Riching, D. K. Bird, A. Gendron-Fitzpatrick, J.
Currin, A. Tikunov, E. Holmuhamedov, and J. J. Lemasters, “Minocy- Eickhoff, K. W. Eliceiri, P. J. Keely, and N. Ramanujam, “In vivo multi-
cline and N-methyl-4-isoleucine cyclosporin (NIM811) mitigate photon fluorescence lifetime imaging of protein-bound and free nicoti-
storage/reperfusion injury after rat liver transplantation through sup- namide adenine dinucleotide in normal and precancerous epithelia,” J.
pression of the mitochondrial permeability transition,” Hepatology Biomed. Opt. 12(2), 024014 (2007).
47(1), 236–246 (2008). 57. T. Schroeder, H. Yuan, B. L. Viglianti, C. Peltz, S. Asopa, Z. Vujaskovic,
38. H. Rehman, V. K. Ramshesh, T. P. Theruvath, I. Kim, R. T. Currin, S. and M. W. Dewhirst, “Spatial heterogeneity and oxygen dependence of
Giri, J. J. Lemasters, and Z. Zhong, “NIM811 (N-methyl-4-isoleucine glucose consumption in R3230Ac and fibrosarcomas of the Fischer 344
cyclosporine), a mitochondrial permeability transition inhibitor, atten- rat,” Cancer Res. 65(12), 5163–5171 (2005).
uates cholestatic liver injury but not fibrosis in mice,” J. Pharmacol. 58. A. S. Kannerup, H. Gronbaek, P. Funch-Jensen, R. L. Jorgensen,
Exp. Ther. 327(3), 699–706 (2008). and F. V. Mortensen, “The influence of preconditioning on metabolic
39. M. Rubart, “Two-photon microscopy of cells and tissue,” Circ. Res. changes in the pig liver before, during, and after warm liver is-
95(12), 1154–1166 (2004). chemia measured by microdialysis,” Hepatol. Int. 3(1), 310–315
40. D. Ban, A. Kudo, S. Sui, S. Tanaka, N. Nakamura, K. Ito, M. Suematsu, (2009).
and S. Arii, “Decreased Mrp2-dependent bile flow in the post-warm 59. K. Theodoraki, N. Arkadopoulos, G. Fragulidis, D. Voros, K. Kara-
ischemic rat liver,” J. Surg. Res. 153(2), 310–316 (2009). panos, M. Markatou, G. Kostopanagiotou, and V. Smyrniotis, “Tran-
41. S. Demir and M. Inal-Erden, “Pentoxifylline and N-acetylcysteine in shepatic lactate gradient in relation to liver ischemia/reperfusion in-
hepatic ischemia/reperfusion injury,” Clin. Chim. Acta 275(2), 127–135 jury during major hepatectomies,” Liver Transpl. 12(12), 1825–1831
(1998). (2006).
Journal of Biomedical Optics 116011-8 November 2011 r Vol. 16(11)
Downloaded From: https://www.spiedigitallibrary.org/journals/Journal-of-Biomedical-Optics on 19 Jun 2022
Terms of Use: https://www.spiedigitallibrary.org/terms-of-useYou can also read


