Monthly Meeting May 2022 - Food Security and Agriculture Cluster in Afghanistan - Food Security Cluster
←
→
Page content transcription
If your browser does not render page correctly, please read the page content below
Monthly Meeting Food Security and
Agriculture Cluster
May 2022 in Afghanistan
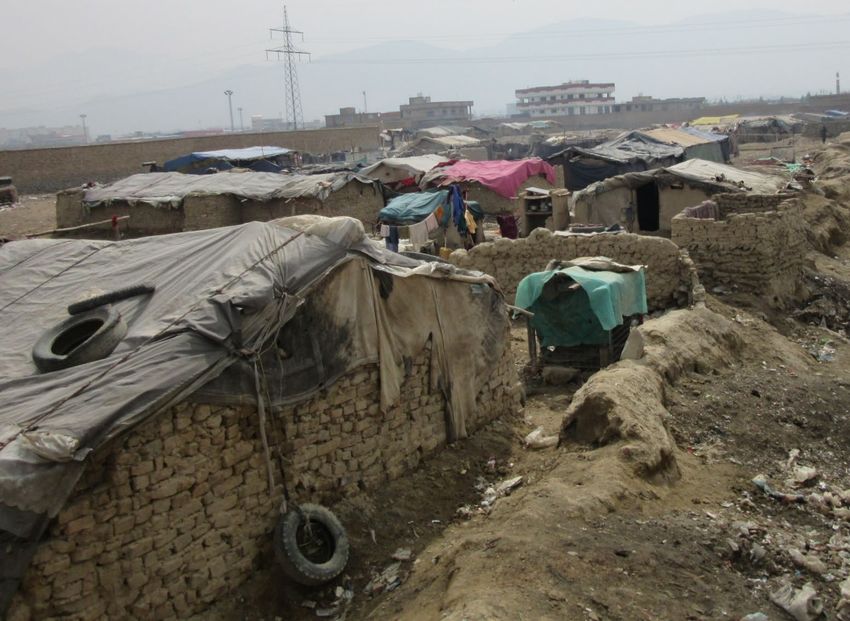
Photo by World Bank
Agenda of the meeting
S. No   Subject                                         Presenting Agency   Time

   1    IPC presentation                                FSAC/IPC            15 min
   2    WoA assessment (FSAC indicators) presentation   REACH               15 min
   3    NEI presentation                                NEI                 15 min
   4    FSAC April achievement                          FSAC                5 min
   5    Update on climate outlook                       FAO                 20 min
   6    FSAC cash for work/asset creation guidelines    FSAC                10 min

   6
        AoB; -                                          FSAC                5 min
         - Date of next meeting
Integrated
                                    Food
                                    Security
                                    Phase
                                    Classification

IPC Lean Season Analysis Findings
            May 2022
Dates of IPC: 19 –28 March 2022                                  Partners involved
Main data sources                                          Number of participants: 55
   • Pre-Lean Season Assessment (PLSA)                     Organisations represented: 18
   • FAO Data In EMergencies (DIEM) - Monitoring of
     Shocks, Agricultural Livelihoods, Food Security and
     Value Chains in Afghanistan- FAO
   • Food prices – WFP monitoring bulletins
   • Climate, precipitation, NDVI, provincial seasonal
     calendars and food security outlook – FEWSNET
   • Refugee & IDP data from UNHCR, OCHA, FSAC and
     IOM
   • Precipitation, temperature, snow, and estimated
     risk of natural disasters – iMMAP
   • Situation Update – UNOCHA
   • Economic Outlook– IMF, WB
   • ERM HEAT, Whole of Afghanistan Assessment
     (Mid-Year WoAA 2022) and Joint Market                       Technical support
     Monitoring Initiative (JMMI) from REACH Initiative
   • Data on humanitarian food assistance delivered             - IPC Global Support Unit
     and planned from WFP, FSAC
   • Provinces Impacted by Drought – World Bank
   • Nutrition data from Nutrition Cluster (NC’s
     dashboard)
   • Other localized assessment conducted by INGOs
     FSAC partners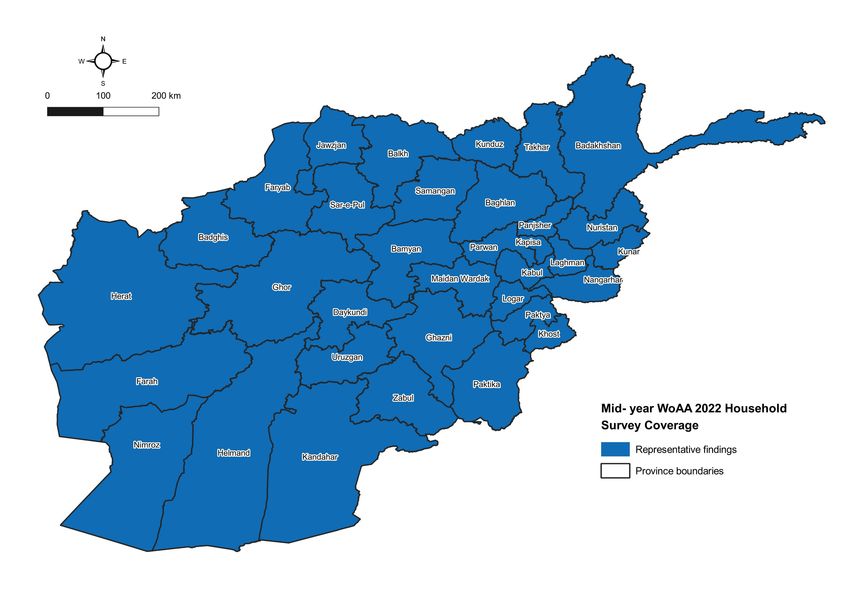
Key Drivers

Economic Decline
                               High Food Prices

Dry spells/Drought:
                              Impact of the Ukraine conflict

Reduced Income and
Unemployment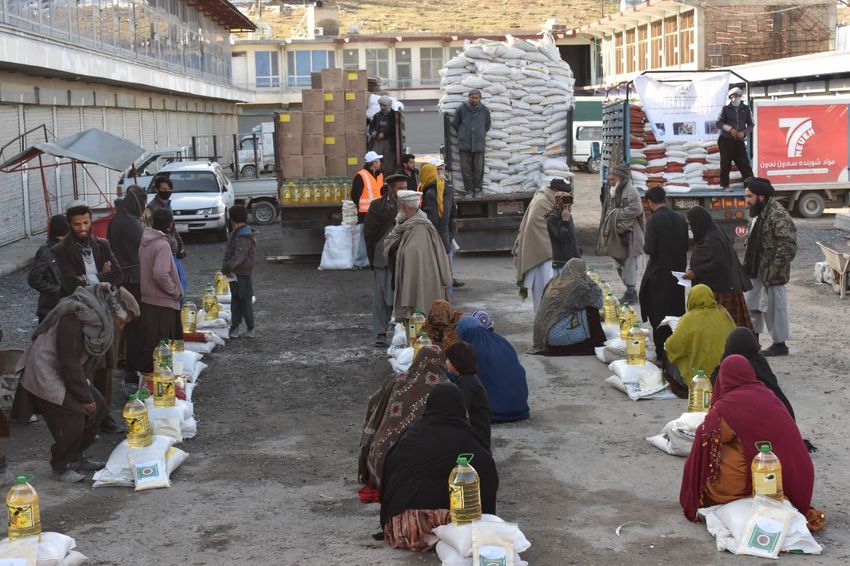
Key Projection Assumptions SHOCKS AND VULNERABILITIES: Conflict Sanctions Humanitarian Food Assistance Development project AVAILABILITY Winter snow melt Wheat production is expected to be 7-13% below average Pasture Condition ACCESS Prices of staple food commodities will follow its increasing trend Income and employment Remittance: Living standards
Findings

              IPC Classification   Current                   Projection
              Phase 3                28                         32
              Phase 4              17 (38%)                  13 (29%)
Lean Season

                                              Post-harvest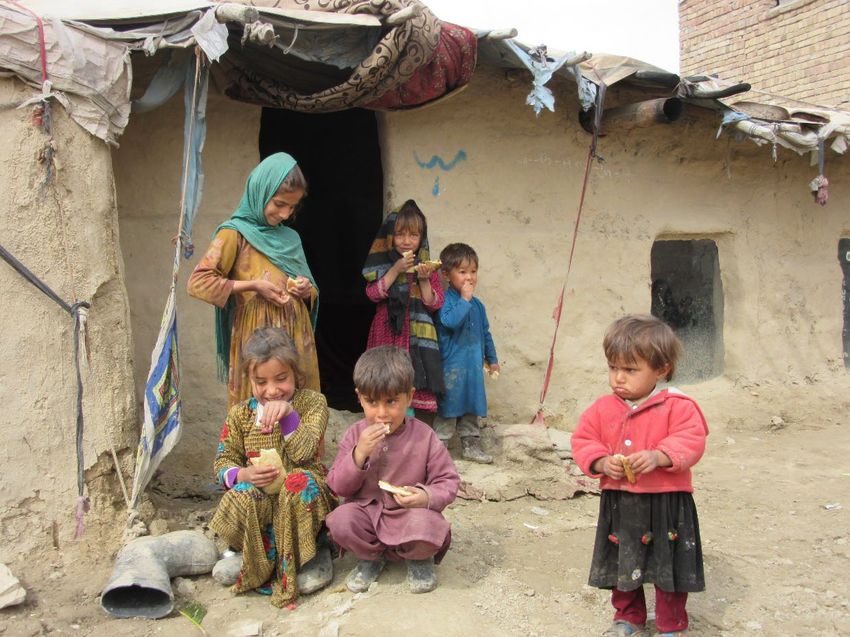
Impact of Humanitarian Food Assistance (HFA)

• HFA: 15% HHs received HFA during data collection

• 38% during current period

• and 8% during projection analysis period
Trends analysis (%)
                  Food Insecurity Trend in Afghanistan based on Proportion of Population, Post-harvest (PH)
                                                  & Lean Season, 2018-2022
                                                                                                                                                  55%

                  47%                                                                                                                47%                      47%
                                                                                                                                                                          45%
      43%                                                                                      42%

                                             37%
            34%                                          34%         35%           35%                                   35%
32%                            33%                                                                                                          33%
                                                                                                            30%                30%                      31%         31%
                                      28%                                                28%
                         25%                                   24%           24%                                   25%
                                                   23%                                                                                         22%
                                                                                                      21%
                                                                                                                                  17%                     16%
              13%                                                                           14%                                                                       14%
  11%                                                11%          11%           11%                                   10%
                            8%              9%                                                           9%

PH: Aug -   Lean: Nov    PH: Aug -   Lean: Nov     PH: Jun -   Lean: Apr -   PH: Aug -   Lean: Nov    PH: Jun -    Lean: Mar - PH: Sep-Oct Lean: Nov Lean: Mar -    PH: June-
Oct 2018    2018 - Feb   Oct 2019    2019 - Mar    Nov 2020    May 2020      Oct 2020    2020 - Mar   Nov 2021      May 2021      2021     2021- Mar May 2022       Nov 2022
              2019                     2020                                                2021                                              2022

                                     Ph 3           Ph 4             Ph 3 & 4            2 per. Mov. Avg. (Ph 3)            2 per. Mov. Avg. (Ph 4)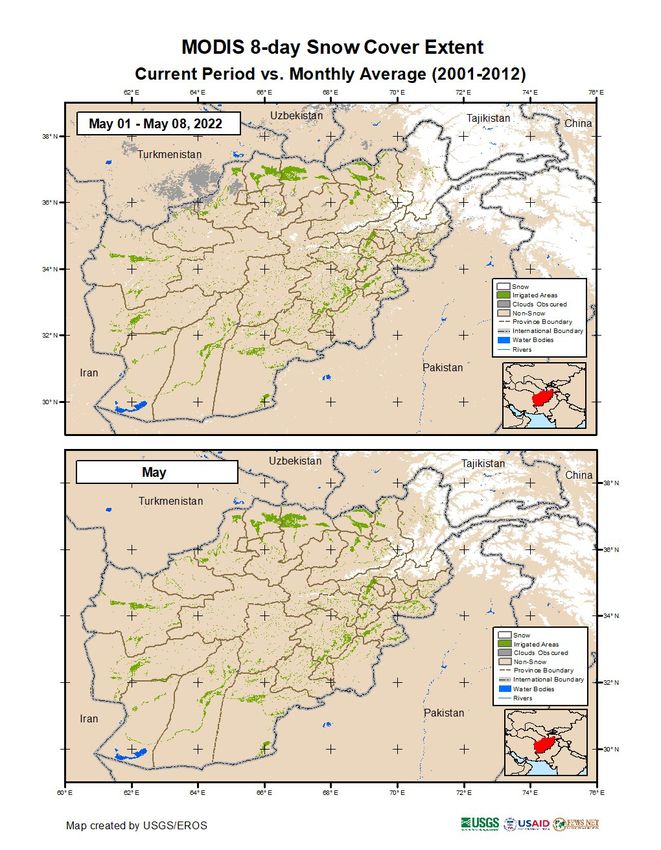
Seasonal Trends analysis

                             Food Insecurity Comparison (in Million), Lean Season & Post-harvest, 2020 - 2022,
                                                               Afghanistan
                                              22.8

                                                                        19.7
                                                                                                                                                        18.8                    18.9
                    16.9

                                 14.1                                                                                       14.5
                                                           13.0                                                                                                    12.9
       11.4                                                                                                                              12.0
                                                                                                                9.8
                                        8.7
                                                                  6.6                                                                             6.9
              5.5                                                                                                                                                         6.0
                                                                                                                      4.7

                                                                                       -     -    -

    Lean (Nov 2020 - Mar      Lean (Nov 2021 - Mar    Lean (March - May 2022)                              Post-harvest (Aug - Oct,   Post-harvest (Sep-Oct, Post-harvest (June - Nov,
           2021)                     2022)                                                                         2020)                      2021)                   2022)

                                                     Phase 3             Phase 4            Phase 3+4              2 per. Mov. Avg. (Phase 3+4)

Note: A population in Phase 3+ does not necessarily reflect the full population in need of urgent action. This is because some households may be in Phase 2 or even 1 but only because of
receipt of assistance, and as a result they may be in need of continued action.
• The food security situation shows deterioration over time. • It has doubled from 10.2m to 19.7m from 2019 to 2022.
• Needs are high, urgent scale up action is needed to save lives and save and protect
                            livelihoods. In the current period almost half of the population is in acute food insecurity
                            with around 20 million people having acute food insecurity (IPC Phase 3 or above)-this
                            translates to about 13 million people are in Crisis (IPC Phase 3) and over 6.5 million people
                            are in Emergency food insecurity (IPC Phase 4). In the projection period 19 million people
                            having acute food insecurity (IPC Phase 3 or above)-t

                          • Food insecurity situation in the urban centers is predicted to deteriorate increasing from
                            48 to 52 percent in the projection period.

                          • Agricultural inputs cost will likely increase and will subsequently impact the access to
Key   Key                   food of the farmers.

      Messages
Messages    • Emergence of IPC Phase 5 conditions cannot be excluded if the response is insufficient.

                          • Early action/ timely provision of timely humanitarian food and livelihoods assistance to
                            severely food insecure population may avoid the people in need from slipping into higher
                            IPC Phases.

                          • High-level advocacy and resource mobilization efforts are needed to address the needs of
                            populations in IPC Phase 3 and above.

                          • Advocate for development support to kick-start the economy in all sectors.

                          • Undertake integrated food and nutrition surveys in high-risk areas
• Timely monitoring of the prevailing food insecurity conditions will be
critical to factor in any prevailing changes considering the projection
analysis is undertaken based on the most likely scenarios.
• The projection will be updated as more information comes to light on key
food security drivers (macroeconomic trends and the provision of
humanitarian assistance).
Way • The TWG will put in place a monitoring plan, to allow for data acquisition
forward/ and support an update of this analysis before September 2022 if needed.
Plans • Planning for the Seasonal Food Security Assessment.
• The Afghanistan food security and nutrition clusters will need to
collaborate to acquire up to date information on nutrition, emanating
from the Afghanistan Health Management Information System, screening
and surveys carried out by cluster members.Thank
Thank you
YouAfghanistan Inter-Cluster Coordination Team
Mid-Year Whole of Afghanistan
Assessment 2022
Key Findings Presentation
Food Security and Agriculture Cluster (FSAC)
25 May 2022
15Mid-Year WoAA 2022 | Supporting Partners
16Methodology: Mid-Year WoAA 2022 | HSM 2022
Findings based on data collected between February 28th and April 17th 2022
Mid-year Whole of Afghanistan 2022 HSM 2022
Sample 14,836 Household Interviews: 10,634 Key informant Limitations:
size: ● Male Heads of Household: 12,843 interviews ● Unable to interview any
● Female Heads of Household: 1,993 females in Paktya
Findings: National level findings: Representative District level findings: province
INDICATIVE ONLY
Provincial findings: Representative for 34 ● HSM findings are
provinces indicative only
Population Displaced Populations: IDPs (recent + non- General population
groups: recent), IDP Returnees and CB Returnees
(recent + non-recent)
Host communities: living near/around
displaced populations
Refugees: In Khost and Paktika provinces
Gender Dual-household interview approach: 3,350 1,134 KIIs (10%)
approach: dual HH interviews, interviewing one female
for every male in these households.
39% of total interviews conducted with female
respondent (female HoHH or dual HH) 17Mid-Year WoAA 2022 Coverage
18HSM Coverage 2022
19A Shift in Shocks
As anticipated, economic shocks were the most frequently reported by all population groups, indicating a
shift in the drivers of the crisis and humanitarian need.
% of HHs reporting shocks experienced in % of HHs reporting impact of shock by type
the last 6 months,* 2022 versus 2021** Conflict Covid-19
Natural Economic
Disaster Shock
65% Limited access to food 61% 43% 61% 95%
60% 60%
Diminished or Lost Source of
Income
85% 65% 80% NA
38% 39% Loss of or severely diminished
33% access to basic services
31% 21% 8% 37%
28%
Income and food access impacts remained similar to
0% 2021, highlighting the continued interrelation of
Covid-19 Conflict Drought Economic Shock humanitarian need (particularly on food), shocks, and
2021 2022 economic vulnerability.
* Economic shock was included for the first time in 2022, so comparison to 2021 cannot be made
20
**Multiple options could be selected and findings may therefore exceed 100%Continuing Food and Livelihood Needs
% of assessed HHs reporting their top 3 priority needs per population group
Although food is consistently
Displaced (IDP+ Host Pakistani
IDP Returnee Overall reported as the main priority
CB Returnees) Community Refugees
need, independent of the
Food 91% 90% 91% 96% 90% area of residence, HHs living
46% 50% 51% 49% 49% in rural areas reported
Healthcare
higher healthcare needs
Livelihoods /
57% 65% 46% 5% 61% (54% rural vs. 40% urban)
employment
whilst HHs in urban areas
Need to repay debt 37% 38% 44% 64% 38%
reported higher livelihoods/
employment needs (57%
In 2022, households from all population groups continued to rural vs. 71% urban)
prioritize food, livelihoods, healthcare, and debt repayment, with
minimal change from 2021 and relatively little difference between
population groups—suggesting that 2021 response priorities
remain on-target but that host and non-displaced communities
continue to be similarly impacted compared to displaced groups.
21Changing Movement & Return Dynamics
As conflict receded as an influence on movement,
poverty has taken a more central role in driving 5% of IDP HHs reported intention to
displacement and suppressing some returns. return to the area of origin (AoO), a
decrease from 17% in 2021.
% of IDP HHs by most commonly reported factors % of all IDP HHs (regardless of intention) reporting main
affecting their most recent displacement need that would help them return to AoO, by need
47%
Unemployment/poverty
65%
Better livelihood opportunities in AoO 27%
78%
Active conflict or violence
43% Financial means to pay for transport back to
13%
AoO
21%
Anticipated conflict or violence
16% Rehabilitation/Reconstruction of home in
11%
AoO
2021 2022
Although data indicates that returns may be taking place among those whose main barrier to return was
safety and security, fewer IDPs who remain displaced, despite improving security conditions, express an
intention to return, indicating that livelihood and economic barriers are standing in their way.
22Decreasing Income…
Mean household income, expenditure, and net Female-headed households reported lower
income, by year incomes and expenditures:
2022 2021
10017
8707
7796
6615
Negative Income
-2092 -2221
Income Expenditure Net income
Average income decreased by 15%, with reduced About 73% of income was spent on food, somewhat
employment opportunities as a major reason. higher than food expenditures in 2021 (65%)
Households appear to be reducing monthly spending to cope with diminishing incomes, yet continue to
accrue debt. Furthermore, the increase in proportional expenditure on food means households are likely
spending0 less on other basic needs, with implications for humanitarian and sectoral needs. Female-
headed HHs have lower incomes and spending less; it possibly means lower standard of living; and relying on
poor quality food, lower spending on basic services such as health, and education. 23Sources of Income and Decreasing Crop Production
Primary and secondary sources of income Main reason that households Main reason that households
during the past 30 days experienced a decreased in experienced a decreased in
crop production, by % of KIs livestock, by % of KIs
40% of KIs reported that more than half of HHs engaged in agriculture
in their settlement experienced a decrease of at least half of their crop
production over the last 6 months, while 28% of KIs reported that more
24% of the HHs relied on unsustainable income than half of HHs engaged in livestock rearing in their settlement
sources. 80% of the assessed households experienced a decrease in livestock ownership. Both proportions were
reported that their income has reduced in the similar to HSM pilot findings in January 2022.
past 30 days (68% in 2021 reported lower
income)
Decreasing income levels, unsustainable sources, and the compounding effect of higher prices are forcing HHs to continue to
resort to coping strategies, including debt taking as a strategy. Moreover, combined with some lingering impacts of the
2021 drought, increasing financial constraints may be preventing normal recovery of agricultural livelihoods. 24…and Increasing Debt
Households seem to be taking on more debt, primarily driven by the need to purchase food
amidst rising food prices and shrinking incomes, even as they spend less each month.
Both the proportion of households taking on debt and the average amount of debt have increased
over the past 6 months:
- Reported average total debt was of AFN 58,159 in 2022, compared to AFN 52,342 in 2021
- The proportion of households that reportedly have debt increased from 73% in 2021 to 82% in 2022.
Average food basket cost (AFN) by month*
Male and female-headed households,
and urban and rural households, were
equally likely to have some debt;
however rural HHs reportedly had
higher average debt (AFN 59,966 vs
54,298), while female-headed HHs
reportedly had lower average debt (AFN
43,647 vs 60,612), despite also having
lower monthly income.
* Breaks in the JMMI graph indicate instances in which the food basket composition was changed; dotted line indicates what the food basket cost would 25
have been if the composition had remained the same as it was previouslyLivelihood Coping Strategy Usage…
% of assessed HHs by category of Livelihoods Coping
Strategy (LCS), by urban vs rural area
As households’ primary response to economic shocks was
to reduce monthly spending or take on debt, use of
livelihood coping strategies remained similar to 2021,
suggesting that spending less while borrowing money may
afford households some resilience for the time being.
However, also similar to 2021 trends, higher proportions
of rural households are engaged in emergency coping
strategies that may hinder future resilience, suggesting a
clear need to target livelihood assistance at rural
areas.
Normal: Migrated outside the country to seek work or none
Stress: Spent savings, sold household goods, borrow food or money to buy food
Crisis: Sold income-generating equipment, delayed seeking medical care
Emergency: Sold house or land, begged, sold last female animals, married daughters earlier than intended, engaged in extreme or high-risk activities
* The Livelihood Coping Strategy Index (LCSI) measures coping mechanisms used by households when there was not enough food or money to buy food in the 30 days prior to 26
data collection. ‘Normal’ is to be interpreted positively.Coping Strategies and Protection Concerns
% assessed HHs reported marrying daughters
earlier than intended due to a lack of food or
money in the 30 days prior to data collection, by 9% of assessed HHs reported at least one child
(11 - 17 years) working outside the home,
year
compared to 12% in 2021.
17% of female headed HHs reported at least
one child working outside compared to 8% of
male-headed households.
Prevalence of child protection concerns was not found to vary notably compared to 2021. However, the
continued reporting of child labour and early marriage as a coping strategy, and higher rates amongst
vulnerable profiles such as female headed households, indicates persistent concerns around the
vulnerability of children in the current economic and political context, particularly for girls.
27…Persistent Food Insecurity
% of assessed HHs by Food Consumption Score
(FCS) category
61% of female-headed HHs have a poor FCS
versus 52% of male-headed households
Despite coping strategies such as reducing
spending and taking on more debt, the
magnitude of acute food insecurity appears to
be worsening.
This indicates that, households may be
spending their money on cheaper, less
Furthermore, proportion of households in the HHS
moderate hunger category escalating from 14% in nutritious or varied foods to cope with the rising
2021 to 38% in 2022. prices and falling incomes of the past 6 months,
with implications for possible worsening of
Among the 16% of children who were screened for severity of food insecurity and malnutrition
malnutrition in the 3 months prior to data collection, 20% without continued assistance.
had been referred for severe malnutrition.*
28
* Screening and referral data was included for the first time in 2022, so comparison to 2021 cannot be madeRising Hunger Levels
Overall, 38% assessed HHs fell into the moderate % of Key Informants reporting hunger levels in
category of HHS. HHS by gender of HoH the assessed settlements
62%
53%
45%
37%
2% 1%
Little Moderate Severe
female-headed HH male-headed HH
Moderate and severe HHS per region:
Female-headed HHs across the country are in a relatively worse position in terms of access to food, and should
be prioritized food assistance. HHs in regions such as southern, northern, and eastern regions may need food
assistance prioritization (at province and district level) to avoid deterioration of hunger levels. 29Reduced Coping Strategy Index (rCSI)
% assessed HHs per rCSI category, % assessed HHs per rCSI category, by
trends region
2022 62% 12% 26%
2021 45% 14% 37%
High Low Medium
With increased hunger and higher reliance on coping strategies in a few regions, sub-national level
prioritization (at province level) of food/cash assistance with a view to these regions may be required.
30Barriers to Markets
% of female HH members % of households reporting % of Key Informants reporting
(non-head) reporting on barriers to markets on barriers to markets
access to markets, by
type of access:
Barriers to Markets Men Women
Prices for food items are too high 68% 62%
2022 Access to markets Prices for NFIs are too high 58% 54%
No access 15%
Yes, accompanied 51% Market is too far 17% 19%
Yes, alone 30%
23% of assessed HH living
2021 Access to markets
in rural areas reported
No access 17%
Yes, accompanied 35%
markets being too far (vs
Yes, alone 48% 6% in urban areas)
Cultural and financial barriers are preventing people, particularly women, from accessing basic services such
as markets. These barriers are affecting the needs of households, including female-headed HHs, on several
fronts such as livelihoods, health, education, and other basic needs.
31Persistent WASH Needs
% HHs by key WASH sectoral indicators, by Top 10 provinces with highest proportions of
year: HHs reporting drought
Indicators 2021 2022
Using inadequate water sources 17% 15%
Using unimproved latrines 41% 42%
Sufficient quality and quantity of water* 28% 21%
Overall WASH needs have not changed since
2021, however, these were consistently higher in Overall trends in sectoral needs for WASH
rural versus urban areas, e.g. reliance on remained generally consistent with 2021 findings.
inadequate water source (24% vs 2%), and use of However, there is considerable geographic
unimproved latrines (51% vs 22%). variation. For certain indicators, provinces with
highest need were largely consistent, but did show
some variations, indicating the need to review
sub-national prioritization.
* For drinking, cooking, bathing, washing, or other domestic use
**Inadequate shelters include emergency shelters, collective centers not intended for living, open space, makeshift, unfinished 32
shelter, or transitional shelter.Vulnerability profiles
Overall, needs did not vary considerably by displacement status. However, findings indicate higher levels
of vulnerability and need persistence in certain demographic and shock profiles, such as
households having a member with a disability, female-headed households, HHs in the rural areas, and
drought-affected households, and therefore need for prioritization in the response.
% of HHs with At least one child
Profile Income (AFN) Debt (AFN) LCSI Emergency
poor FCS working outside
HHs with a member with
6,815 79,699 58% 12% 51%
disability
HHs without a member with
6,579 54,131 52% 9% 41%
disability
Female HoH 5,135 43,634 61% 17% 49%
Male HoH 6,864 60,612 52% 8% 41%
Rural NA 59,967 53% 10% 50%
Urban NA 54,298 53% 9% 26%
Drought-affected 6,446 57,990 51% 10% 55%
Non-drought affected 6,701 58,252 54% 9% 36%
33Conclusions
Shifting Drivers and Socio-economic
Impacts on Sectoral Needs
Dynamics Vulnerability
• Economic shocks have • As incomes decrease while • The magnitude of food insecurity appears to be
overtaken conflict, Covid- food prices rise, households worsening as food prices rise, with implications for
19, and natural disasters are both reducing monthly possible increasing severity of need without
as drivers of need, causing spending and taking on more continued assistance.
food and livelihoods to debt compared to 2021 • However, there is considerable geographic variation
persist as most reported • Concurrently, households are for rural versus urban populations and at sub-national
shock impacts and priority spending less on other basic level, indicating the need to review sub-national
needs needs, with implications for prioritization.
• Poverty has become the humanitarian and sectoral needs • These are mostly the current impacts of the
most prevalent driver of • As households’ primary response humanitarian needs, however, the long-term impact of
displacement and barrier to economic shocks was to needs such as nutrition and healthcare present
to returns in 2022 reduce monthly spending or take major concerns for development and future human
• Financial constraints are on debt, use of livelihood capital.
increasingly reported as coping strategies remained • Despite not worsening, agriculture and livestock-related
barriers to accessing basic similar to 2021, suggesting that livelihood outcomes do not appear to have recovered
services as a consequence spending less while borrowing from the impacts of the 2021 drought, as reports of
of the ongoing economic money may afford households crop and livestock loss remain high. Combined with
crisis. However, the legacy some resilience for the time some lingering impacts of the 2021 drought, especially
of conflict and drought is being. for agricultural livelihoods, increasing financial
still felt. constraints may be preventing the recovery of
agricultural livelihoods
34Conclusions
Vulnerable Populations
• Overall, needs did not • Needs were consistently
vary considerably by higher in rural versus urban
displacement status. areas
However, findings indicate • Increase in cultural barriers
higher levels of and corresponding impact on
vulnerability and need women’s access to services;
persist in certain compounded by
demographic and shock corresponding greater
profiles: economic constraints,
Rural versus urban affecting overall need and
communities vulnerability
HHs with a member with • Similarly, both cultural and
a disability economic challenges combining
Women and female to create persistent protection
headed households risks and humanitarian needs
Children, particularly for children, particularly girls
girls
35Questions?
36www.unocha.org
37Distribution of Emergency Food Aid
to Internally Displaced People
Presentation to FSAC
제 24회 SOHYA 발대식
38NEI Mission & Vision
Vision:
Defeat protein-energy
malnutrition (PEM) in Afghanistan
among women and children.
Mission:
Create a self-sustainable strategy
to prevent PEM through
establishing a soybean value
chain.
Motto:
Can we help even one more
Afghan family grow soybeans to
fight malnutrition?
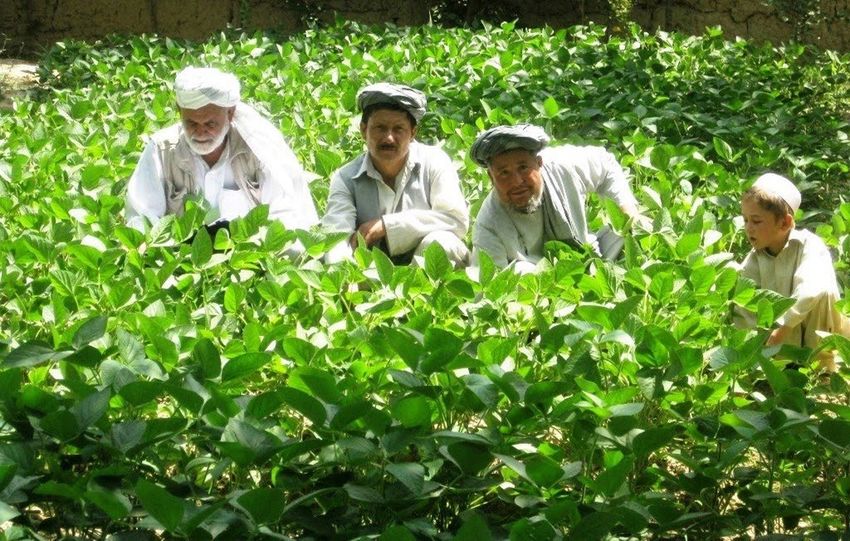
39Soy Value Chain in Afghanistan
The Sustainable SVC Is
                 Completely Established in Afghanistan
                             1.      Soybean Seed Production
                             14 varieties approved by MAIL and
                             produced in different agroclimatic
                             zones

                                                      2. Soybean Cultivation with Farmers
4. Soy Market Development
                                           Self-      More than 125,000 farmers trained in 34
The market is established and                         provinces since 2003
demand is getting high for locally      Sustaining
                                                      The highest production recorded in 2016;
produced soybeans                                     6,000MT
                                                      2,900 farmers will be trained in 2022

                                       3. Soy Processing
                  11 factories established in different regions, including one
                          state-of-the-art sterilized soy milk factory
                      The total processing capacity is 13,000MT per year
By 2030 End Malnutrition with Soy Nutrition
Soybean Production:
300,000 MT/Year
• Soybean production in 20,000 / 33,000 villages
• 100,000 MT of absorbable proteins per year
• 85% penetration of households2022 Soybean Farmer Training and Production
2022 Soybean Production Plan – 9 Provinces
Farmer Identification in Parwan
Farmer Identification in Kunduz
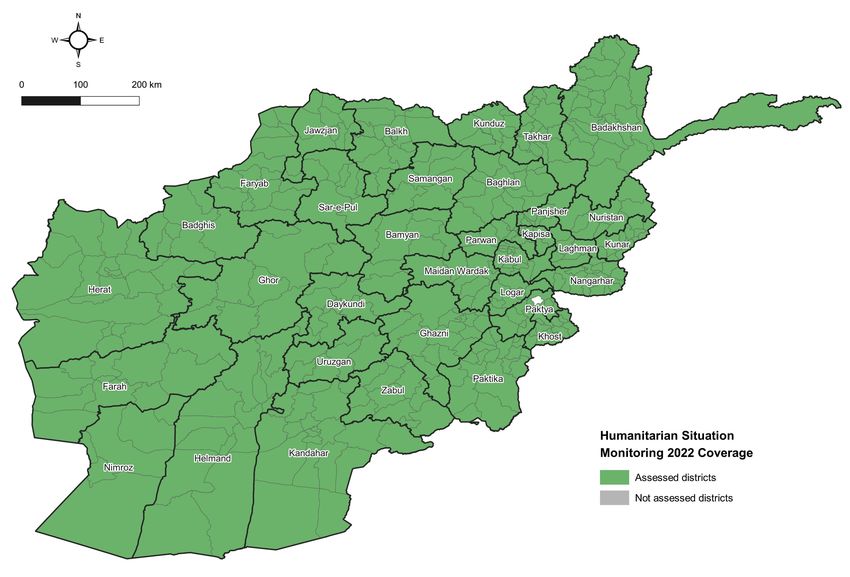
Humanitarian Food Aid Program

 NEI distributed 19.5 MT of PRM to 2,350
women and children from November 2021
               to May 2022
2022-05-30                                 47
Protein Rice Meal (PRM) feeding to poor
children
PRM contains high amount of protein, energy, minerals and vitamins essential for
nourishment and growth of children. It’s merit is feeding a person at USD.15PRM Program Objective To alleviate Malnutrition among children and women and improve food security through Protein Rice Meal (PRM) nutrition intervention in Afghanistan.
PRM Fills The Nutritional Gaps Of The Undernourished

• IDP refugees consume mostly bread, potatoes, and vegetables.
• PRM provides protein and micronutrients essential for physical and
  mental growth
• PRM is easy to store and prepare and is well-liked by children.
• PRM costs USD.15 per serving
                      PRM Nutrition Facts - 67 gram serving
      Energy                                   calories       230
      Protein                                  grams           9
      Total Fat
                                               grams           0
      Carbohydrates
                                               grams          45
      Dietary Fiber                            grams           3
      18 essential vitamins and minerals
Shelf Stable PRM Turns into a Nutritious Hot
Meal
PRM prepared (all ingredients mixed Chef distributing PRM in Anna SchoolFocus on the Orphans, Widows and Displaced
Families
19.5 Mt PRM distributed to 2,350 people in 4 centers including orphanages and a
colony of widows-led families – no bread winner families ;
1. Poor IDP families # 138
2. Poor families in the villages 52
3. Afghan Red Crescent Society # 35 families
4. Orphans in Aschiana orphanage # 1000 families
Usage Rate: 2.5 Mt per month in averageHow was the product received by the children
and the orphanages?
• PRM is distributed in 2 Kilogram and 400 gram Packs. One serving size is
67 grams. The families and chefs of each center prepare PRM according to
their method so PRM tastes well to the children; for example, one center
prepares rice separately and rest of the ingredients separately as stew
(topping for rice)
• Children are eating eagerly.Children in an IDP camp receiving PRM and
eagerly eating
General observations from care takers of children consuming PRM:
• More energy
• Sleeping better
• Skin improvements
• Feeling fuller
• Mothers with more breast milkBeneficiaries’ testimonials on PRM
consumption
• Ms. Nafesgul, “Due to poverty we were hungry but now with PRM my children
receive enough meal”.
• Ms. Adela one of the mothers have explained of increase in her breast milk after
consuming PRM.
• Ms. Najiba, “My son Elham didn’t have proper sleeping, but after consuming the PRM
he sleeps well and is feeling well.
• Ms. Asiana, and Mr. Wahidullah orphans in the Ashiana orphanage explained PRM
effect very positive for their health, “we are feeling well and energetic during the day
and until late evening when we consume PRM at lunch.
• Ms. Palwasha, “PRM is very tasty and healthy food for me and this is the first time
that I consume such good food”.Results delivered and key learning from
the 19.5 MT:
• PRM is well received in taste and convenience. Children loved it.
• Orphanage operators like the ease of preparation. They found it is easy to
augment with other ingredients that they have on-hand.
• PRM fills the nutritional gaps as shown by interest and anecdotal feedback
from consumers.
• According to the survey, many poor families are at risk of malnutrition due to
food insecurity and poor dietHumanitarian Food Aid Program
NEI distributed food items and non-food
items to 6,700 IDP women and children at
1,000 IDP families from December 2021 to
May 2022
2022-05-30 57The need for high protein soy foods • According to United Nation 435,000 children are displaced due to recent conflicts • More than 50% of the children are suffering from malnutrition in Afghanistan. • 300,000 families are in urgent need of food • More then 90% people don’t have enough food for their nutrition • More then 98% population is under poverty
CURRENT SITUATION OF THE IDP SELECTED BY
                                      NEI
         120%

                       97%                 97%
         100%                                                  93%                                     94%

          80%

          60%

          40%

          20%
                                                                                    7%

           0%
                IDP families were in IDP families didn’t IDP households live IDP households live households were in
                  extreme need of have access to high under the tents or in the communal          extreme need to
                    food items.      protein and calorie   muddy houses           buildings.     heat their housees
                                            food

References: NEI’s Pre-assessment findings in the selected IDP camps
NEI Distributes Food and Firewood to Vulnerable Kabul Refugee Families for Winter Survival
IDP camps selected by NEI
Current situation of the IDPs
IDPs food (only dry bread)
NEI’s Feeding Program
• NEI assisted 6,700 IDPs women and children at 1017 families for 5
  consecutive months including winter survival support (soybean, soy flour,
  Rice, Cooking oil and firewood)
IDP children are happy to have food from NEI
www.Neifoundation.org

Steven Kwon, Ph.D. – CEO
steven.kwon@neifoundation.org .
La Niña 2021-22
Real-Time Tracking for Afghanistan

     FAO Afghanistan
       25 May 2022
Presenter Notes
2022-05-23 18:22:25
--------------------------------------------
Key climate prediction centers:
WMO ,National Oceanic and
Atmospheric Administration
(NOAA), International Research
What are the La Niña forecasts telling us?
Institute for Climate and Society
(IRI) – Columbia University,
FAO-GIEWS, Indian
Meteorological Department,
ENSO Cell, RIMES, NASA,
ECMWF, CHIRPS, Australian
• As per latest available forecasts in May 2022, key global and regional climate prediction centers indicate
Bureau of Meteorology, and
others.
that La Niña is favored to continue, the odds for La Niña decrease into the late Northern Hemisphere
Weak La Niña event doesn’t
necessarily mean lower impact in
summer (58% chance in August-October 2022) before slightly increasing through the Northern Afghanistan (between 1984 to
2021, 12 drought events
recorded in Afghanistan of which
Hemisphere fall and early winter 2022 (61% chance). 9 were triggered by a La Niña
event of varying intensity
• A weak to moderate La Niña event has hit Afghanistan in wet winter precipitation season of Nov-21 to
resulting inter alia in wheat
cultivation adversely impacted by
16 to 42%, poor pasture /
May-22, which resulted in a consecutive event (“double-dip LN”) following a moderate-severe La Niña in
vegetation conditions, adverse
livestock body conditions /
2020-21 that lead to a severe drought in Afghanistan. mortality, and such) because
impacts are a function of existing
• There are roughly equal odds of La Niña and ENSO-neutral during the Northern Hemisphere hydro-agrometeorological
conditions, exposure, underlying
vulnerabilities, and coping
summer, with La Niña favored for the fall and early winter 2022-23. capacities at both household and
agriculture sectoral levels in
• This La Niña event has resulted in a back-to-back drought in 2022 and the 3rd drought in 5 years (2018,
Afghanistan.
2021 & 2022) with adverse impacts on crop production, livestock health, local ecosystems, and
agricultural & landless rural households’ coping capacities.What are the La Niña forecasts and performance indicating?
-   Forecast: From WMO, NOAA, CHIRPS, and IRI highlight that the below average precipitation condition
    could continue in Afghanistan until August 2022, with a below average in almost all northern provinces.
    Longer range forecasts (SEP-OCT-NOV 22), show that below-normal precipitation will impact the
    entire country again.
Precipitation anomaly experienced at the start of season, still exists across most parts and impacting also areas with better situation at the beginning of winter. Concerns remain in northern rainfed wheat cultivating areas, situation is improving in Badakhshan, but reduced water availability likely to impact second crops
How is the La Niña impacting Soil Moisture?

Soil Moisture levels remain worrying and most of the country, from October 2021 to April 2022
observations, show significantly below average conditions at the starting of winter cereals season,
with a slight below avg in APR. But still this is likely to compound the impacts of the 2020-21 drought.
What are the La Niña forecasts and performance indicating about Snow cover?

• Analysis of Snow Depth Difference Anomaly (MAY 2021 vs. 2022) shows
    that while the situation could be more severe than 2021, some areas of
    concern remain (parts of north, north-east, central highlands, and central
    region).
•   Indications of snow cover are in line with last 10 year avg; BUT reduced
    snow depth, higher than average temperatures and drier than normal soil
    conditions are a cause of concern.
Snow-Depth & Coverage by River Basins
No Name of Basin Snow coverage Ranking (W-G)
1 Northern Below Average 1
2 Kabul Below Average 2
3 Panj- Amu Below Average 3
4 Helmand Below Average 4
5 Harirud-Murghab Below Average 5NDVI & VHI Anomaly (GIEWS FAO) Vegetation (Winter crops & pasture) growth/cover appears to be stressed in parts of N., W, and E. compared to Long Term Avg. Some relief on CH
Water Availability in major reservoirs on April 2022
    PRELIMINARY INFO: the situation in the reservoirs is not favourable
No Reservoir       Location    Current storage                Remarks

1     Kajaki       Helmand     Slightly less than last year
2     Dahala       Kandahar    Less than last year
3     Kamal Khan   Nimroz      Less than last year
4     Salma        Herat       Less than last year
5     Naghlu       Kabul       Less than last year
6     Qargha       Kabul       Less than last year
7     Darunta      Nangarhar   Less than last year
What are the La Niña forecasts telling us? 1. The European Centre for Medium-Range Weather Forecasts (ECMWF) indicates below-average precipitation during the next two weeks. Wheat will be in harvest in the west and already harvested in the east, dry weather will not hurt yield prospects, reduction in yield already occurred. 2. Below-average cumulative precipitation from October 1, 2021 to May 23, 2022, was observed in all the northern part of the Country. Average cumulative precipitation for the same period was observed in some parts of the central and southern regions. 3. As of May 23, 2022, below-average and near-record low snow water volumes persist in most basins of the country. 4. Below-average precipitation and above-average temperatures are most likely through the end of August in Afghanistan due to the ongoing La Niña. 5. Cumulative adverse effects on fodder availability are anticipated in summer months, since pasture vegetative conditions are already impacted by high temperature and water availability and less than average second crop cultivated area may result from low water availability in most basins across the country. 6. Wheat harvest yield are expected to be below average due to soil moisture and low water availability in rainfed wheat, close to average in irrigated wheat with some local reduction in expected due to specific conditions
1.   Close monitoring through community-based ground-truthing & earth-observations
                                       of: (i) crop & rangelands growth conditions, (ii) precipitation and snowpack formation,
                                       (iii) soil moisture levels, (iv) surface and groundwater availability, (v) outbreak of crop

Going Forward FAO                      pests & animal diseases, and (vi) livestock animal body conditions.
                                  2.   Forward looking Impact analysis on: (i) wheat growth in rainfed & irrigated areas,
recommends to prioritize
                                       (ii) irrigation availability, (iii) rangelands growth, (iv) fresh fodder availability & pricing,
Anticipatory Action approach
                                       and (v) animal body conditions.
that monitors La Niña             3.   Contingency Planning & Evidence generation to inform programming decisions
progression & real-time effects        on Anticipatory Actions and Emergency Response.

on food-livelihoods security      4.   Advisories to support wheat crop growth, plant protection measures and maintain
                                       livestock body conditions.
while protecting crop
                                  5.   Anticipatory assistance in the form of emergency livestock protection assistance
production & livestock health
                                       including veterinary services as well as second season crop cultivation inputs to
and mitigating the “push-              marginal livestock/land holding households.
factors” of displacement          6.   Increasing Cash For Work actions to enhance local irrigation, soil-water
                                       conservation structures and short-term income boost to HHs.
Thank You! For more information, contact: Kaustubh.Devale@fao.org or Andrea.Porro@fao.org Andrea, FAO Afghanistan
Food Security and
  FSAC- Cash for Work/     Agriculture Cluster
 Cash for Asset Creation   in Afghanistan
       Guidelines

 May 25, 2022
Photo by World Bank
Background
The Food Security and Agriculture Cluster (FSAC) partners manage cash or food for work
activity to provide cash transfers to vulnerable, food-insecure and crisis-affected
households in return for the provision of labor, particularly through labor-intensive
construction and rehabilitation projects.
• The two main objectives of Cash for Work (CFW)/ Cash for Asset Creation (CFA)
programmes are to:
i. Provide income opportunities and improve food consumption; and
ii. Build or repair assets and infrastructure that are vital for sustaining the livelihoods
of a community. Cash/food for work can address both short-term and chronic
poverty and improve the asset base, thus helping to alleviate poverty in the medium
and long terms.
The purpose of these Guidelines is to provide FSAC partners with a framework for the
design, implementation, and monitoring of CFW/ CFA activities under the Afghanistan
Humanitarian Response Plan.Implementation CFW/ CFAC Programs
CFW/ CFA is commonly used in Afghanistan to cover food and income gap for the
basic food basket and to rehabilitate basic livelihoods infrastructure.
Recommended daily rates are as follows;
    • 350 AFs to 400 Afs for unskilled
    • 700 AFs for skilled labor

FSAC recommended 22-day work per month; the rates are adjusted as per local
rates to avoid attracting a large pool of labor from formal labor market.

Ongoing monitoring of the local economy, including an overview of market prices
and the availability of employment, should be performed on a regular basis
throughout the project lifetime to ensure that CFW/ CFA wages stay at the
appropriate level.
Activities for women and vulnerable groups • Gabion weaving: it is weaved for building gabion walls to protect houses and land from flood. • Women can perform light work on construction projects e.g. (watering of concrete, collecting waste and cleaning the workspace, cooking in site etc.). • Designing CFW activities tailored for women such as cash for attending training • During COVID-19 pandemic, women can take part by being involved in producing face masks and PPE. • Transporting and carrying construction tools between project sites • Administrative tasks: manage the attendance sheet for the CFW/ CFA. • Women can be involved to be part of selection and monitoring process of CFW/ CFA work and beneficiaries, as they are part of the community structure (shura members).
Food Security and
                      AOB   Agriculture Cluster
                            in Afghanistan

Photo by World Bank
Thanks FSAC website: http://fscluster.org/afghanistan/ FSAC Coordinator: daniel.mlenga@fao.org FSAC IMO: Javedkhan.Bazargkheil@fao.org
You can also read