Millisecond Pulsar Kicks Cause Difficulties in Explaining the Galactic Center Gamma-Ray Excess
←
→
Page content transcription
If your browser does not render page correctly, please read the page content below
MNRAS 000, 1–9 (0000) Preprint 10 May 2022 Compiled using MNRAS LATEX style file v3.0

 Millisecond Pulsar Kicks Cause Difficulties in Explaining the Galactic
 Center Gamma-Ray Excess
 Oliver Boodram,1,2★ Craig O. Heinke1
 1 Department of Physics, CCIS 4-183, University of Alberta, Edmonton, AB, T6G 2E1, Canada
 2 Department of Aerospace Engineering Sciences, University of Colorado Boulder, 3775 Discovery Dr, Boulder, CO, 80303, USA
arXiv:2205.03479v1 [astro-ph.HE] 6 May 2022

 10 May 2022

 ABSTRACT
 The unexplained excess gamma-ray emission from the Milky Way’s Galactic Center has puzzled astronomers for nearly a decade.
 Two theories strive to explain the origin of this excess: self-annihilating dark matter particles or an unresolved population of radio
 millisecond pulsars. We examine the plausibility of a pulsar origin for the GeV excess using N-body simulations. We simulated
 millisecond pulsars in a realistic dynamical environment: (i) pulsars were born from the known stellar mass components of
 our Galaxy; (ii) pulsars were given natal velocity kicks as empirically observed from two different studies (or, for comparison,
 without kicks); (iii) pulsars were evolved in a Galactic gravitational potential consistent with observations. Multiple populations
 of pulsars (with different velocity kicks) were simulated over 1 Gyr. With final spatial distributions of pulsars , we constructed
 synthetic gamma-ray surface brightness profiles. From comparisons with published Fermi-LAT surface brightness profiles, our
 pulsar simulations cannot reproduce the concentrated emission in the central degrees of the Bulge, though models without natal
 velocity kicks approach the data. We considered additive combinations of our (primordial MSP) simulations with models where
 pulsars are deposited from destroyed globular clusters in the Bulge, and a simple model for pulsars produced in the nuclear
 star cluster. We can reasonably reproduce the measured central gamma-ray surface brightness distribution of Horiuchi and
 collaborators using several combinations of these models, but we cannot reproduce the measured distribution of Di Mauro with
 any combination of models. Our fits provide constraints on potential pathways to explain the gamma-ray excess using MSPs.
 Key words: Galaxy: bulge – pulsars: general – Galaxy: kinematics and dynamics – gamma-rays: galaxies – dark matter –
 astroparticle physics

 1 INTRODUCTION 2012; Di Mauro 2021). The GCE spectrum appears consistent with
 some models for WIMP annihilation into Standard Model particles
 Following observations of the Milky Way bulge with the Fermi
 (Hooper & Linden 2011; Cerdeño et al. 2015).
 Gamma-ray Space Telescope (Fermi-LAT), many analyses revealed
 an unexpected excess of GeV gamma-ray emission (Goodenough & Alternatively, an unresolved population of millisecond radio pul-
 Hooper 2009; Vitale & Morselli 2009; Abazajian & Kaplinghat 2012; sars (MSPs), rapidly rotating neutron stars, in the GC could produce
 Ajello et al. 2016; Ackermann et al. 2017). This excess could not this excess emission (Abazajian 2011; Abazajian & Kaplinghat 2012;
 be accounted for by previously modeled astrophysical backgrounds, Yuan & Zhang 2014). MSPs are produced by accretion in low-mass
 such as cosmic ray interactions with molecular clouds (e.g. Macias X-ray binaries (LMXBs). In a stellar binary, after one of the stel-
 & Gordon 2014). Although alternatives have been suggested (Carl- lar companions undergoes a supernova and produces a neutron star,
 son & Profumo 2014; Cholis et al. 2015b), most explanations of the and assuming the stellar binary remains intact after such a disruptive
 Galactic Center Excess (GCE) invoke dark matter annihilation or an event, the neutron star left behind accretes material from its low mass
 unresolved population of millisecond radio pulsars (MSPs). companion star forming an LMXB (Bhattacharya & van den Heuvel
 Annihilation of dark matter particles in regions of high density 1991). The transfer of angular momentum in the process "spins up"
 has been suggested to create a gamma-ray signature similar to that the neutron star to millisecond rotation periods, and an MSP is left
 observed (Goodenough & Hooper 2009; Hooper & Goodenough behind (Alpar et al. 1982; Archibald et al. 2009; Papitto et al. 2013).
 2011; Hooper & Linden 2011). More specifically, the spatial mor- Now, some studies have shown similarities between the spatial pro-
 phology of the GCE can be well described with the annihilation of file of LMXBs in M31 (which should be similar to their descendants,
 weakly interacting massive particles (WIMPs) following a Navarro MSPs) and an NFW density profile, such that either might explain the
 Frenk-White (NFW) density profile, as expected for the dark matter GCE morphology (Yuan & Zhang 2014; Eckner et al. 2018). Further-
 distribution in the Milky Way’s bulge (e.g. Abazajian & Kaplinghat more, the typical gamma-ray spectrum of MSPs, as measured from
 individual MSPs (Abdo et al. 2009) or from globular clusters (Abdo
 et al. 2010), where MSPs are highly overabundant (Camilo & Rasio
 ★ E-mail: olbo7449@colorado.edu 2005), can resemble that of the GCE (Abazajian 2011; Abazajian &

 © 0000 The Authors
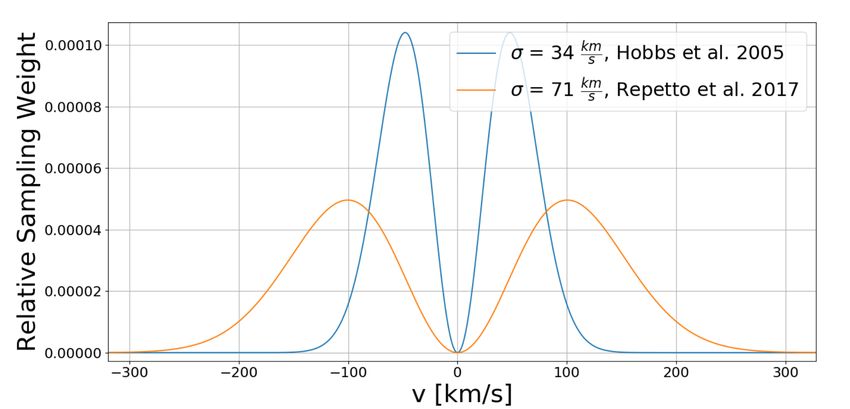
2 O. Boodram & C. Heinke
Kaplinghat 2012). The number of MSPs required to explain the GCE for 1 Gyr of evolution. From the final positions of these MSPs, we
has been estimated at 10,000-20,000 (Yuan & Zhang 2014), 2,000- are able to compare the MSP spatial distribution to the spatial mor-
14,000 (Cholis et al. 2015a), ∼40,000 (Ploeg et al. 2017), or ∼11,000 phology of the GCE detected by FermiLAT. This analysis has the
(Gonthier et al. 2018). Substantial recent discussion has been spent potential to constrain or exclude an origin of the GCE produced by
on whether the shape of the GCE is better described by the Galactic MSPs formed according to the stellar mass of our Galaxy (a primor-
bulge stellar distribution, or by a more spherical distribution (Macias dial MSP origin), though we also explore contributions from MSPs
et al. 2018; Bartels et al. 2018; Macias et al. 2019; Di Mauro 2021), produced by destroyed globular clusters and the nuclear star cluster
and/or whether it shows evidence for the "bumpiness" expected from (dynamical MSP origins). Section 2 demonstrates our treatment of
a stochastic distribution of MSP gamma-ray luminosities (Lee et al. initial conditions for a Galactic population of LMXBs/MSPs. Section
2016; Leane & Slatyer 2019; Buschmann et al. 2020; Leane & Slatyer 3 shows our interpretation of our simulated data. Finally, Section 4
2020). holds the conclusion and summary of our work.
 An important question is the origin of these MSPs, which could be
produced through normal binary evolution by the stars of the Galactic
bulge, or through dynamical interactions in globular clusters and/or 2 METHODS AND SIMULATIONS
the nuclear stellar cluster. MSPs are believed to be of order 100
times more common in dense globular clusters than in the Galaxy We used Galactocentric cylindrical coordinates where positions are
as a whole, as their progenitors the LMXBs are, due to dynamical measured with respect to the center of the Milky Way Galaxy for
interactions (Phinney & Kulkarni 1994; Hui et al. 2011; Bahramian our numerical simulations. Hence, the phase space elements of each
et al. 2013). Since of order half of all the globular clusters initially MSP in our simulation are described by the time evolution of six
present in our Galaxy are thought to have spiraled in to destruction quantities: , , , , , . Throughout our work, we assumed a
in the inner galaxy (Gnedin et al. 2014), Brandt & Kocsis (2015) circular velocity of 220 km/s at the solar radius of 8.2 kpc (Bland-
suggested that these destroyed globular clusters formed the MSPs Hawthorn & Gerhard 2016). These solar parameters appropriately
to produce the GCE, explored in more detail by e.g. Abbate et al. scale the units in galpy to physical units such as kpc.
(2018); Eckner et al. (2018); Fragione et al. (2018). Yuan & Zhang As stellar binaries form in the various mass components of our
(2014) suggested that MSPs are formed dynamically through inter- Galaxy, some binaries contain a low-mass and high-mass main se-
actions on large scales in the Bulge, following the discovery by Voss quence star. Eventually, the high mass star will undergo a supernova.
& Gilfanov (2007b) that there is an excess of LMXBs per unit mass The infalling material onto the proto-neutron star is not spherically
in the central 1’ (∼230 pc) of M31. Faucher-Giguère & Loeb (2011) symmetric which leads to asymmetries in the shock producing the
estimate that of order 1000 MSPs might be produced in the nuclear supernova. As such, the proto-neutron star is spit out from the SNR
star cluster through dynamical interactions, scaling from the proper- with a rather significant, randomly oriented velocity comparable to,
ties and pulsar content of the dense globular cluster Terzan 5. Macias if not larger than, the star’s intrinsic orbital velocity. Assuming the
et al. (2019) prefers (on the basis of preferred matching of the GCE binary still remains intact after such a disruptive event, the stellar
with the boxy bulge morphology) a "normal" (primordial binary) pair will have been supplied with additional velocity from the super-
origin of the MSPs producing the GCE. Most prior works did not nova known as a natal kick velocity. Thus, it is thought that LMXBs
analyze the effects of supernova kicks on the positions of primordial (and therefore their descendants MSPs) should receive kicks, altering
MSPs, though Eckner et al. (2018) used a simple smoothing func- their velocities from their birth velocities, and indeed these are seen
tion to roughly approximate the effect. As we were completing this (Brandt & Podsiadlowski 1995; Jonker & Nelemans 2004; Repetto
draft, we became aware of Ploeg & Gordon (2021) which performs et al. 2017).
a somewhat similar analysis, with a different emphasis. We sample natal kick velocities for each MSP from a Maxwellian
 distribution (1) (Hobbs et al. 2005):
 In this work, we attempt to constrain the kinematics of pulsars that
might explain the GCE radial distribution. Specifically, we aim to − 2
 ( ) = 2 2 2 (1)
explore the effects on the GCE of natal velocity kicks received by
newly formed neutron stars due to asymmetries in their supernovae where this sampling probability relies on , a given velocity compo-
explosions. We compare N-body simulations of MSPs with different nent, and , the 1D rms. We applied three natal kick prescriptions to
velocity kick prescriptions, compared to the GCE radial distribution our population of LMXBs/MSPs. We applied two kick prescriptions
as seen by Fermi-LAT. based on empirical observations of MSP velocities (Hobbs et al.
 To assess this issue, we simulate the dynamical evolution of a pop- 2005), and of neutron star LMXB velocities (Repetto et al. 2017), re-
ulation of NSs retained in binaries in the Galactic gravitational po- spectively (since LMXBs evolve into MSPs, we expect equivalence).
tential. (These binaries will eventually come into contact as LMXBs, Both studies employ a Maxwellian distribution for natal kicks, where
and then later appear as MSPs; as the binaries reach their new orbits the latter advocates for higher natal kicks than the former. While it
on timescales of ∼ 108 years, compared to the 109 and 1010 year is not impossible that MSPs in the Bulge might have a different
lifetimes of LMXBs and MSPs respectively, we assume LMXBs and kick distribution than elsewhere in the Galaxy, we are not aware
MSPs as having equivalent dynamical properties.) We initiate the of any rationale pointing toward such a scenario. For reference, we
binaries subject to our understanding of the stellar mass distribution also examined a population which did not receive any natal kicks
of our Galaxy, using prescriptions for the initial velocity kick of the whatsoever.
binaries (due to the formation of the NS) motivated from empirical Sampling each component from (1), a ® =
observations of LMXBs and MSPs. We evolve the binaries under ( , , , , , ) was generated for each MSP. A
the influence of a realistic Milky Way galactic potential. Using the hard cutoff of 600 km/s was enforced for any given velocity
galactic dynamics Python package, galpy (Bovy 2015), and its Runge component, as MSPs with velocities exceeding 600 km/s would
Kutta integrator in C, equations of motion for each LMXB/MSP are most likely be ejected from the Milky Way Galactic Bulge and not
integrated forward in time, implementing the Milky Way potential contribute to the GCE. Fig. 1 illustrates the two Maxwellian natal
into Hamilton’s equations, and the trajectories of the MSPs are solved kick distributions.

MNRAS 000, 1–9 (0000)
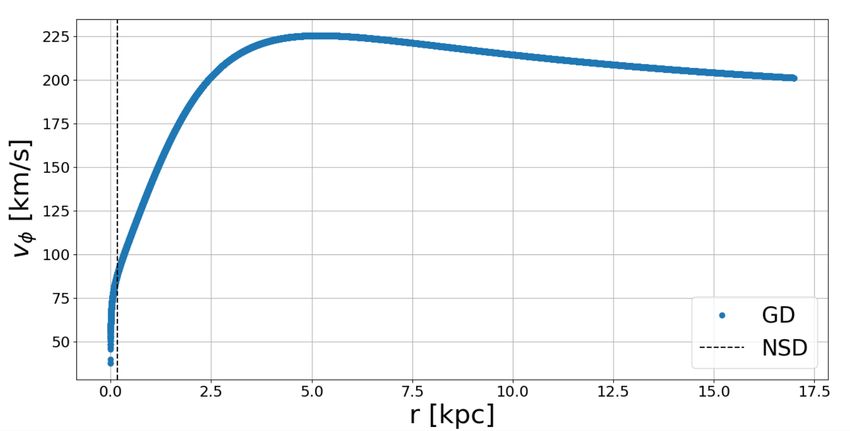
Pulsar Kicks and Galactic Gamma-rays 3 follows (3) (Launhardt et al. 2002): √︁ √ 0 2 2 2 + 2 < 1.2 + ( , ) = 1+( ℎ ) √︁ (3) 2 + 2 ≥ 1.2 0 where n = 2 and ℎ = 2.2 × 10⁻⁴ kpc. The piecewise nature of the NSC profile was adopted such that the binaries born within the NSC remained concentrated around the GC. Our NSD stellar mass profile follows (4) (Launhardt et al. 2002): 2 (0.5) | 2 | ( , ) = 0 (0.5) | ℎ | ℎ (4) where = 5, ℎ = 0.17 kpc, = 1.4, ℎ = 0.045 kpc. More Figure 1. 1D Maxwellian velocity distributions for natal kick prescriptions. specifically, Launhardt et al. (2002) supplied the radial component Hobbs et al. (2005) prefers a lower kick description of LMXBs, whereas of the NSD profile above, and we made an additional assumption Repetto et al. (2017) prefers higher kick velocities. that the z-component of the profile would fall off in a similar manner in order to reproduce a profile similar to the standard disk double exponential profile. The stellar mass profile for the GB required more careful consideration as the GB or the ‘bar’ of the Milky Way Galactic Component Total Stellar Mass [ ] is believed to be rotated with respect to the Galactocentric frame. Galactic Disk (GD) ∗ 4.1 × 10¹⁰ We made use of (5) (Bland-Hawthorn & Gerhard 2016) for our GB Nuclear Stellar Cluster (NSC) 1.8 × 10⁷ stellar mass profile Galactic Bulge (GB) 1.7 × 10¹⁰ −| 0 | −| 0 | −| 0 | Nuclear Stellar Disk (NSD) 1.4 × 10⁹ ( 0 , 0 , 0 ) = 0 ℎ ℎ ℎ (5) Halo 5.5 × 10⁸ where ℎ = 0.70 kpc, ℎ = 0.44 kpc, and ℎ = 0.18 kpc. Here, Table 1. Estimated stellar mass contained within each Galactic component, ( 0 , 0 , 0 ) are a set of ‘Bulge’ coordinates corresponding to cartesian following Bland-Hawthorn & Gerhard (2016). ∗ Both the stellar mass of the Galactocentric coordinates ( , , ) rotated 27◦ degrees clockwise thin (3.5 × 10¹⁰ ) and thick (6 × 10⁹ ) disk were incorporated into the about the Galactocentric z-axis. Finally, we chose our Halo stellar total stellar mass of the GD. mass profile to obey (6) (Xue et al. 2015): √︁ ( , ) = 0 ( 2 + 2 ) − (6) where = 2.1. We only selected the inner portion of Xue et al. Our next step was to place our MSPs into the Galaxy. To do this, (2015)’s broken power-law profile since we are only studying the we used the total stellar mass contained within each Milky Way mass inner regions of the Galaxy. We set our MSP population size to component (Bland-Hawthorn & Gerhard 2016), as listed in Table 1. have 1,000,000 MSPs distributed initially in the various stellar mass Initial cylindrical Galactocentric coordinates were generated for components of the Galaxy. The sizes of sub-populations in the various all LMXBs/MSPs from stellar mass density priors. Although it is stellar mass components were set by the stellar mass component’s not the only formation pathway, the standard formation mechanism contribution to the total mass contained within the central 20 kpc of assumes LMXBs and thus MSPs are produced from stellar binaries the Milky Way. For example, the GD holds ∼ 65% of the stellar mass formed within the various stellar mass components of the Galaxy. with the central 20 kpc, so we would sample ∼ 650, 000 MSP initial We expect the spatial distribution of LMXBs/MSPs to, initially, fol- coordinates from the GD profiles. Our fixation with a 20 kpc sphere is low the stellar mass profiles in our Galaxy. Voss & Gilfanov (2007a) from another cutoff we enforced where we would disregard any MSPs argue that LMXBs in the central bulge of M31 (the central 1’, corre- initially placed exterior to this 20 kpc boundary, as these MSPs would sponding to 1.6 degrees for the Milky Way bulge) are dominated by have little influence on the GCE. To summarize, with the normalized systems formed through dynamical interactions due to the relatively stellar mass profiles above, we would sample an appropriate number high density of the bulge. However, their calculations of dynamical of initial coordinates from each stellar component proportional to interactions at bulge velocity dispersions find 5 times more LMXBs the component’s contribution to the total mass enclosed within the produced with black holes than with neutron stars; such systems Milky Way. cannot produce MSPs, and thus this route looks less promising to We adopted a relatively standard prescription for assigning or- produce the GCE. Later we will consider alternative scenarios in bital velocities to each LMXB intrinsic to their birthplace compo- which MSPs are deposited from destroyed globular clusters (Brandt nent. Disk-like components such the GD or the NSD provided purely & Kocsis 2015). tangential velocities from a rotation curve generated, using galpy’s Using the stellar mass profiles for the GD, the NSC, the NSD, the functionality, from our realistic Milky Way potential. Less structured GB, and the Halo (Launhardt et al. 2002; Bland-Hawthorn & Gerhard components like the Halo, the NSC, or the GB would supply their 2016; Xue et al. 2015), we normalized these profiles with the total binaries with uniform magnitude, randomly oriented velocities com- masses (Bland-Hawthorn & Gerhard 2016) contained within each patible with observations √ (Schödel et al. 2009; √ Valenti et al. 2018). In component. For the GD, we utilized the standard double-exponential more detail, ® = 3 , ® ® = 3 , ® ® = 220® mass density profile with its accepted scale length parameters (2) where 1D velocity dispersions are = 100 km/s and = 140 −| | km/s (Schödel et al. 2009; Valenti et al. 2018), and ® is a randomly − ( , ) = 0 ℎ ℎ (2) oriented unit vector. For the GD and NSD, , = 0. Intrinsic GD ( ) were drawn directly from our Milky Way potential rotation where ℎ = 4 kpc and ℎ = 0.1 kpc. For the NSC, the profile we used curve whereas all intrinsic NSD ( ) were set to (0.17 ) = MNRAS 000, 1–9 (0000)
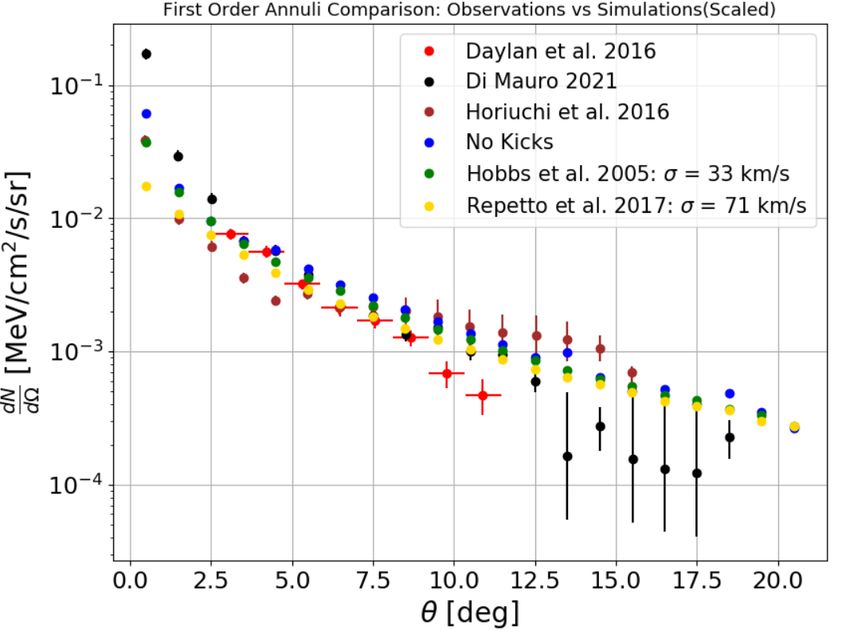
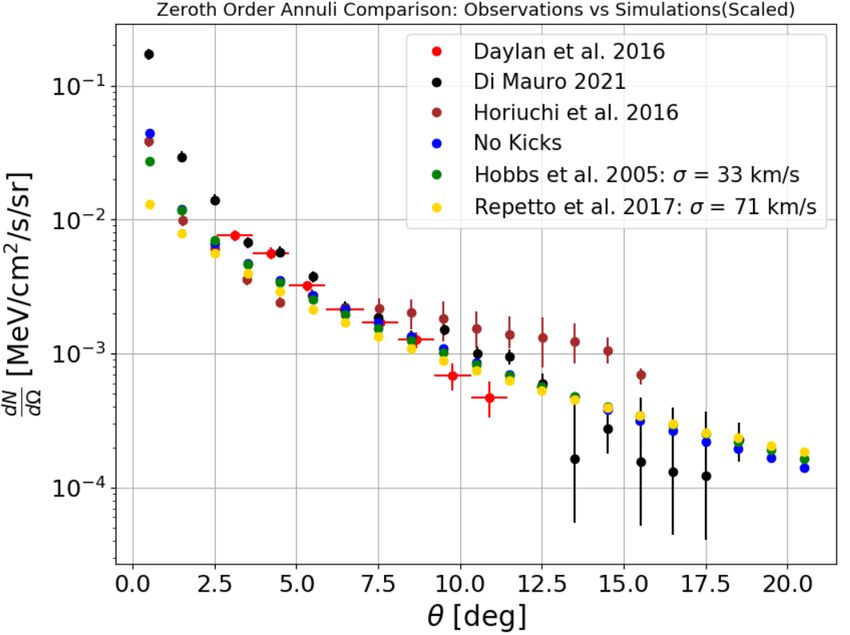
4 O. Boodram & C. Heinke

 Natal Kick( ) Di Mauro 2021 Horiuchi 2016 Daylan 2016

 No Kicks 6.96 ± 0.14 4.48 ± 0.09 5.00 ± 0.11
 33
 7.65 ± 0.15 4.93 ± 0.10 5.38 ± 0.12
 71
 8.41 ± 0.17 5.45 ± 0.11 5.57 ± 0.12

 Table 2. Total gamma-ray luminosities (×1029 W) produced from our simu-
 lated MSPs in the central 21◦ for each observed data set and kick prescription.
 Our ‘No Kicks’ are simulations where LMXBs/MSPs were not provided any
 natal kicks and ended with 403,266 MSPs within the central 21◦ . 33
 simulations use the kick prescription in Hobbs et al. (2005) and had 382,490
 MSPs within the central 21◦ . 71 simulations use the kick prescription
 in Repetto et al. (2017) and had 324,278 MSPs within the central 21◦ . We
 simply fit our simulated surface brightnesses to our observed data sets to de-
Figure 2. Intrinsic orbital, tangential velocities supplied to MSPs born either
 termine the gamma-ray luminosity required for a single MSP and multiplied
in the GD or NSD. The tangential velocities of the GD-born MSPs are shown
 this parameter by the total MSPs within the central 21◦ , effectively removing
in blue as a function of cylindrical, Galactocentric radius. The intersection
 the dependence on the number of MSPs simulated.
between the black, dashed line and blue curve shows the tangential velocities
given to NSD-born MSPs.

 which we made use of in our comparison between simulated and ob-
88.7 km/s. Fig. 2 depicts the intrinsic rotation curves applied to the served data. We believe the differences in GeV emission in the central
MSPs of disk-like stellar mass components. The total, initial velocity regions of the Galaxy for Di Mauro (2021), Horiuchi et al. (2016),
of a given MSP was set as the superposition between these veloc- and Daylan et al. (2016) arise from their different filtering analysis,
ities provided intrinsically from the stellar mass components and including interstellar emission models. The observational data was
the sampled natal kick velocities. So, our initial parameters could provided as surface brightness as a function of angular radius seen
be divided into three sub-groups dependent on the kick prescription on the sky. So, we had to craft our own surface brightnesses for each
where 1,000,000 MSPs were simulated for each kind of kick. annulus. To do this, we extracted the final cylindrical coordinates,
 With our initial phase space elements obtained, we then had to set for each 1,000,000 MSP population, to generate a 2D spatial distri-
the gravitational environment of which our MSP population would bution of MSPs. Using astropy’s (Astropy Collaboration et al. 2018)
traverse through. To do this, we had to implement and craft a re- coordinate transformation capabilities, we were able to transform our
alistic gravitational potential mimicking the one of the Milky Way. Galactocentric coordinates ( , , ) into Galactic coordinates ( , , )
Making use of galpy’s built-in potential class, we introduced the where is the distance to the source from the Sun.√ At this point, we
MWPotential2014 potential as the foundation for our gravitational defined the angular radius of a given MSP to be 2 + 2 .
potential because it produced a reasonable fit to a large variety of ob- We computed surface brightness using two orders of approxima-
served Milky Way data (Bovy 2015). MWPotential2014 models the tion. To zeroth order, all MSPs in the GC are roughly the same
GB potential using a PowerSphericalPotentialwCutoff potential, the distance from the Earth, and, hence, the surface brightness in a given
GD potential with a MiyamotoNagaiPotential, and the dark matter annulus on the sky is directly proportional to the number of MSPs
Halo potential using a NFWPotential. However, for our purposes, we within that annulus. So we would count up the number of MSPs
needed to include the gravitational effects of the NSC along with the within a range of angular radii, divide by the solid angle of the an-
supermassive black hole Sgr A* as these components play a strong nulus, and report the corresponding approximate surface brightness.
role in the dynamical evolution of stellar populations near the GC. Fig. 3 illustrates the zeroth order comparison between our data and
We superposed a PlummerPotential (Pflamm-Altenburg & Kroupa the observed data sets. For a first order approximation, we consulted
2009), to model the NSC, and a KeplerPotential, to model Sgr A*, the literature for a MSP gamma-ray luminosity, L , = 4.7×1025
with the MWPotential2014 to produce the final gravitational potential W (Hooper & Mohlabeng 2016), and computed gamma-ray fluxes
acting on our MSP population. of each annulus using the distances along line of sight. Fig. 4 show-
 For each population of 1,000,000 MSPs, characterized by their cases this higher order comparison. We scaled our synthetic profiles
unique natal kick prescription, we would evolve them in this real- to match the overall normalization of the observed GeV profiles pro-
istic Milky Way gravitational potential for 1 Gyr. This simulation vided in Di Mauro (2021), Horiuchi et al. (2016), and Daylan et al.
length was chosen such that the MSPs could settle into a final, stable (2016), allowing comparison of the shapes of the curves over the
configuration near the GC or be ejected from the Galaxy altogether. angular range. This is justified, as we are uncertain about the num-
Every 100 Myrs, the cylindrical Galactocentric coordinates of each ber of pulsars residing in the central parts of the Galaxy, and their
MSP would be collected. Although the dynamical trajectory holds corresponding gamma-ray luminosity, which introduces an arbitrary
rich information itself, we were particularly interested in the final normalization factor.
locations of each MSP which we treated as an analog of today’s MSP We fit, using least squares, our simulated data to constrain this
distribution. parameter for each supplied data set and each type of kick (9 in
 total). We report the total luminosity produced by all the simulated
 MSPs within our area of interest (central 21◦ on the sky) as this result
 would be independent of population size once fit to our observed data.
3 RESULTS AND DISCUSSION Table 2 lists our results. With our fit luminosities, we then linearly
 interpolated our simulated first order surface brightnesses in order to
3.1 21 degree analysis
 make an adequate comparison between the three observed data sets.
Previous studies have supplied detailed observational data of the A logarithmic 2 analysis was performed for each type of kick for
GCE (Di Mauro 2021; Horiuchi et al. 2016; Daylan et al. 2016), each data set where the difference in the logarithms of the simulated

MNRAS 000, 1–9 (0000)
Pulsar Kicks and Galactic Gamma-rays 5

 Natal Kick( ) Di Mauro 2021 Horiuchi 2016 Daylan 2016

 No Kicks 235.290 125.647 30.683
 33
 324.931 114.323 29.066
 71
 554.987 165.682 29.304

 Table 3. 2 values for the fit with each kick prescription to the three observed
 data sets, using the full angular range. There were 18 degrees of freedom in
 the analysis using Di Mauro (2021), 15 in the analysis using Horiuchi et al.
 (2016), and 7 in the analysis using Daylan et al. (2016). There is a strong
 preference for No Kicks from the Di Mauro (2021) data, although even this
 fit is not very good. As the Daylan et al. (2016) data omits the central few
 degrees, it is much less sensitive to the variation in initial kicks.

 Horiuchi et al. (2016), and 7 for comparisons with Daylan et al.
 (2016). Since the Fermi-LAT data collected from Di Mauro (2021)
 spans the largest angular range across the sky, providing the most
Figure 3. Observed surface brightnesses (from Daylan, Di Mauro, and Ho- stringent constraints, we are inclined to interpret comparisons with
riuchi; Daylan omits the central few degrees) compared with our synthetic this data set with more weight than the others.
distributions of MSPs (with different initial kick velocities), as a function of As seen in this table, there is a relatively strong preference for
angle from the Galactic Centre. In this zeroth order approximation, all MSPs pulsars without kicks. It is clear from Fig. 4 that the observed data
in our simulations reside 8.2 kpc away from us, and, hence, surface bright- differ significantly from the simulated data. The simulated MSP pop-
nesses in each annulus are directly proportional to the number of gamma-ray ulations cannot generate surface brightnesses high enough relative
producing MSPs in each annulus. Differences can be seen among the observed to the Di Mauro (2021) profile in the central three degrees of the
surface brightnesses, but clearly the observed surface brightnesses tend to be
 Galaxy. Even MSPs without kicks, the most concentrated popula-
steeper in the central few degrees than MSP distributions with realistic kick
prescriptions.
 tion, cannot produce such high surface brightnesses. It thus seems
 unlikely that gamma-rays produced by primordially formed MSPs
 can be the process producing the bulk of the GCE.

 3.2 5 degree analysis
 We also tried an analysis focusing only on the central 5 degrees
 around the Galactic Center. For this analysis, we do not use data
 from Daylan et al. (2016), which does not cover this region. For >
 5◦ , other gamma-ray sources apart from emission from the GC could
 influence the gamma-ray observations made by Di Mauro (2021);
 Horiuchi et al. (2016); Daylan et al. (2016). These studies would have
 had to filter out these intruding signals, which introduce another layer
 of uncertainty in their reported surface brightnesses at larger angular
 radii. Hence, smaller angular radii data may be more accurate.
 Since we are examining the difference in profile behaviour and
 not the magnitudes of the brightnesses, we were free to introduce
 arbitrary normalizations to get the simulated and observed data as
 close as possible before performing another logarithmic 2 analysis.
 We performed a similar type of normalization as in the central 21
Figure 4. Observed surface brightnesses compared to synthetic surface degrees analysis where we normalized our synthetic profiles to the
brightnesses of each annulus across the sky. Under this first order approxima- observed data in the central 5 degrees of the Galactic Center. Scaling
tion, we use the inferred distance of each MSP in our simulation, and, hence, all three simulated data sets to both the surface brightness profile of
surface brightnesses in each annulus are directly proportional to the fluxes of
 Di Mauro (2021) and the surface brightness profile of Horiuchi et al.
gamma-ray producing MSPs in each annulus. The differences with Fig. 3 are
 (2016), we calculated the logarithmic 2 with 4 degrees of freedom
subtle.
 for both observed data sets as shown in Table 4.
 Fig. 5 and Fig. 6 contrast the varying surface brightness profiles
data and observations determined the 2 statistic. When errorbars between observed and simulated data. Our results are essentially sim-
were provided, we used a logarithmic average of the upper and lower ilar to those using the full 21 degree datasets; the Di Mauro dataset
error bars. Observed data points without error bars were given a 10% is too centrally concentrated to be explained by any of our simulated
error, and observed upper limits were scaled down by a factor of 3 data, while the Horiuchi data can be reasonably fit only by our simu-
and provided with error bars such that the upper error bar reached lation involving no initial neutron star kicks, which does not appear
the original, unscaled upper limit. Table 3 demonstrates the results physically plausible. These results imply either: (i) MSPs are not the
from our 2 analysis, where the number of degrees of freedom were origin of the GCE; or (ii) MSPs in the GC are formed and deposited
18 for comparisons with Di Mauro (2021), 15 for comparisons with via other processes, such as dynamical formation mechanisms.

 MNRAS 000, 1–9 (0000)
6 O. Boodram & C. Heinke

 Natal Kick( ) Di Mauro 2021 Horiuchi 2016 Natal Kick( ) Di Mauro 2021 Horiuchi 2016

 No Kicks 83.781 19.178 No Kicks 2.180 0.2455
 33
 151.437 35.480 33
 2.236 0.2604
 71
 298.930 122.991 71
 2.587 0.4436

Table 4. 2 values for comparison of simulated data normalized to the ob- Table 5. Extra gamma-ray luminosity (×1029 W) needed to inflate the central
served data, both with 4 degrees of freedom, in the central 5 degrees on the part of our synthetic surface brightnesses to match the sharp increase seen
sky. The normalization ensures that the shapes are compared. It is clear that in the observed data. These excess luminosities can correct our simulated
none of the simulated populations produce a gamma-ray emission profile very profiles such that we have agreement in the central regions of the sky.
consistent with the GCE. If primordial MSPs produce all the GCE, this table
indicates that low-kick MSPs are strongly preferred.

 stellar mass components. Hence, low natal kick MSPs from globular
 clusters could potentially contribute to the gamma-ray excess. There
 are two primary questions one needs to address when looking at
 this mechanism: (1) How many MSPs are required, in excess of the
 Galaxy-born MSPs, to boost gamma-ray surface brightnesses in the
 central regions of the sky to agree with observational data? (2) What
 is the expected radial profile of globular cluster debris?
 To address (1), our analysis boils down to determining the extra
 MSPs required to inflate the central regions of our surface brightness
 profiles, seen in Fig. 4, to match the Di Mauro (2021) 1-10 GeV data,
 along with the data of Horiuchi et al. (2016). Assuming our simulated
 and observed brightness profiles are in agreement for ≥ 5◦ , we
 normalized our simulated surface brightness for [3◦ , 5◦ ] to ensure
Figure 5. Observed surface brightnesses from Di Mauro (2021) plotted the difference in brightness, between simulated and observed profiles,
against synthetic surface brightnesses from each kick prescription in the represented extra luminosity that needed to be injected via globular
central 5 degrees. The lines connecting all data points are from linear inter- cluster deposited MSPs. This normalization ensures the difference
polation. The simulated data do not appear to match the shape of the observed between profiles is independent of simulated population size. With
brightness profile. the difference in brightnesses and annulus solid angles on hand, we
 were able to compute the excess flux required for agreement with
 observations. Here, we make a zeroth order approximation that all
 simulated MSPs within the central region of the sky (central 3.5◦ ) are
 MSPs residing in close proximity to the GC. Hence, all extra MSPs
 are approximately 8.2 kpc away from us. With this approximation,
 we can then compute the extra luminosity in excess of the gamma-ray
 luminosity provided by primordial Galaxy-born MSPs alone. Table 5
 depicts our analysis.
 Making use of an average MSP gamma-ray luminosity L ,
 = 4.7 × 1025 W (Hooper & Mohlabeng 2016), we can provide an
 estimate of the number of MSPs required from inspiralling glob-
 ular clusters. If globular cluster deposited MSPs were the source
 of this excess luminosity, approximately 4,966 MSPs or 673 MSPs
 would have to be injected, according to Di Mauro (2021), or Hori-
Figure 6. Observed surface brightnesses from Horiuchi et al. (2016) plot- uchi et al. (2016), respectively. It has been estimated that of order
ted against synthetic surface brightnesses from each kick prescription in the 1000-2000 MSPs lie within globular clusters orbiting the Milky Way
central 5 degrees. The lines connecting all data points are from linear inter- today (Heinke et al. 2005; Turk & Lorimer 2013, Zhao & Heinke,
polation. The population of MSPs without natal kicks and the observed data submitted). Thus, the larger population size estimates would require
here agree relatively well, implying that a population of MSPs without kicks,
 substantially more (a factor of 5) globular clusters to be destroyed
residing in the GC, could produce the GCE.
 in the inner Milky Way, than exist today.1 Some studies of the de-
 struction of globular clusters do predict ratios of this order (Horta
 et al. 2021). We therefore consider adding together our simulated
3.3 Inspiraling globular clusters
 primordial MSP profile with dynamically deposited MSP profiles
With the capabilities of galpy and our simulated data, we were able to (below).
investigate the plausibility of globular cluster deposited MSPs as an
alternative/additional source of MSPs in the GC. Globular clusters
that formed in the young Milky Way may have inspiralled to the
GC due to dynamical friction (Gnedin et al. 2014). Once tidally
disrupted and amalgamated into the Milky Way, the MSPs within 1 The relevant factor is actually stellar encounter rate, for MSP production;
such clusters may have been deposited into the GC, resulting in an it is unclear if destroyed globular clusters would be preferentially of higher
excess relative to the population of MSPs born from our Galaxy’s or lower encounter rates than surviving ones.

MNRAS 000, 1–9 (0000)
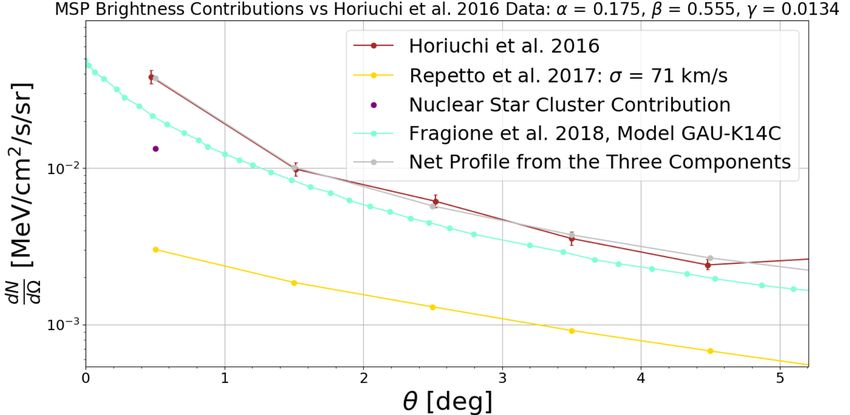
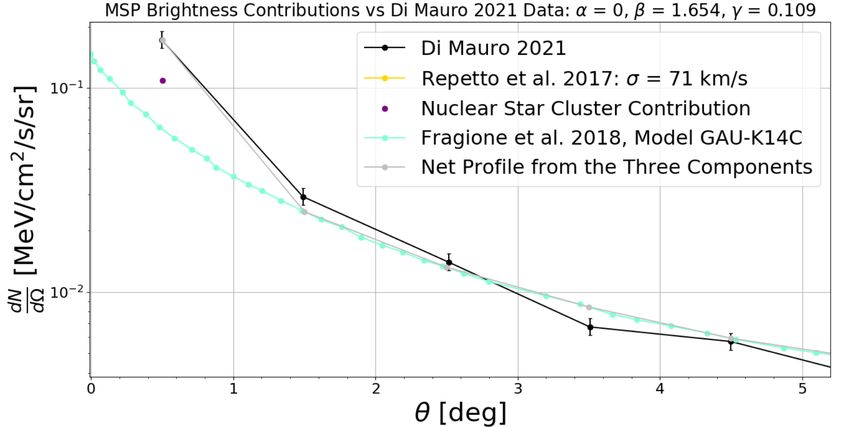
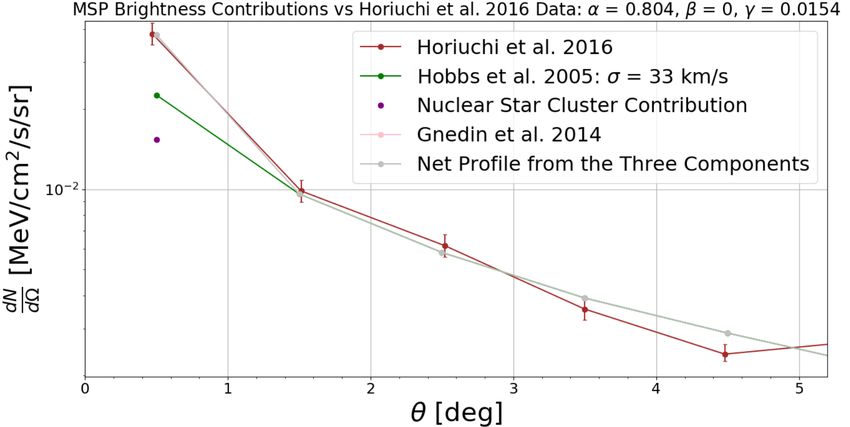
Pulsar Kicks and Galactic Gamma-rays 7
3.4 Nuclear stellar cluster
 No Kicks
It has been postulated that, due to its similarities with a globular Model GAU-K14C Di Mauro 2021 Horiuchi et al. 2016
cluster dynamical environment, the NSC would have enhanced MSP
 0+4871
 −0 527+3007
 −527
produced rates from dynamical captures in addition to in situ for- 5956 ± 3980 2283 ± 1574
mation. Muno et al. (2005) observed several X-ray transients (likely 164 ± 26 15 ± 7
LMXBs) within the central parsec (0.45’) around Sgr A*, and per- 2 /dof 8.982 1.418
formed a toy calculation estimating that 100-1000 neutron stars and
black holes in the NSC could have exchanged into binaries. Gen- Model LON-K14
erozov et al. (2018) performed detailed Fokker-Planck calculations 0+9242 0+6158
 −0 −0
of nuclear star clusters, and estimated the rates of tidal captures, +6315
 4998−4998 +2696
 2146−2146
predicting of order 100 LMXBs containing neutron stars, and an- 179 ± 59 +25
 23−23
other 100 containing black holes, within 3.5 pc of Sgr A*. Assuming 2 /dof 13.835 1.005
typical lifetimes of 1 Gyr for LMXBs and 10 Gyrs for MSPs, this
 Gnedin et al. 2014
would suggest of order 1000 MSPs produced in the NSC. Abbate
et al. (2018) calculated the encounter rate for the NSC, finding a 7322 ± 5858 4904 ± 2813
stellar encounter rate similar to that of Terzan 5 (Bahramian et al. 0+6021
 −0 0+1885
 −0
 136 ± 58 +8
 4−4
2013), which is thought to hold of order 150 MSPs (Bagchi et al.
2011); Abbate et al. (2018) prefer to explain MSPs in the central par- 2 /dof 16.352 2.417
secs as deposited by globular clusters inspiraling and dissolving. On Hobbs et al. 2005 Kicks
the other hand, Faucher-Giguère & Loeb (2011) proposed factors that Model GAU-K14C Di Mauro 2021 Horiuchi et al. 2016
would increase the number of MSPs produced in the NSC, preferring
 0+3712 +2408
 2009−2009
an estimate of 500 MSPs for the NSC. We do not attempt our own −0
 5956 ± 3382 +1406
 1387−1387
theoretical calculation of the NSC population of MSPs, but below
 164 ± 20 20 ± 6
we fit the observed GCE with a model including an NSC population
 2 /dof 8.982 1.1
(which is a point source at our resolution), and then will compare the
required number to the estimates above. Model LON-K14

 0+10705
 −0 0+6520
 −0
 +8142
 4998−4998 +3180
 2146−2146
3.5 Multiple mechanisms
 179 ± 19 23 ± 5
Finally, we implemented another approach to assess whether or not 2 /dof 13.835 1.005
a primordial (Galaxy-born) MSP population coupled with a globular Gnedin et al. 2014
cluster deposited MSP population and a dynamically formed NSC
 +7223
 6573−6573 4389 ± 3041
MSP population could explain the GCE. With this approach, we could
estimate the relative contributions of each of these MSP populations 0+8273
 −0 0+2280
 −0
 181 ± 68 24 ± 20
to the GCE. To predict the distribution of MSPs from globular cluster
 2 /dof 17.188 1.585
dynamical evolution, we used the detailed simulations of Fragione
et al. (2018). Making use of Fragione et al. (2018)’s Figure 4, we Repetto et al 2018 Kicks
implemented both their Model GAU-K14C and Model LON-K14 Model GAU-K14C Di Mauro 2021 Horiuchi et al. 2016
as potential models of gamma-ray surface brightness emission from
 0+1568 871+1046
globular cluster deposited MSPs. Further, we also utilize the data −0 −871
 5956 ± 1574 1999 ± 674
shown on Fragione et al. (2018)’s Figure 1 which implements models
 164 ± 22 21 ± 8
from Gnedin et al. (2014), and calculate the surface brightness profile 2 /dof 8.982 1.099
expected from such a cumulative stellar mass distribution. In the end,
we fit the following overall surface brightness incorporating all three Model LON-K14
MSP sources: 0+2210 0+1484
 −0 −0
 4998 ± 1841 2146 ± 801
 = + + , R 179 ± 22 23 ± 7
 Ω Ω Ω
 2 /dof 13.835 1.005
where
 ( Gnedin et al. 2014
 < 0.6◦
 = 0+4017 378+5790
 0 ≥ 0.6◦ −0 −378
 +4380
 7544 ± 5006 3009−3009
 121 ± 63 +54
 0 −0
For the subscripts, indicates the primordial MSP contribution from
 2 /dof 22.817 4.563
our N-body simulations, indicates the globular cluster MSP con-
tribution from Fragione et al. (2018), and indicates an unknown,
constant NSC MSP contribution. The piecewise nature of follows Table 6. This table demonstrates the best fit relative contributions of MSP
from how dynamically formed MSPs in the NSC region of the Galaxy sources ( for primordial MSP contributions, for MSPs from destroyed
are constrained only to the NSC itself. We fit for , , and using the globular clusters, for MSPs from the NSC) to the GCE, along with the 2
radial distributions of Di Mauro (2021) and Horiuchi et al. (2016) and number of degrees of freedom (dof). Each entry in the table represents the
contained in the central 3.5◦ . Table 6 highlights our best fit parameter best fit number of MSPs contained in each contribution assuming a L ,
 = 4.7 × 1025 W (Hooper & Mohlabeng 2016) and d = 8.2 kpc.
values, assessed from their 2 statistic.

 MNRAS 000, 1–9 (0000)
8 O. Boodram & C. Heinke
 The results of this analysis are the following. The majority of fits
are degenerate between the contributions of the primordial MSP pop-
ulation and a population of MSPs from destroyed globular clusters,
as long as a nuclear star cluster contribution is included (this contri-
bution is significant at & 2 in the majority of fits). However, the Di
Mauro (2021) observations are significantly better fit by the GAU-
K14C destroyed globular cluster model than by any of our primordial
MSP models (and are better fit by any of the 3 destroyed cluster mod-
els than by primordial MSPs with Repetto kicks), while the Horiuchi
et al. (2016) data are typically degenerate between contributions from
primordial MSPs vs. destroyed globular clusters, along with a small
NSC contribution. We also note that the inferred numbers of MSPs
produced by the NSC in the Di Mauro (2021) fits, of order 150, are
roughly consistent with the encounter rates estimated by Abbate et al.
(2018) for the NSC, and with the number estimated for Terzan 5. The
Horiuchi et al. (2016) fits require substantially smaller numbers of
NSC MSPs, of order 20.
 The quality of the fit parameters of Table 6 is also interesting. All
the fits to the Di Mauro (2021) data are significantly poorer than fits to
the Horiuchi et al. (2016) data; the latter are generally consistent with
a "good" fit (reduced 2 ∼ 1) while the former have much larger 2
values. It is interesting that two different processing methods of the
same, raw FermiLAT gamma-ray data cannot be described equally
well by our multi-component model. To solidify our conclusions
above, further observational analysis and data collection of the GCE
must be performed to determine whether the Di Mauro (2021) or
Horiuchi et al. (2016) data is more accurate.
 To visualize the contributions of each population, Fig. 7 illustrates
the surface brightness profiles for each component (primordial, glob-
ular cluster deposited, and NSC) scaled by some of the best fit param-
eters , , along with the observed surface brightness profiles the
best fit parameters were fit to. Further, we show an additional surface
brightness profile representing the combination (summation) of the
three component profiles. This illustrates the quality of the net pro-
file resulting from the fit parameters. We illustrate three fits; top, an
example of one of the best fits (though still quite poor, 2 /dof=8.982)
to the Di Mauro (2021) data (where the primordial MSP contribution Figure 7. This figure captures three sets of best fit parameters ( , , ) for
is negligible); middle, a good fit ( 2 /dof=1.099) to the Horiuchi et al. varying globular cluster models and observed data sets. See text for details.
(2016) data (with contributions from both primordial and destroyed
cluster MSPs); and bottom, a relatively poor fit ( 2 /dof=1.585) to the
Horiuchi et al. (2016) data using primordial MSPs. As the central- surface brightness profiles. We then compared the radial distribu-
degree datapoint can be renormalized using the NSC contribution, tions of our simulated pulsar populations to different measurements
the poor quality of the last fit is due to a mismatch at larger angles. of the gamma-ray radial profile. From our analysis, it appears that
 these Galaxy-born pulsars alone have a difficult time reproducing the
 concentrated brightnesses in the central 1◦ . If pulsars were the source
 of this excess, they require incredibly low natal kick velocities to pro-
4 CONCLUSIONS
 duce such concentrated emission, and still do not reproduce one of
Following observations of the Milky Way center, many analyses re- the observed gamma-ray radial profiles.
vealed an unexpected excess of gamma-ray emission which cannot We also investigated two alternative mechanisms for pulsar pro-
be accounted for by astrophysical backgrounds. Two main hypothe- duction in the Galactic Center. Globular clusters orbiting the Milky
ses have surfaced to explain this gamma-ray excess. One credits the Way can inspiral to deposit their pulsars in the central regions of the
excess emission to highly concentrated annihilating dark matter par- Galaxy upon their destruction. This adds to the central pulsar popu-
ticles in the Galactic Center. Another suggests an unresolved, dense lation leading to a peaked emission profile in the central regions of
population of central millisecond radio pulsars supplies the excess. the sky. The other alternative is dynamical production directly within
 To examine the pulsar origin as a viable explanation for the gamma- the nuclear star cluster (NSC), as seen in globular clusters. We mod-
ray excess, we simulated various populations of millisecond pulsar eled the observed gamma-ray radial profiles with components of
progenitors under the influence of a realistic Milky Way galactic primordial MSPs, inspiraling evaporating globular clusters, and a
potential. In our N-body simulations, the pulsar populations were NSC component. We find that the Horiuchi et al. (2016) gamma-ray
initially provided with various intrinsic natal kick velocities, and profile requires a dominant component that can be either primor-
placed according to the known stellar mass components of the Milky dial, or produced by inspiraling evaporating clusters, along with a
Way. By tracking the pulsar trajectories for one Gyr and mapping (generally) significant (but small) NSC component. Depending on
their final positions onto the sky, we generated synthetic gamma-ray the choice of evaporating cluster model component, fits with the

MNRAS 000, 1–9 (0000)
Pulsar Kicks and Galactic Gamma-rays 9
Di Mauro (2021) gamma-ray profile may strongly prefer that the Eckner C., et al., 2018, ApJ, 862, 79
dominant component be produced by evaporating clusters, and also Faucher-Giguère C.-A., Loeb A., 2011, MNRAS, 415, 3951
requires a significant NSC component (of order 150 MSPs). How- Fragione G., Antonini F., Gnedin O. Y., 2018, MNRAS, 475, 5313
ever, the Di Mauro (2021) gamma-ray fits do not achieve good fits, Generozov A., Stone N. C., Metzger B. D., Ostriker J. P., 2018, MNRAS,
suggesting that if this description of the GCE is correct, then either 478, 4030
 Gnedin O. Y., Ostriker J. P., Tremaine S., 2014, ApJ, 785, 71
we have not found the correct description of the MSP populations, or
 Gonthier P. L., Harding A. K., Ferrara E. C., Frederick S. E., Mohr V. E., Koh
that (at least a large fraction of) the GCE is not produced by MSPs. Y.-M., 2018, ApJ, 863, 199
 Our analysis does not strongly prefer either a dark matter origin or Goodenough L., Hooper D., 2009, arXiv e-prints, p. arXiv:0910.2998
a MSP origin, but it significantly constrains the MSP origin scenario. Heinke C. O., Grindlay J. E., Edmonds P. D., Cohn H. N., Lugger P. M.,
Robust determination of the gamma-ray radial profile would improve Camilo F., Bogdanov S., Freire P. C., 2005, ApJ, 625, 796
the constraints upon the possible MSP origin of the gamma-ray ex- Hobbs G., Lorimer D. R., Lyne A. G., Kramer M., 2005, MNRAS, 360, 974
cess. Hooper D., Goodenough L., 2011, Physics Letters B, 697, 412
 Hooper D., Linden T., 2011, Phys. Rev. D, 84, 123005
 Hooper D., Mohlabeng G., 2016, J. Cosmology Astropart. Phys., 2016, 049
 Horiuchi S., Kaplinghat M., Kwa A., 2016, J. Cosmology Astropart. Phys.,
ACKNOWLEDGEMENTS 2016, 053
We would like to thank Jo Bovy for his useful galactic dynamics Horta D., et al., 2021, MNRAS, 500, 5462
 Hui C. Y., Cheng K. S., Wang Y., Tam P. H. T., Kong A. K. H., Chernyshov
package galpy and insightful discussions regarding inspiraling glob-
 D. O., Dogiel V. A., 2011, ApJ, 726, 100
ular clusters, and J. Bramante for discussions on related topics. COH Jonker P. G., Nelemans G., 2004, MNRAS, 354, 355
is supported by NSERC Discovery Grant RGPIN-2016-04602, and Launhardt R., Zylka R., Mezger P. G., 2002, A&A, 384, 112
OB in part by an NSERC USRA. Leane R. K., Slatyer T. R., 2019, Phys. Rev. Lett., 123, 241101
 Leane R. K., Slatyer T. R., 2020, Phys. Rev. Lett., 125, 121105
 Lee S. K., Lisanti M., Safdi B. R., Slatyer T. R., Xue W., 2016, Phys. Rev. Lett.,
DATA AVAILABILITY 116, 051103
 Macias O., Gordon C., 2014, Phys. Rev. D, 89, 063515
The data underlying this article will be shared on reasonable request Macias O., Gordon C., Crocker R. M., Coleman B., Paterson D., Horiuchi S.,
to the corresponding author. Pohl M., 2018, Nature Astronomy, 2, 387
 Macias O., Horiuchi S., Kaplinghat M., Gordon C., Crocker R. M., Nataf
 D. M., 2019, J. Cosmology Astropart. Phys., 2019, 042
 Muno M. P., Pfahl E., Baganoff F. K., Brandt W. N., Ghez A., Lu J., Morris
REFERENCES M. R., 2005, ApJ, 622, L113
Abazajian K. N., 2011, J. Cosmology Astropart. Phys., 2011, 010 Papitto A., et al., 2013, Nature, 501, 517
Abazajian K. N., Kaplinghat M., 2012, Phys. Rev. D, 86, 083511 Pflamm-Altenburg J., Kroupa P., 2009, MNRAS, 397, 488
Abbate F., Mastrobuono-Battisti A., Colpi M., Possenti A., Sippel A. C., Dotti Phinney E. S., Kulkarni S. R., 1994, ARA&A, 32, 591
 M., 2018, MNRAS, 473, 927 Ploeg H., Gordon C., 2021, arXiv e-prints, p. arXiv:2105.13034
Abdo A. A., et al., 2009, Science, 325, 848 Ploeg H., Gordon C., Crocker R., Macias O., 2017, J. Cosmology Astropart.
Abdo A. A., et al., 2010, A&A, 524, A75 Phys., 2017, 015
Ackermann M., et al., 2017, ApJ, 840, 43 Repetto S., Igoshev A. P., Nelemans G., 2017, MNRAS, 467, 298
Ajello M., et al., 2016, ApJ, 819, 44 Schödel R., Merritt D., Eckart A., 2009, A&A, 502, 91
Alpar M. A., Cheng A. F., Ruderman M. A., Shaham J., 1982, Nature, 300, Turk P. J., Lorimer D. R., 2013, MNRAS, 436, 3720
 728 Valenti E., et al., 2018, A&A, 616, A83
Archibald A. M., et al., 2009, Science, 324, 1411 Vitale V., Morselli A., 2009, arXiv e-prints, p. arXiv:0912.3828
Astropy Collaboration et al., 2018, AJ, 156, 123 Voss R., Gilfanov M., 2007a, MNRAS, 380, 1685
Bagchi M., Lorimer D. R., Chennamangalam J., 2011, MNRAS, 418, 477 Voss R., Gilfanov M., 2007b, A&A, 468, 49
Bahramian A., Heinke C. O., Sivakoff G. R., Gladstone J. C., 2013, ApJ, 766, Xue X.-X., Rix H.-W., Ma Z., Morrison H., Bovy J., Sesar B., Janesh W.,
 136 2015, ApJ, 809, 144
Bartels R., Storm E., Weniger C., Calore F., 2018, Nature Astronomy, 2, 819 Yuan Q., Zhang B., 2014, Journal of High Energy Astrophysics, 3, 1
Bhattacharya D., van den Heuvel E. P. J., 1991, Phys. Rep., 203, 1
Bland-Hawthorn J., Gerhard O., 2016, ARA&A, 54, 529 This paper has been typeset from a TEX/LATEX file prepared by the author.
Bovy J., 2015, ApJS, 216, 29
Brandt T. D., Kocsis B., 2015, ApJ, 812, 15
Brandt N., Podsiadlowski P., 1995, MNRAS, 274, 461
Buschmann M., Rodd N. L., Safdi B. R., Chang L. J., Mishra-Sharma S.,
 Lisanti M., Macias O., 2020, Phys. Rev. D, 102, 023023
Camilo F., Rasio F. A., 2005, in Rasio F. A., Stairs I. H., eds, Astronomical
 Society of the Pacific Conference Series Vol. 328, Binary Radio Pulsars.
 p. 147 (arXiv:astro-ph/0501226)
Carlson E., Profumo S., 2014, Phys. Rev. D, 90, 023015
Cerdeño D. G., Peiró M., Robles S., 2015, Phys. Rev. D, 91, 123530
Cholis I., Hooper D., Linden T., 2015a, J. Cosmology Astropart. Phys., 2015,
 043
Cholis I., Evoli C., Calore F., Linden T., Weniger C., Hooper D., 2015b,
 J. Cosmology Astropart. Phys., 2015, 005
Daylan T., Finkbeiner D. P., Hooper D., Linden T., Portillo S. K. N., Rodd
 N. L., Slatyer T. R., 2016, Physics of the Dark Universe, 12, 1
Di Mauro M., 2021, Phys. Rev. D, 103, 063029

 MNRAS 000, 1–9 (0000)
You can also read