Micro computed tomography assessment of bone structure in aging mice
←
→
Page content transcription
If your browser does not render page correctly, please read the page content below
www.nature.com/scientificreports
OPEN Micro‑computed tomography
assessment of bone structure
in aging mice
Junbo Shim1,2, Chihiro Iwaya1,2, Catherine G. Ambrose3, Akiko Suzuki1,2 & Junichi Iwata1,2,4,5*
High-resolution computed tomography (CT) is widely used to assess bone structure under
physiological and pathological conditions. Although the analytic protocols and parameters for
micro-CT (μCT) analyses in mice are standardized for long bones, vertebrae, and the palms in
aging mice, they have not yet been established for craniofacial bones. In this study, we conducted
a morphometric assessment of craniofacial bones, in comparison with long bones, in aging mice.
Although age-related changes were observed in the microarchitecture of the femur, tibia, vertebra,
and basisphenoid bone, and were more pronounced in females than in males, the microarchitecture
of both the interparietal bone and body of the mandible, which develop by intramembranous
ossification, was less affected by age and sex. By contrast, the condyle of the mandible was more
affected by aging in males compared to females. Taken together, our results indicate that mouse
craniofacial bones are uniquely affected by age and sex.
The skeleton performs a variety of functions such as providing structural support, enabling movement, protect-
ing vital internal organs, and maintaining mineral homeostasis, acid–base balance, and h ematopoiesis1. There
are two major types of bone: cortical and trabecular bone. Cortical bone consists of lamellar units called osteons
and forms a solid osseous shell around the bone; the outer surface of cortical bone is covered by the periosteum,
whereas the inner surface is covered by the endosteum. Trabecular bone is composed of a network of lamellar
bone plates and rods and is deposited by diffusion from the surrounding bone marrow1.
Bone ossification starts at the embryo stage and continues until approximately age 25 years in humans2. Bone
ossification is achieved through intramembranous and endochondral ossification. Whereas intramembranous
ossification involves the direct conversion of the mesenchyme to bone and forms the flat bones of the skull, clavi-
cle, and most of the cranial bones, endochondral ossification involves a cartilage template that is later replaced
by bone and forms the long bones and cranial base2. Bones are continuously and actively remodeled throughout
life; therefore, bone morphology and matrix quality change during development and with aging.
Disruption of the homeostasis between bone formation by osteoblasts and bone resorption by osteoclasts
results in imbalanced bone remodeling. For instance, osteopenia, a condition of low bone mass or low bone
density, occurs when bone resorption exceeds bone formation, and its progression is influenced by diet, environ-
mental factors, hormonal changes, and aging. Individuals with osteopenia have a higher risk of suffering bone
fractures and developing osteoporosis, in which bone mineral density (BMD) measured by dual X-ray absorpti-
ometry, the gold standard for measuring age-related changes, is significantly reduced by more than two-fold3–5.
In osteoporotic bones, bone remodeling shifts toward bone resorption, resulting in increased net bone loss
with aging6. In addition, this bone loss depends on the amount of surface available for bone r emodeling7. There-
fore, bone loss in early osteoporosis is mainly a loss of trabecular bone due to the larger surface available for bone
remodeling8. However, cortical bone becomes more porous with aging, which leads to increased endocortical
surface. As a result, bone loss in late osteoporosis is mainly a loss of cortical bone7. Previous studies indicate that
cortical bone strength in the f emur9,10, as well as cortical thickness in various bones, decrease with a ging11,12.
In addition, trabecular bone loss has been observed in the femoral head and vertebrae with aging, along with
decreased trabecular bone volume and increased trabecular bone separation11,13,14.
1
Department of Diagnostic and Biomedical Sciences, School of Dentistry, The University of Texas Health Science
Center at Houston, 1941 East Road, BBS 4208, Houston, TX 77054, USA. 2Center for Craniofacial Research, School
of Dentistry, The University of Texas Health Science Center at Houston, Houston, TX 77054, USA. 3Department
of Orthopedic Surgery, McGovern Medical School, The University of Texas Health Science Center at Houston,
Houston, TX 77030, USA. 4Pediatric Research Center, McGovern Medical School, The University of Texas Health
Science Center at Houston, Houston, TX 77030, USA. 5MD Anderson UTHealth Graduate School of Biomedical
Sciences, Houston, TX 77030, USA. *email: Junichi.Iwata@uth.tmc.edu
Scientific Reports | (2022) 12:8117 | https://doi.org/10.1038/s41598-022-11965-4 1
Vol.:(0123456789)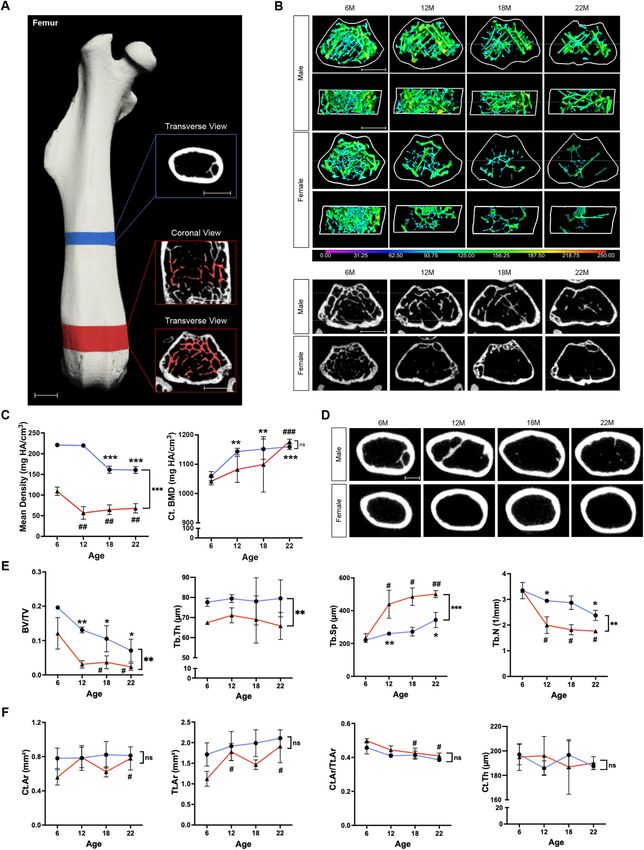
www.nature.com/scientificreports/

          Scientific Reports |   (2022) 12:8117 |   https://doi.org/10.1038/s41598-022-11965-4   2

Vol:.(1234567890)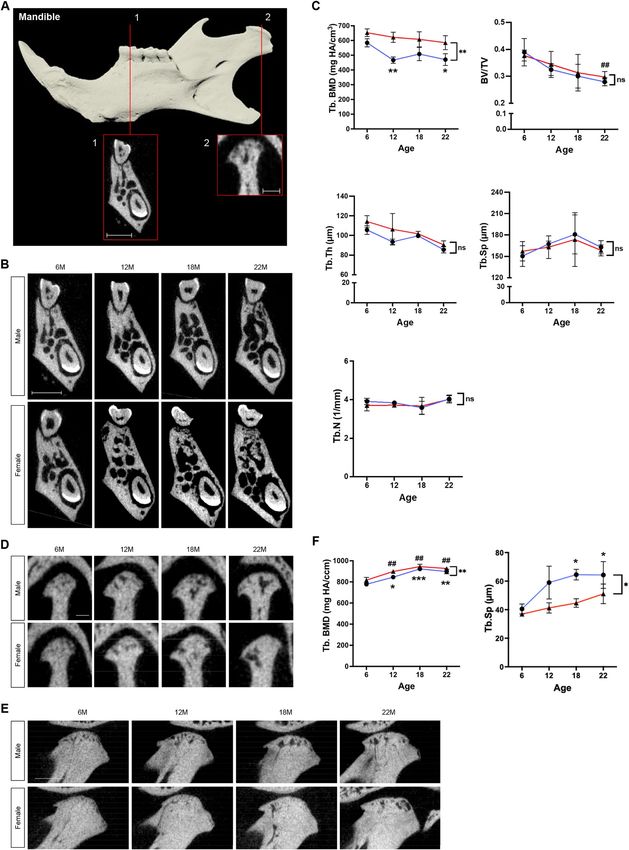
www.nature.com/scientificreports/
◂Figure 1. μCT imaging analysis of the femur. (A) Overview of VOI selection for the femur. VOI for cortical
bone at mid-diaphysis is shown in the blue panel, VOI for trabecular bone at distal metaphysis is shown in
the red panels. Scale bar, 1 mm. (B) Colored 3D reconstruction (top) and 2D cross-sectional images (bottom)
of trabecular bone in the femur of male and female mice at 6, 12, 18, and 22 months of age. Color bar shows
trabecular bone thickness from 0 to 250 µm. Scale bar, 1 mm. (C) Femoral trabecular bone mineral density
as Tb.BMD in mg HA/cm3 and cortical bone mineral density as Ct.TMD in mg HA/cm3 for male (blue lines)
and female (red lines) mice at 6, 12, 18, 22 months of age. (D) Original transverse cross-sectional images of
cortical bone in the femur of male and female mice at 6, 12, 18, and 22 months of age. Scale bar, 1 mm. (E)
Quantification of morphometric parameters of the femoral trabecular bone of males (blue lines) and females
(red lines): trabecular bone volume fraction (BV/TV), trabecular number (Tb.N, 1/mm), trabecular thickness
(Tb,Th, µm), and trabecular separation (Tb.Sp, µm). (F) Quantification of morphometric parameters of femoral
cortical bone of males (blue lines) and females (red lines). Cortical area (Ct.Ar, m m2), total area (Tt.Ar, mm2),
cortical area fraction (Ct.Ar/Tt.Ar), and cortical thickness (Ct.Th, µm). n = 3 per group. *p < 0.05, **p < 0.01,
***p < 0.001 for males; #p < 0.05, ##p < 0.01, ###p < 0.001 for females; ns, not significant.
Primary osteoporosis is associated with menopause in women (type I) and normal aging (type II), whereas
secondary osteoporosis is caused by certain medical conditions such as inflammatory disease, type II diabetes,
and cancer, and risk factors including corticosteroid medication and high alcohol consumption15–17. Type I
postmenopausal osteoporosis is characterized by high bone turnover with increased osteoblastic and osteoclastic
activities and rapid trabecular bone loss (3–8 times higher)18,19 and develops between 50 and 70 years of age.
In type II senile osteoporosis, there is low bone turnover, with reduction of both osteoblastic and osteoclastic
activities, and gradual loss of trabecular and cortical bone (two-fold higher in women)6,20.
Although both estrogen and androgen inhibit bone resorption and enhance bone formation, estrogen plays a
more dominant role in the inhibition of bone resorption21. This is evident in women with estrogen deficiency due
to menopause, which is associated with rapid trabecular bone loss6. The prevalence of osteoporosis is, therefore,
higher in postmenopausal women than in older men. The National Osteoporosis Foundation has estimated that
9.1 million women are affected by osteoporosis, while only 2.8 million men develop the disease. Nonetheless,
older men still suffer poor health outcomes resulting from osteoporosis.
Long bones and the vertebrae have been rigorously studied in both human and mice, as they are common
sites of fracture due to aging and osteopenia/osteoporosis. By contrast, traumatic injuries and fractures in crani-
ofacial bones are most commonly caused by falls and motor vehicle a ccidents22,23. Although recent efforts have
been made to quantify the bone morphometry of the skull (e.g. cortical thickness, density, and porosity), the
trabecular morphometry of the diploe has not been studied in d etail24–26.
Micro-computed tomography (μCT) allows for the visualization of three-dimensional (3D) structures and
is widely used to evaluate bone quality and morphology in small animals, under physiological and pathologi-
cal conditions. μCT analyses are useful for evaluating the fine structure of bone/cartilage mineral components,
particularly in the field of bone and cartilage r esearch27–30. Qualifiable and quantifiable analyses of long bones
and vertebrae, with a set of standardized parameters, are well established in the field; by contrast, a standardized
protocol for craniofacial bones has not been yet defined. While some craniofacial bones are formed through
endochondral ossification (e.g. the mandibular condyle and cranial b ase31,32), most are formed through intram-
embranous ossification. A few μCT studies have been conducted in young mice33, but a rigorous methodology
for evaluating aging craniofacial bones has not been tested and validated. This study thus aims to evaluate the
changes that occur in the structural properties of craniofacial bones in aging mice through μCT imaging analyses.
Materials and methods
Animals. Male and female C57BL/6J mice were purchased from The Jackson Laboratory at 26 weeks
(6 months), 56 weeks (12 months), 72 weeks (18 months), and 90 weeks (22 months) of age (n = 3 per group),
and housed with a 12-h light/12-h dark cycle and fed a normal mouse diet ad libitum until μCT scanning. Mice
were euthanized through carbon dioxide overdose followed by cervical dislocation at the time points indicated
above. The femur, tibia, vertebrae, and the skull were dissected and fixed with 4% paraformaldehyde (PFA) over-
night, and then stored in phosphate-buffered saline (PBS) for subsequent scanning. The surrounding connective
tissues and muscles were removed before the scan. The protocol was approved by the Animal Welfare Committee
(AWC) and the Institutional Animal Care and Use Committee (IACUC) of UTHealth (AWC 19-0079). All mice
were maintained at the animal facility of UTHealth, and all animal experiments were conducted according to the
Animal Research: Reporting of in vivo experiments (ARRIVE) guidelines on ethical conduct in animal research.
μCT scanning and 3D reconstruction. Samples were placed in a foam mold for stability during the μCT
scans, which were performed at 15 µm resolution for the head, third lumbar vertebra, tibia, and femur using a
SCANCO vivaCT-40 system (SCANCO Medical AG, Fabrikweg, Switzerland; 70 peak kilovoltage and 145-µA
X-ray source). Air was used as the scan medium to provide the highest contrast between the sample and the
background. 3D reconstruction and analysis of the μCT images were performed with the Dragonfly software
[Version 2021.1 for Windows; Object Research Systems (ORS) Inc., Montreal, Canada] with DICOM files.
Determination of volume of interest. The difference in bone size according to age was taken into con-
sideration when determining the volume of interest (VOI) for all bones. For the femur, trabecular bone meas-
urements were taken 0.5 mm proximally from the distal epiphyseal growth plate, with 1 mm in height, and
cortical bone parameters were measured at mid-diaphysis (which was located by taking the midpoint between
Scientific Reports | (2022) 12:8117 | https://doi.org/10.1038/s41598-022-11965-4 3
Vol.:(0123456789)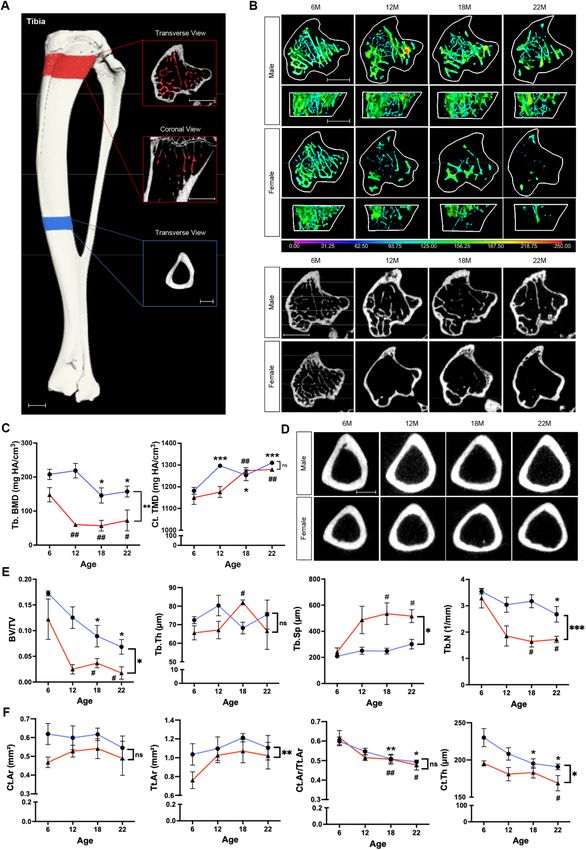
www.nature.com/scientificreports/

          Scientific Reports |   (2022) 12:8117 |   https://doi.org/10.1038/s41598-022-11965-4   4

Vol:.(1234567890)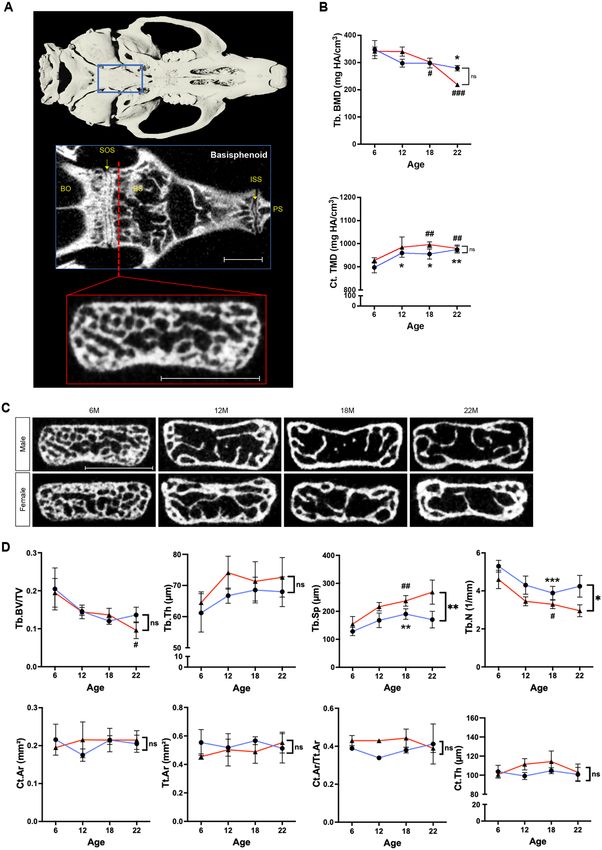
www.nature.com/scientificreports/
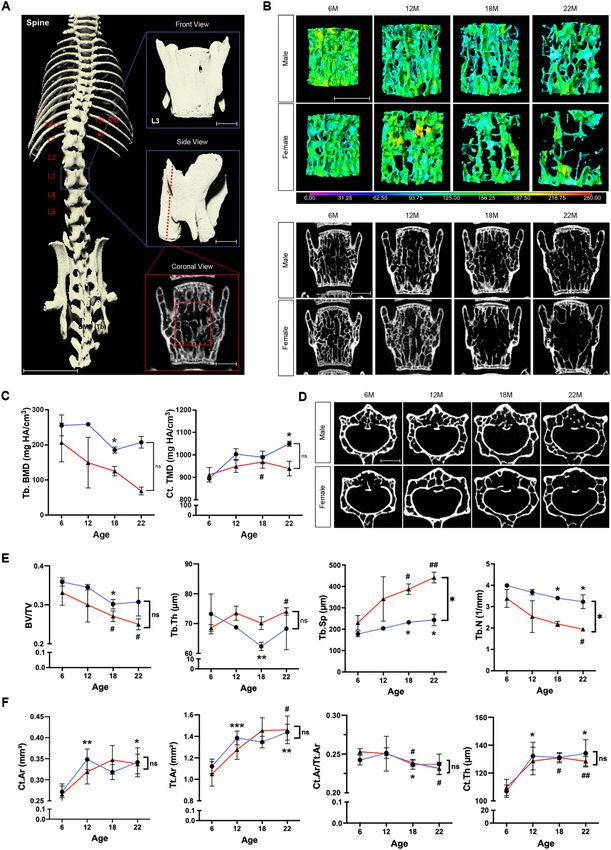
◂Figure 2. μCT imaging analysis of the tibia. (A) Overview of VOI selection for the tibia. VOI for cortical bone
at mid-diaphysis is shown in the blue panel, VOI for trabecular bone at proximal metaphysis is shown in the
red panels. Scale bar, 1 mm. (B) Colored 3D reconstruction (top) and 2D cross-sectional images (bottom)
of trabecular bone in the tibia of male and female mice at 6, 12, 18, and 22 months of age. Color bar shows
trabecular bone thickness from 0 to 250 µm. Scale bar, 1 mm. (C) Tibial trabecular bone mineral density as
Tb.BMD in mg HA/cm3 and cortical bone mineral density as Ct.TMD in mg HA/cm3 for male (blue lines) and
female (red lines) mice at 6, 12, 18, 22 months of age. (D) Original transverse cross-sectional images of cortical
bone in the tibia of male and female mice at 6, 12, 18, and 22 months of age. Scale bar, 1 mm. (E) Quantification
of morphometric parameters of tibial trabecular bone of males (blue lines) and females (red lines). Trabecular
bone volume fraction (BV/TV), trabecular number (Tb.N, 1/mm), trabecular thickness (Tb,Th, µm), and
trabecular separation (Tb.Sp, µm). (F) Quantification of morphometric parameters of tibial cortical bone of
males (blue lines) and females (red lines). Cortical area (Ct.Ar, m m2), total area (Tt.Ar, mm2), cortical area
fraction (Ct.Ar/Tt.Ar), and cortical thickness (Ct.Th, µm). n = 3 per group. *p < 0.05, **p < 0.01, ***p < 0.001 for
males; #p < 0.05, ##p < 0.01, ###p < 0.001 for females; ns, not significant.
the greater trochanter and intercondylar notch), extending to a length of 0.5 mm. For the tibia, trabecular bone
measurements were taken 0.5 mm distally from the tibial metaphysis, with 1 mm in height, and cortical bone
parameters were measured at the midpoint between the distal and proximal growth plates, extending to a length
of 0.5 mm. For the vertebrae, the VOI for the body of the third lumbar vertebrae (L3) was determined relative
to the height of the vertebra; measurements were taken from a VOI of 50% in height and 45% in width from the
center of the body, and cortical thickness was calculated from the ventral vertebral cortex.
For craniofacial bones, several candidate bones were selected based on the clinical relevance and clear/ rich
trabecular architecture. For the basisphenoid bone, VOI was taken from 200 µm anteriorly to the spheno-occipital
synchondrosis (SOS), with 1 mm in width and 500 µm in length. For the interparietal bones, VOI was taken
from the largest cross-sectional area, with 1.5 mm in width and 1 mm in length. For the mandibular trabecular
bone, VOI was located at the first molar (M1) bifurcation, extending 30 slices between the M1 proximal and
distal roots; trabecular bone below the M1 roots was outlined excluding the molars, lower incisors, and the
mandibular cortical bone. For the mandibular condyle, the most anterior and posterior points of the mandibular
condyle were located, and the VOI of the condyle was selected above the artificial line drawn from the anterior
to the posterior points.
Imaging analysis. The Otsu’s thresholding method was used to segment bone from non-bone. The Bone
Analysis module in Dragonfly was used to segment cortical and trabecular b one34,35 and to compute bone mor-
phometric measurements, following the guidelines described by Bouxsein et al.28. Using the Bone Analysis mod-
ule, trabecular bone volume fraction (BV/TV), trabecular thickness (Tb.Th, µm), and trabecular separation (Tb.
Sp, µm) were determined for trabecular bone; trabecular number (Tb.N, 1/ mm) was calculated based on 3D
measurements for the spacing of trabeculae36,37 using the following formula:
1
Tb.N =
(Tb.Th + Tb.Sp)
Cortical area (Ct.Ar, µm2), total area (Tt.Ar, µm2), cortical area fraction (Ct.Ar/Tt.Ar, %), and cortical thick-
ness (Ct.Th, µm) were determined for cortical bone.
Mineral density measurements. Mineral density measurements were captured with the Scanco software.
Calibration was performed weekly, using a bone calibration phantom with one of five densities of hydroxyapatite
(HA; 0, 100, 200, 400, 800 mg HA/cm3). For trabecular bone, density was reported as BMD in mg HA/cm3; for
cortical bone, density was reported as tissue mineral density (TMD) in mg HA/cm3. Following segmentation, the
following settings were applied to all mineral density measurements: Gauss Sigma = 1, Gauss Support = 0, Lower
Threshold = 210, and Upper Threshold = 1000 (Threshold ranging from 0 to 1000).
Statistical analysis. All experimental data were analyzed with the Prism software (GraphPad Software,
California, USA). One-way or two-way analysis of variance (ANOVA) with Bonferroni correction was used for
the analyses (n = 3). A p-value < 0.05 was considered statistically significant. For all graphs, data are represented
as mean ± standard deviation (SD).
Results
Aged‑related changes in the femur, tibia, and vertebrae. In an effort to compare our methodology
with that used in previous studies, we evaluated the structure of the femur, tibia, and vertebra. Previous studies
have shown that age-related changes in these bones lead to a decrease in trabecular bone volume fraction and an
increase in trabecular s eparation38,39. To evaluate the age-related changes in the femur, we analyzed trabecular
bone (Fig. 1A) and found that femoral BV/TV in male and female mice decreased by 63.8% (p < 0.05) and 80.8%
(p < 0.05), respectively, from 6 to 22 months of age. In addition, there was a significant difference in BV/TV
between the sexes over time (p < 0.01). In correlation with a decreased BV/TV, there was a significant increase
in Tb.Sp—88.3% (p < 0.05) in females and 17.7% (p < 0.01) in males—and a significant decrease in Tb.N—40.3%
(p < 0.05) in females and 12.1% (p < 0.05) in males—from 6 to 12 months of age. Tb.BMD decreased by 27.4%
(p < 0.001) in males, and by 41% (p < 0.001) in females, from 6 to 22 months. By contrast, femoral Tb.Th did not
Scientific Reports | (2022) 12:8117 | https://doi.org/10.1038/s41598-022-11965-4 5
Vol.:(0123456789)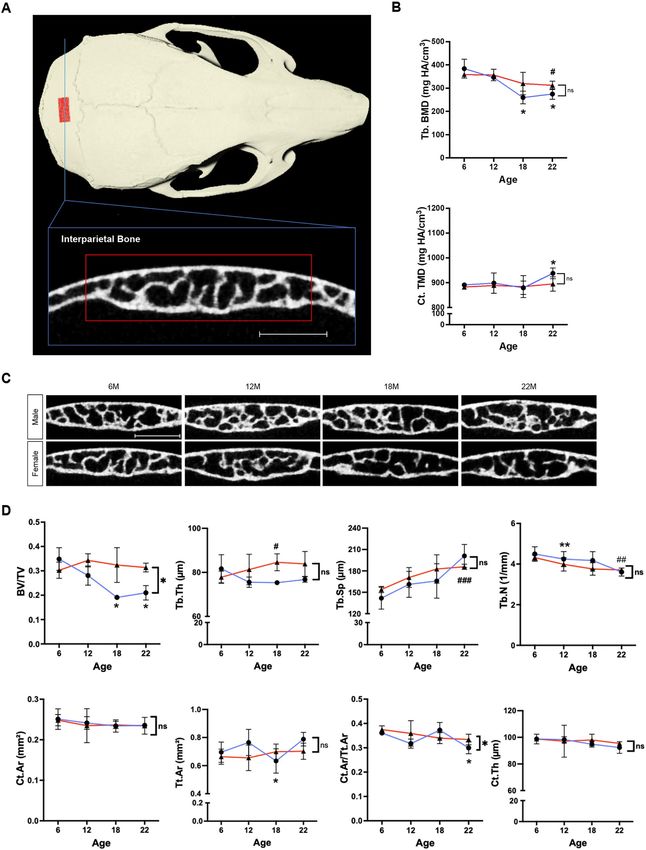
www.nature.com/scientificreports/

          Scientific Reports |   (2022) 12:8117 |   https://doi.org/10.1038/s41598-022-11965-4   6

Vol:.(1234567890)
www.nature.com/scientificreports/
◂Figure 3. μCT imaging analysis of the third lumbar vertebra. (A) Overview of VOI selection for the third
lumber vertebra (L3). Scale bar for the spine, 1 cm. Scale bar for L3, 1 mm. Th13: 13th thoracic vertebra. (B)
Colored 3D reconstruction (top) and 2D cross-sectional images (bottom) of trabecular bone in the L3 vertebrae
of male and female mice at 6, 12, 18, and 22 months of age. Color bar shows trabecular bone thickness from
0 µm to 250 µm. Scale bar, 1 mm. (C) Vertebral trabecular bone mineral density as Tb.BMD in mg HA/cm3
and cortical bone mineral density as Ct.TMD in mg HA/cm3 for male (blue lines) and female (red lines) mice
at 6, 12, 18, 22 months of age. (D) Original transverse cross-sectional images of cortical bone in L3 of male and
female mice at 6, 12, 18, and 22 months of age. Scale bar, 1 mm. (E) Quantification of morphometric parameters
of L3 vertebral trabecular bone of males (blue lines) and females (red lines). Trabecular bone volume fraction
(BV/TV), trabecular number (Tb.N, 1/mm), trabecular thickness (Tb,Th, µm), and trabecular separation (Tb.
Sp, µm). (F) Quantification of morphometric parameters of L3 vertebral cortical bone of males (blue lines) and
females (red lines). Cortical area (Ct.Ar, mm2), total area (Tt.Ar, mm2), cortical area fraction (Ct.Ar/Tt.Ar), and
cortical thickness (Ct.Th, µm). n = 3 per group. *p < 0.05, **p < 0.01, ***p < 0.001 for males; #p < 0.05, ##p < 0.01,
###
p < 0.001 for females; ns, not significant.
significantly change throughout life in both males and females. As expected, sex differences were observed for
Tb.Th, Tb.Sp, Tb.N, and Tb.BMD (Fig. 1B,C,E).
Femoral Ct.Ar did not change from 6 to 22 months of age in both male and female mice, while there was
a gradual increase in Tt.Ar in both sexes. In correlation with increased Tt.Ar, there was a slight reduction in
Ct.Ar/Tt.Ar in females (17.8%; p < 0.05) over time. Ct.TMD increased by 9.6% (p < 0.001) in males and by 11.8%
(p < 0.001) in females. Ct.Th did not change significantly throughout life (Fig. 1C,D,F).
We found that trabecular bone morphometrics of the tibia (Fig. 2A) followed similar patterns with aging:
BV/TV decreased by 60.4% (p < 0.05) in males and by 85.6% (p < 0.05) in females; Tb.N decreased by 24.6%
(p < 0.05) in males and by 47.6% (p < 0.05) in females; Tb.Sp increased by 43.9% (p < 0.05) in males and by 114.0%
(p < 0.05) in females; and Tb.BMD decreased by 24.3% (p < 0.05) in males and by 51% (p < 0.05) in females over
time. In female mice, substantial changes in these measurements were observed from 6 to 12 months of age. Sex
differences were observed for Tb.Th, Tb.Sp, Tb.N, and Tb.BMD (Fig. 2B,C,E).
Cortical bone parameters for the tibia showed patterns similar to those seen in the femur, with slight reduction
in Ct.Ar/Tt.Ar in both males (17.6%; p < 0.05) and females (22.7%; p < 0.05) over time. Tibial Ct.Th significantly
decreased throughout life in both male (17.1%; p < 0.05) and female mice (13.6%; p < 0.05). Ct.TMD increased
by 10.9% (p < 0.001) in males and by 11.2% (p < 0.001) in females over time. There was a difference between the
sexes for Tt.Ar and Ct.Th, but not for Ct.Ar, CtAr/Tt.Ar and Ct.TMD (Fig. 2C,D,F).
In the vertebrae, a VOI (relative to the height of the vertebra) of 50% in height and 45% in width from the
center of the vertebral body of L3 was analyzed for trabecular bone measurements. In addition, the ventral verte-
bral cortex was analyzed for cortical thickness (Fig. 3A). The trabecular bone morphometrics of the spine showed
aging patterns that were similar to those seen in the femur and tibia: BV/TV decreased by 41.1% (p < 0.05) in
females; Tb.N decreased by 19.1% (p < 0.05) in males and by 42.5% (p < 0.05) in females; Tb.Sp increased by 37.2%
(p < 0.05) in males and by 91.8% (p < 0.01) in females; and Tb.TMD decreased by 66.9% (p < 0.05) in females over
the animals’ lifespan. There was no significant change in Tb.Th with aging, but there was a difference between
the sexes in Tb.Sp and Tb.N, although not in BV/TV, Tb.Th, and Tb.BMD (Fig. 3B,C,E).
Interestingly, the spine cortical morphometrics were different from those of the femur and tibia. Ct.Ar
increased by 25.9% (p < 0.05) in males, Tt.Ar increased by 28.4% (p < 0.01) in males and by 39.2% (p < 0.05) in
females, Ct.Ar/Tt.Ar decreased by 8.5% (p < 0.05) in females, Ct.Th increased by 25.5% (p < 0.05) in males and
by 17.3% (p < 0.01) in females, and Ct.TMD increased by 17.4% (p < 0.05) in males over time. There was no dif-
ference in Ct.Ar, Tt.Ar, Ct.Ar/Tt.Ar, Ct.Th, and Ct.TMD between the sexes (Fig. 3C,D,F).
Our observations of age-related changes in the trabecular bone of the femur, tibia, and lumbar vertebra were
consistent with previous findings, showing an increase in trabecular separation and decrease in trabecular BV/
TV with aging in both male and female mice. For femoral and tibial Tb.Th measurements, there was an initial
increase and a subsequent decrease as mice approached the end of their lives. Femoral and tibial cortical thickness
decreased slightly, whereas vertebral cortical thickness increased slightly with aging, a similar pattern observed
by Glatt et al.39 and Halloran et al.40. Cortical and trabecular measurements for female mice showed a higher
degree and faster rate of bone loss compared to male mice.
Age‑related changes in craniofacial bones. The basisphenoid bone at the cranial base is formed
through endochondral o ssification41,42, which is similar to that occurring in the long bones (Fig. 4A). From 6 to
22 months of age, BV/TV decreased by 50.6% (p < 0.05) in females, and Tb.BMD decreased by 19.7% (p < 0.05)
in males and by 35.9% (p < 0.001) in females; however, other differences in trabecular morphometrics were not
significant for both male and female mice. There was a difference in Tb.Sp and Tb.N between the sexes, but not
in BV/TV, Tb.Th, and Tb.BMD. In cortical bone, Ct.TMD increased by 8.6% (p < 0.01) in males and by 5.6%
(p < 0.01) in females over time. No significant changes were observed in cortical bone morphometrics for both
male and female mice (Fig. 4B,C,D). Taken together, although the mode of ossification is similar, the basisphe-
noid bone was less affected by aging compared to the long bones.
To investigate the age-related changes in craniofacial bones formed through intramembranous ossification,
we analyzed the interparietal bone (Fig. 5A). From 6 to 22 months of age, BV/TV decreased by 39.7% (p < 0.05)
in males, Tb.Sp increased by 20.7% (p < 0.001) in females, Tb.N decreased by 14.1% (p < 0.01) in females, and
Tb.BMD decreased by 28.4% (p < 0.05) in males and by 12.9% (p < 0.05) in females. For the interparietal cortical
bone, Ct.Ar/Tt.Ar decreased by 17.0% (p < 0.05) in males, and Ct.TMD increased by 5.3% (p < 0.05) in males
Scientific Reports | (2022) 12:8117 | https://doi.org/10.1038/s41598-022-11965-4 7
Vol.:(0123456789)www.nature.com/scientificreports/
Scientific Reports | (2022) 12:8117 | https://doi.org/10.1038/s41598-022-11965-4 8
Vol:.(1234567890)www.nature.com/scientificreports/
◂Figure 4. μCT imaging analysis of the basisphenoid bone. (A) 3D reconstruction of the skull and overview
of VOI selection for the basisphenoid bone (red panel). Scale bar, 1 mm. BO, basioccipital; BS, basisphenoid;
ISS, intersphenoid synchondrosis; PS, presphenoid; SOS, spheno-occipital synchondrosis. (B) Basisphenoid
trabecular bone mineral density as Tb.BMD in mg HA/cm3 and cortical bone mineral density as Ct.TMD in mg
HA/cm3 for male (blue lines) and female (red lines) mice at 6, 12, 18, 22 months of age. (C) Original coronal
cross-sectional images of the basisphenoid bone of male and female mice at 6, 12, 18, and 22 months of age.
Scale bar, 1 mm. (D) Quantification of morphometric parameters of the basisphenoid bone of males (blue
lines) and females (red lines). Trabecular bone volume fraction (BV/TV), trabecular number (Tb.N, 1/mm),
trabecular thickness (Tb,Th, µm), trabecular separation (Tb.Sp, µm), cortical area (Ct.Ar, m m2), total area (Tt.
Ar, mm2), cortical area fraction (Ct.Ar/Tt.Ar), and cortical thickness (Ct.Th, µm). n = 3 per group. *p < 0.05,
**p < 0.01, ***p < 0.001 for males; #p < 0.05, ##p < 0.01, ###p < 0.001 for females; ns, not significant.
over time (Fig. 5B–D). These findings indicate that the changes in the interparietal bone were less pronounced
for each measurement compared to those of the long bones.
Finally, we analyzed the mandible, which is uniquely formed through both endochondral and intramembra-
nous ossification43. To investigate the age-related effects on each type of ossification in the mandible, two separate
regions were selected for analysis (Fig. 6A). First, the mandibular trabecular bone below the M1 bifurcation,
which is formed by intramembranous ossification, was measured. From 6 to 22 months of age, BV/TV decreased
by 21.0% (p < 0.01) in females, Tb.Th decreased by 19.1% (p < 0.05) in males and by 20.9% (p < 0.05) in females,
and Tb.BMD decreased by 19.5% (p < 0.05) in males. There was no significant difference in other trabecular
measurements in male and female mice (Fig. 6B,C). Next, the mandibular condyle, which forms by endochon-
dral ossification, was measured. From 6 to 22 months of age, Tb.Sp increased by 58.8% (p < 0.05) in males, and
Tb.BMD increased by 15.5% (p < 0.01) and by 13.4% (p < 0.01) in females. Interestingly, a greater change (Tb.
Sp, p < 0.05; Tb.TMD, p < 0.01) was observed for male mice compared with female mice (Fig. 6D–F). A differ-
ence between the sexes was observed in the Tb.BMD of both the mandibular condyle and the mandibular body.
Our results from the μCT analyses were validated with histological staining (Fig. S1), which showed that
the thickness and length of trabecular bones in the femur, tibiae, and vertebrae were decreased with aging in
both male and female mice. Previous studies showed that the bone marrow in the femur and tibiae changes to
yellow marrow, which is composed of adipocytes, with aging more drastically in female m ice44,45. In agreement
with these findings, the femoral and tibial bone marrow changed to yellow marrow in the femurs of female mice
older than 18 months and in the tibia of female mice older than 12 months, whereas in male mice it remained
as red marrow in these bones until the age of 22 months. In addition, as seen in the μCT images, there was
increased invasion of blood vessels into the subchondral bone of the mandibular condyles, while the thickness
of fibrocartilage on the condylar surface was intact. Thus, the change seen in the mandibular condyle differed
from that observed in other bones.
Discussion
Mice have been widely used in research on aging because of their small size and short lifespan, as well as
conserved morphological changes and mechanisms compared to humans. Previous studies showed that
C57BL/6J mice have an average lifespan of approximately 2 years46,47 and share features with humans, such as
decline in ovarian follicles, irregular cycling and steroid hormone fluctuations, and irregular fertility48–50. In male
and female mice (C57BL/6J, BALB/c, and C3H/He strains), the trabecular bone volume in long bones starts to
decrease after approximately 6 months of age, with a greater reduction observed in f emales38,39. Furthermore,
there is an increase in Tb.Sp and a decrease in Ct.Th with a ging38–40, which are similar to the trends of bone loss
seen in humans. One difference observed between humans and mice was the change in trabecular thickness,
which decreases in humans with aging whereas it increases in m ice39,40.
Reproductive hormones are a known factor for aging- and menopause-related bone l oss51,52. In postmenopau-
sal women, serum estradiol (E2) is drastically reduced while follicle-stimulating hormone (FSH) is i ncreased53–55.
Estrogen signaling is transduced by nuclear receptors ERα or ERβ. ERα signaling induces cell proliferation and
differentiation of pre-osteoblasts in the cortical periosteum, which is required for cortical bone accrual and
against bone resorption, although ERα signaling is not involved in the regulation of trabecular bone mass in
mature osteoblasts and o steocytes56,57. By contrast, ERβ signaling represses bone formation in cortical bone,
but not in trabecular bone58. Both ERα and ERβ signaling prevent cellular senescence in osteocytes due to p53
stabilization59. In osteoclasts, ERα signaling induces apoptosis, which prevents bone resorption in trabecular
bones, but not in cortical bones60,61. Taken together, the balance between ERα and ERβ signaling may play a
critical role in the regulation of bone growth and remodeling. Moreover, a deficit of estrogen affects bone for-
mation and homeostasis; estrogen deficiency alters osteoblast d ifferentiation62 and also dysregulates osteoclast
differentiation63–65.
FSH levels are another factor related to menopausal and postmenopausal bone loss though osteoclast
activation66–68. In an osteoarthritis mouse model, treatment with FSH accelerates inflammatory cytokine pro-
duction and stimulates osteoclastogenesis, while treatment with E2 shows opposite effects69. Osteoporosis is also
induced during androgen deprivation therapy in prostate cancers, as well with aging, in m en70,71. Treatments
with dihydrotestosterone and/or E2 improves suppressed cell viability due to oxidative stress in pre-osteoblasts,
but not in mature osteoblasts72. In addition, androgen plays a role in the maintenance of trabecular bone mass
through proliferation and mineralization of osteoblasts, but not of osteoclasts57,73. Based on the mouse life span,
3–6 months of age is referred as “matured adult”, 10–15 months of age is “middle-aged”, and 18–24 months of age
is “old” (https://www.jax.org/research-and-faculty/research-labs/the-harrison-lab/gerontology/life-span-as-a-
biomarker). In mice, the level of plasma testosterone is drastically reduced after 450 days (16 months) of age in
Scientific Reports | (2022) 12:8117 | https://doi.org/10.1038/s41598-022-11965-4 9
Vol.:(0123456789)www.nature.com/scientificreports/
Figure 5. μCT imaging analysis of the interparietal bone. (A) 3D reconstruction of the skull and overview of VOI selection for the
interparietal bone (red panel). Scale bar, 1 mm. (B) Interparietal trabecular bone mineral density as Tb.BMD in mg HA/cm3 and
cortical bone mineral density as Ct.TMD in mg HA/cm3 for male (blue lines) and female (red lines) mice at 6, 12, 18, 22 months of
age. (C) Original coronal cross-sectional images of the interparietal bone of male and female mice at 6, 12, 18, and 22 months of age.
Scale bar, 1 mm. (D) Quantification of morphometric parameters of the interparietal bone of males (blue lines) and females (red lines).
Trabecular bone volume fraction (BV/TV), trabecular number (Tb.N, 1/mm), trabecular thickness (Tb,Th, µm), trabecular separation
(Tb.Sp, µm), cortical area (Ct.Ar, mm2), total area (Tt.Ar, m m2), cortical area fraction (Ct.Ar/Tt.Ar), and cortical thickness (Ct.Th,
µm). n = 3 per group. *p < 0.05, **p < 0.01, ***p < 0.001 for males; #p < 0.05, ##p < 0.01, ###p < 0.001 for females; ns, not significant.
Scientific Reports | (2022) 12:8117 | https://doi.org/10.1038/s41598-022-11965-4 10
Vol:.(1234567890)www.nature.com/scientificreports/
males74. The level of serum luteinizing hormone (LH)75, neurons producing gonadotropin-releasing hormone
(GnRH)76, and the amount of progesterone in the h ypothalamus77 are significantly decreased in aged female
C57BL/6J mice. In agreement with these findings, our results show that the quality and quantity of bones are
altered at the middle-age, which is correlated with these hormonal changes.
Our findings indicate that the age-related changes in cortical and trabecular bone of the calvaria are less
pronounced compared to those of long bones. One of the possible reasons for this observation is the different
ossification mechanism involved in bone development: intramembranous ossification in craniofacial bones
versus endochondral ossification in almost all bones in the trunk. Previous studies suggest that differences in the
mode of ossification may lead to differences in cell proliferation, osteogenic differentiation, and in the lifespan of
bone marrow stem cells78, as well as differences in the composition of the bone matrix79,80. Interestingly, calvarial
trabecular bones show a higher bone turnover rate, with larger-size osteoclasts, compared with long bones and
the mandible. By contrast, under E2 depletion conditions, bone turnover is upregulated in the calvaria and long
bones, but not in the mandible81. Another possibility is the different mechanical forces and remodeling rate in
craniofacial bones compared to long bones. It is well known that bone formation and resorption are strongly
affected by mechanical forces82–85, and mechanical loading stress is converted to a series of biochemical reactions,
which then activate osteoclasts and osteoblasts to promote bone remodeling86. Previous studies have revealed
that lack of weight-bearing due to either prolonged spaceflight or bedrest leads to decreased bone mass87,88, while
mechanical loading of the skeleton through various types of exercise results in increased bone mass89,90. Although
there is no definitive study comparing mechanical forces between bones, the bones in the trunk would be more
affected by body weight and gravity while the condyle in the temporomandibular joint would be more affected by
occlusion. The mandibular and maxillary alveolar bone undergoes dramatic changes, which are accompanied by
tooth loss. However, many risk factors contribute to the severity of alveolar bone loss with aging, such as hormone
levels and individual dental health91,92. Periodontitis leads to significant loss of the alveolar bone and tends to
be more severe in elderly women. However, laboratory mice are housed in sterile conditions, hence they are not
affected by periodontitis. Therefore, the changes in the trabecular and cortical bone measurements observed for
the mandibular alveolar bone reflect the effect of age and sex without the contribution of periodontitis.
When interpreting the measurements for mineral density, it is important to be aware of some of the limita-
tions of μCT in terms of accuracy in bone and tissue mineral density. For instance, although μCT is a rapid and
nondestructive method to evaluate bone mineralization compared to traditional methods such as microradiog-
raphy, it is vulnerable to artifacts potentially due to scan parameters, beam hardening, partial-volume effects,
photon starvation, photon scatter, and inappropriate sampling28,93,94. With that in mind, the mineral density
measurements reported for trabecular bone were measured in BMD, which is calculated from average attenu-
ation values of bone tissue and non-bone tissue from a VOI, whereas mineral density measurements reported
for cortical bone were measured in TMD, which is calculated from bone tissue only. Trabecular BMD measure-
ments correspond well with the trabecular morphometrics (i.e. bone volume and total volume ratio, trabecular
separation and trabecular number); as the microarchitecture of trabecular bone deteriorates with aging, there is
a gradual bone loss, which leads to a decrease in trabecular BMD values. One trabecular BMD measurement that
did not follow this trend was the condylar trabecular BMD. Although there is an increase in trabecular spacing
with aging, the total volume selected for analysis was significantly larger, which may have minimized the effect
of non-bone tissue mineral density on the BMD measurement. Cortical TMD increases with aging, similar to
what has been reported for previous studies95,96.
In summary, our measurements of age-related changes in trabecular and cortical bone of the femur, tibia, and
vertebrae determined by μCT were consistent with previous findings. In this study, we found that craniofacial
bones were differently and uniquely affected by age and sex.
Scientific Reports | (2022) 12:8117 | https://doi.org/10.1038/s41598-022-11965-4 11
Vol.:(0123456789)www.nature.com/scientificreports/
Scientific Reports | (2022) 12:8117 | https://doi.org/10.1038/s41598-022-11965-4 12
Vol:.(1234567890)www.nature.com/scientificreports/
◂Figure 6. μCT imaging analysis for the mandible. (A) 3D reconstruction of the mandible (top) and overview
of VOI selection for trabecular bone at M1 bifurcation (1) and the mandibular condyle (2). Scale bar 1 mm
and 0.5 mm, respectively. (B) Original coronal cross-sectional images of mandibular trabecular bone at M1
bifurcation of male and female mice at 6, 12, 18, and 22 months of age. Scale bar, 1 mm. (C) Mandibular
trabecular bone mineral density as Tb.BMD in mg HA/cm3 for male (blue lines) and female (red lines) mice at
6, 12, 18, 22 months of age. Quantification of morphometric parameters of mandibular trabecular bone of males
(blue lines) and females (red lines). Trabecular bone volume fraction (BV/TV), trabecular thickness (Tb,Th,
µm), trabecular space (Tb.Sp, μm), and trabecular number (Tb.N, 1/mm). (D) Original coronal cross-sectional
images of mandibular condyle of male and female mice at 6, 12, 18, and 22 months of age. Scale bar, 0.5 mm.
(E) Original sagittal cross-sectional images of mandibular condyle of male and female mice at 6, 12, 18, and
22 months of age. Scale bar, 0.5 mm. (F) Condylar trabecular bone mineral density as Tb.BMD in mg HA/cm3
for male (blue lines) and female (red lines) mice at 6, 12, 18, 22 months of age. Quantification of morphometric
parameters of the mandibular condyle of males (blue lines) and females (red lines). Trabecular separation (Tb.
Sp, µm). n = 3 per group. *p < 0.05, **p < 0.01, ***p < 0.001 for males; #p < 0.05, ##p < 0.01, ###p < 0.001 for females;
ns, not significant.
Received: 3 November 2021; Accepted: 20 April 2022
References
1. Clarke, B. Normal bone anatomy and physiology. Clin. J. Am. Soc. Nephrol. 3(Suppl 3), S131-139. https://doi.org/10.2215/CJN.
04151206 (2008).
2. Breeland, G., Sinkler, M. A. & Menezes, R. G. in StatPearls (2021).
3. Karaguzel, G. & Holick, M. F. Diagnosis and treatment of osteopenia. Rev. Endocr. Metab. Disord. 11, 237–251. https://doi.org/10.
1007/s11154-010-9154-0 (2010).
4. Yang, S. et al. Comparison of femoral strength and fracture risk index derived from DXA-based finite element analysis for stratify-
ing hip fracture risk: A cross-sectional study. Bone 110, 386–391. https://doi.org/10.1016/j.bone.2018.03.005 (2018).
5. Dimai, H. P. Use of dual-energy X-ray absorptiometry (DXA) for diagnosis and fracture risk assessment; WHO-criteria, T- and
Z-score, and reference databases. Bone 104, 39–43. https://doi.org/10.1016/j.bone.2016.12.016 (2017).
6. Riggs, B. L., Khosla, S. & Melton, L. J. 3rd. Sex steroids and the construction and conservation of the adult skeleton. Endocr. Rev.
23, 279–302. https://doi.org/10.1210/edrv.23.3.0465 (2002).
7. Zebaze, R. M. et al. Intracortical remodelling and porosity in the distal radius and post-mortem femurs of women: A cross-sectional
study. Lancet 375, 1729–1736. https://doi.org/10.1016/S0140-6736(10)60320-0 (2010).
8. Osterhoff, G. et al. Bone mechanical properties and changes with osteoporosis. Injury 47(Suppl 2), S11-20. https://d oi.o rg/1 0.1 016/
S0020-1383(16)47003-8 (2016).
9. Zioupos, P. & Currey, J. D. Changes in the stiffness, strength, and toughness of human cortical bone with age. Bone 22, 57–66.
https://doi.org/10.1016/s8756-3282(97)00228-7 (1998).
10. Wang, X., Shen, X., Li, X. & Agrawal, C. M. Age-related changes in the collagen network and toughness of bone. Bone 31, 1–7.
https://doi.org/10.1016/s8756-3282(01)00697-4 (2002).
11. Chen, H., Zhou, X., Fujita, H., Onozuka, M. & Kubo, K. Y. Age-related changes in trabecular and cortical bone microstructure.
Int. J. Endocrinol. 2013, 213234. https://doi.org/10.1155/2013/213234 (2013).
12. Whitmarsh, T. et al. A cross-sectional study on the age-related cortical and trabecular bone changes at the femoral head in elderly
female hip fracture patients. Sci. Rep. 9, 305. https://doi.org/10.1038/s41598-018-36299-y (2019).
13. Snyder, B. D., Piazza, S., Edwards, W. T. & Hayes, W. C. Role of trabecular morphology in the etiology of age-related vertebral
fractures. Calcif. Tissue Int. 53(Suppl 1), S14-22. https://doi.org/10.1007/BF01673396 (1993).
14. Lochmuller, E. M. et al. Site-specific deterioration of trabecular bone architecture in men and women with advancing age. J. Bone
Miner. Res. 23, 1964–1973. https://doi.org/10.1359/jbmr.080709 (2008).
15. Mirza, F. & Canalis, E. Management of endocrine disease: Secondary osteoporosis: pathophysiology and management. Eur. J.
Endocrinol. 173, R131-151. https://doi.org/10.1530/EJE-15-0118 (2015).
16. Diab, D. L. & Watts, N. B. Secondary osteoporosis: Differential diagnosis and workup. Clin. Obstet. Gynecol. 56, 686–693. https://
doi.org/10.1097/GRF.0b013e3182a9b5f9 (2013).
17. Stein, E. & Shane, E. Secondary osteoporosis. Endocrinol. Metab. Clin. N. Am. 32, 115–134. https://d oi.o
rg/1 0.1 016/s 0889-8 529(02)
00062-2 (2003).
18. Ji, M. X. & Yu, Q. Primary osteoporosis in postmenopausal women. Chron. Dis. Transl. Med. 1, 9–13. https://doi.org/10.1016/j.
cdtm.2015.02.006 (2015).
19. Lerner, U. H. Bone remodeling in post-menopausal osteoporosis. J. Dent. Res. 85, 584–595. https://doi.org/10.1177/1544059106
08500703 (2006).
20. Cawthon, P. M. Gender differences in osteoporosis and fractures. Clin. Orthop. Relat. Res. 469, 1900–1905. https://d oi.o rg/1 0.1 007/
s11999-011-1780-7 (2011).
21. Syed, F. & Khosla, S. Mechanisms of sex steroid effects on bone. Biochem. Biophys. Res. Commun. 328, 688–696. https://doi.org/
10.1016/j.bbrc.2004.11.097 (2005).
22. Lillie, E. M., Urban, J. E., Lynch, S. K., Weaver, A. A. & Stitzel, J. D. Evaluation of skull cortical thickness changes with age and sex
from computed tomography scans. J. Bone Miner. Res. 31, 299–307. https://doi.org/10.1002/jbmr.2613 (2016).
23. Adanty, K. et al. Cortical and trabecular morphometric properties of the human CALVARIUM. Bone, 115931. https://doi.org/10.
1016/j.bone.2021.115931 (2021).
24. Motherway, J. A., Verschueren, P., Van der Perre, G., Vander Sloten, J. & Gilchrist, M. D. The mechanical properties of cranial bone:
The effect of loading rate and cranial sampling position. J. Biomech. 42, 2129–2135. https://doi.org/10.1016/j.jbiomech.2009.05.
030 (2009).
25. Peterson, J. & Dechow, P. C. Material properties of the inner and outer cortical tables of the human parietal bone. Anat. Rec. 268,
7–15. https://doi.org/10.1002/ar.10131 (2002).
26. Boruah, S. et al. Variation of bone layer thicknesses and trabecular volume fraction in the adult male human calvarium. Bone 77,
120–134. https://doi.org/10.1016/j.bone.2015.04.031 (2015).
27. Campbell, G. M. & Sophocleous, A. Quantitative analysis of bone and soft tissue by micro-computed tomography: Applications
to ex vivo and in vivo studies. BoneKEy Rep. 3, 564. https://doi.org/10.1038/bonekey.2014.59 (2014).
Scientific Reports | (2022) 12:8117 | https://doi.org/10.1038/s41598-022-11965-4 13
Vol.:(0123456789)www.nature.com/scientificreports/
28. Bouxsein, M. L. et al. Guidelines for assessment of bone microstructure in rodents using micro-computed tomography. J. Bone
Miner. Res. 25, 1468–1486. https://doi.org/10.1002/jbmr.141 (2010).
29. Tassani, S., Korfiatis, V. & Matsopoulos, G. K. Influence of segmentation on micro-CT images of trabecular bone. J. Microsc. 256,
75–81. https://doi.org/10.1111/jmi.12159 (2014).
30. Kono, K. et al. Three-dimensional changes in the craniofacial complex associated with soft-diet feeding. Eur. J. Orthod. 42, 509–516.
https://doi.org/10.1093/ejo/cjaa007 (2020).
31. Lee, S. K. et al. Prenatal development of the human mandible. Anat. Rec. 263, 314–325. https://doi.org/10.1002/ar.1110 (2001).
32. Rengasamy Venugopalan, S. & Van Otterloo, E. The Skull’s Girder: A Brief Review of the Cranial Base. J. Dev. Biol. 9. https://doi.
org/10.3390/jdb9010003 (2021).
33. Vora, S. R., Camci, E. D. & Cox, T. C. Postnatal ontogeny of the cranial base and craniofacial skeleton in male C57BL/6J mice: A
reference standard for quantitative analysis. Front. Physiol. 6, 417. https://doi.org/10.3389/fphys.2015.00417 (2015).
34. Kohler, T., Stauber, M., Donahue, L. R. & Muller, R. Automated compartmental analysis for high-throughput skeletal phenotyping
in femora of genetic mouse models. Bone 41, 659–667. https://doi.org/10.1016/j.bone.2007.05.018 (2007).
35. Buie, H. R., Campbell, G. M., Klinck, R. J., MacNeil, J. A. & Boyd, S. K. Automatic segmentation of cortical and trabecular com-
partments based on a dual threshold technique for in vivo micro-CT bone analysis. Bone 41, 505–515. https://doi.org/10.1016/j.
bone.2007.07.007 (2007).
36. Klintstrom, E., Smedby, O., Moreno, R. & Brismar, T. B. Trabecular bone structure parameters from 3D image processing of clinical
multi-slice and cone-beam computed tomography data. Skelet. Radiol. 43, 197–204. https://doi.org/10.1007/s00256-013-1766-5
(2014).
37. Klintstrom, E., Smedby, O., Klintstrom, B., Brismar, T. B. & Moreno, R. Trabecular bone histomorphometric measurements and
contrast-to-noise ratio in CBCT. Dentomaxillofac. Radiol. 43, 20140196. https://doi.org/10.1259/dmfr.20140196 (2014).
38. Buie, H. R., Moore, C. P. & Boyd, S. K. Postpubertal architectural developmental patterns differ between the L3 vertebra and
proximal tibia in three inbred strains of mice. J. Bone Miner. Res. 23, 2048–2059. https://doi.org/10.1359/jbmr.080808 (2008).
39. Glatt, V., Canalis, E., Stadmeyer, L. & Bouxsein, M. L. Age-related changes in trabecular architecture differ in female and male
C57BL/6J mice. J. Bone Miner. Res. 22, 1197–1207. https://doi.org/10.1359/jbmr.070507 (2007).
40. Halloran, B. P. et al. Changes in bone structure and mass with advancing age in the male C57BL/6J mouse. J. Bone Miner. Res. 17,
1044–1050. https://doi.org/10.1359/jbmr.2002.17.6.1044 (2002).
41. McBratney-Owen, B., Iseki, S., Bamforth, S. D., Olsen, B. R. & Morriss-Kay, G. M. Development and tissue origins of the mam-
malian cranial base. Dev. Biol. 322, 121–132. https://doi.org/10.1016/j.ydbio.2008.07.016 (2008).
42. Wei, X., Hu, M., Mishina, Y. & Liu, F. Developmental regulation of the growth plate and cranial synchondrosis. J. Dent. Res. 95,
1221–1229. https://doi.org/10.1177/0022034516651823 (2016).
43. Parada, C. & Chai, Y. Mandible and tongue development. Curr. Top. Dev. Biol. 115, 31–58. https://doi.org/10.1016/bs.ctdb.2015.
07.023 (2015).
44. Yokota, K. et al. Deterioration of bone microstructure by aging and menopause in Japanese healthy women: analysis by HR-pQCT.
J. Bone Miner. Metab. 38, 826–838. https://doi.org/10.1007/s00774-020-01115-z (2020).
45. Tratwal, J. et al. MarrowQuant across aging and aplasia: A digital pathology workflow for quantification of bone marrow compart-
ments in histological sections. Front. Endocrinol. 11, 480. https://doi.org/10.3389/fendo.2020.00480 (2020).
46. Kunstyr, I. & Leuenberger, H. G. Gerontological data of C57BL/6J mice. I. Sex differences in survival curves. J. Gerontol. 30,
157–162. https://doi.org/10.1093/geronj/30.2.157 (1975).
47. Yuan, R., Peters, L. L. & Paigen, B. Mice as a mammalian model for research on the genetics of aging. ILAR J. 52, 4–15. https://doi.
org/10.1093/ilar.52.1.4 (2011).
48. Diaz Brinton, R. Minireview: translational animal models of human menopause: Challenges and emerging opportunities. Endo-
crinology 153, 3571–3578. https://doi.org/10.1210/en.2012-1340 (2012).
49. Van Kempen, T. A., Milner, T. A. & Waters, E. M. Accelerated ovarian failure: A novel, chemically induced animal model of
menopause. Brain Res. 1379, 176–187. https://doi.org/10.1016/j.brainres.2010.12.064 (2011).
50. Finch, C. E., Felicio, L. S., Mobbs, C. V. & Nelson, J. F. Ovarian and steroidal influences on neuroendocrine aging processes in
female rodents. Endocr. Rev. 5, 467–497. https://doi.org/10.1210/edrv-5-4-467 (1984).
51. Mills, E. G. et al. The relationship between bone and reproductive hormones beyond estrogens and androgens. Endocr. Rev. 42,
691–719. https://doi.org/10.1210/endrev/bnab015 (2021).
52. Khosla, S. & Monroe, D. G. Regulation of bone metabolism by sex steroids. Cold Spring Harbor Perspect. Med. 8. https://doi.org/
10.1101/cshperspect.a031211 (2018).
53. Iqbal, J., Blair, H. C., Zallone, A., Sun, L. & Zaidi, M. Further evidence that FSH causes bone loss independently of low estrogen.
Endocrine 41, 171–175. https://doi.org/10.1007/s12020-012-9626-y (2012).
54. Garcia-Martin, A. et al. Role of serum FSH measurement on bone resorption in postmenopausal women. Endocrine 41, 302–308.
https://doi.org/10.1007/s12020-011-9541-7 (2012).
55. Park, Y. M. et al. Bone mineral density in different menopause stages is associated with follicle stimulating hormone levels in
healthy women. Int. J. Environ. Res. Public Health 18. https://doi.org/10.3390/ijerph18031200 (2021).
56. Almeida, M. et al. Estrogen receptor-alpha signaling in osteoblast progenitors stimulates cortical bone accrual. J. Clin. Invest. 123,
394–404. https://doi.org/10.1172/JCI65910 (2013).
57. Ucer, S. et al. The effects of androgens on murine cortical bone do not require AR or ERalpha signaling in osteoblasts and osteo-
clasts. J. Bone Miner. Res. 30, 1138–1149. https://doi.org/10.1002/jbmr.2485 (2015).
58. Windahl, S. H., Vidal, O., Andersson, G., Gustafsson, J. A. & Ohlsson, C. Increased cortical bone mineral content but unchanged
trabecular bone mineral density in female ERbeta(-/-) mice. J. Clin. Invest. 104, 895–901. https://doi.org/10.1172/JCI6730 (1999).
59. Wei, Y. et al. Estrogen prevents cellular senescence and bone loss through Usp10-dependent p53 degradation in osteocytes and
osteoblasts: The role of estrogen in bone cell senescence. Cell Tissue Res. 386, 297–308. https://d oi.o
rg/1 0.1 007/s 00441-0 21-0 3496-7
(2021).
60. Martin-Millan, M. et al. The estrogen receptor-alpha in osteoclasts mediates the protective effects of estrogens on cancellous but
not cortical bone. Mol. Endocrinol. 24, 323–334. https://doi.org/10.1210/me.2009-0354 (2010).
61. Nakamura, T. et al. Estrogen prevents bone loss via estrogen receptor alpha and induction of Fas ligand in osteoclasts. Cell 130,
811–823. https://doi.org/10.1016/j.cell.2007.07.025 (2007).
62. Schiavi, J., Fodera, D. M., Brennan, M. A. & McNamara, L. M. Estrogen depletion alters osteogenic differentiation and matrix
production by osteoblasts in vitro. Exp. Cell Res. 408, 112814. https://doi.org/10.1016/j.yexcr.2021.112814 (2021).
63. McNamara, L. M. Osteocytes and estrogen deficiency. Curr. Osteoporos. Rep. 19, 592–603. https://doi.org/10.1007/s11914-021-
00702-x (2021).
64. Lewis, K. J. et al. Estrogen depletion on In vivo osteocyte calcium signaling responses to mechanical loading. Bone 152, 116072.
https://doi.org/10.1016/j.bone.2021.116072 (2021).
65. Simfia, I., Schiavi, J. & McNamara, L. M. Alterations in osteocyte mediated osteoclastogenesis during estrogen deficiency and
under ROCK-II inhibition: An in vitro study using a novel postmenopausal multicellular niche model. Exp. Cell Res. 392, 112005.
https://doi.org/10.1016/j.yexcr.2020.112005 (2020).
66. Wang, J. et al. Follicle-stimulating hormone increases the risk of postmenopausal osteoporosis by stimulating osteoclast differentia-
tion. PLoS ONE 10, e0134986. https://doi.org/10.1371/journal.pone.0134986 (2015).
Scientific Reports | (2022) 12:8117 | https://doi.org/10.1038/s41598-022-11965-4 14
Vol:.(1234567890)www.nature.com/scientificreports/
67. Zhu, L. L. et al. Blocking antibody to the beta-subunit of FSH prevents bone loss by inhibiting bone resorption and stimulating
bone synthesis. Proc. Natl. Acad. Sci. U S A 109, 14574–14579. https://doi.org/10.1073/pnas.1212806109 (2012).
68. Zaidi, M. et al. Proresorptive actions of FSH and bone loss. Ann. N. Y. Acad. Sci. 1116, 376–382. https://doi.org/10.1196/annals.
1402.056 (2007).
69. Belenska-Todorova, L., Zhivkova, R., Markova, M. & Ivanovska, N. Follicle stimulating hormone and estradiol alter immune
response in osteoarthritic mice in an opposite manner. Int. J. Immunopathol. Pharmacol. 35, 20587384211016200. https://doi.org/
10.1177/20587384211016198 (2021).
70. Gomez-Aparicio, M. A. et al. Bone health and therapeutic agents in advanced prostate cancer. Front. Biosci. 27, 34. https://doi.org/
10.31083/j.fbl2701034 (2022).
71. Rachner, T. D., Coleman, R., Hadji, P. & Hofbauer, L. C. Bone health during endocrine therapy for cancer. Lancet Diabetes Endo-
crinol. 6, 901–910. https://doi.org/10.1016/S2213-8587(18)30047-0 (2018).
72. Sibilia, V. et al. Sex steroid regulation of oxidative stress in bone cells: An in vitro study. Int. J. Environ. Res. Public Health 18. https://
doi.org/10.3390/ijerph182212168 (2021).
73. Russell, P. K. et al. Androgen receptor action in osteoblasts in male mice is dependent on their stage of maturation. J. Bone Miner.
Res. 30, 809–823. https://doi.org/10.1002/jbmr.2413 (2015).
74. Machida, T., Yonezawa, Y. & Noumura, T. Age-associated changes in plasma testosterone levels in male mice and their relation to
social dominance or subordinance. Horm. Behav. 15, 238–245. https://doi.org/10.1016/0018-506x(81)90013-1 (1981).
75. Bahougne, T., Angelopoulou, E., Jeandidier, N. & Simonneaux, V. Individual evaluation of luteinizing hormone in aged C57BL/6
J female mice. GeroScience 42, 323–331. https://doi.org/10.1007/s11357-019-00104-z (2020).
76. Zhang, J., Yang, L. M., Pan, X. D., Lin, N. & Chen, X. C. Increased vesicular gamma-GABA transporter and decreased phosphoryla-
tion of synapsin I in the rostral preoptic area is associated with decreased gonadotrophin-releasing hormone and c-Fos coexpression
in middle-aged female mice. J. Neuroendocrinol. 25, 753–761. https://doi.org/10.1111/jne.12050 (2013).
77. Dai, X. et al. Estradiol-induced senescence of hypothalamic astrocytes contributes to aging-related reproductive function declines
in female mice. Aging 12, 6089–6108. https://doi.org/10.18632/aging.103008 (2020).
78. Akintoye, S. O. et al. Skeletal site-specific characterization of orofacial and iliac crest human bone marrow stromal cells in same
individuals. Bone 38, 758–768. https://doi.org/10.1016/j.bone.2005.10.027 (2006).
79. van den Bos, T., Speijer, D., Bank, R. A., Bromme, D. & Everts, V. Differences in matrix composition between calvaria and long
bone in mice suggest differences in biomechanical properties and resorption: Special emphasis on collagen. Bone 43, 459–468.
https://doi.org/10.1016/j.bone.2008.05.009 (2008).
80. Everts, V. et al. Osteoclastic bone degradation and the role of different cysteine proteinases and matrix metalloproteinases: Dif-
ferences between calvaria and long bone. J Bone Miner Res 21, 1399–1408. https://doi.org/10.1359/jbmr.060614 (2006).
81. Goldberg, S., Grynpas, M. D. & Glogauer, M. Heterogeneity of osteoclast activity and bone turnover in different skeletal sites. Arch.
Oral Biol. 71, 134–143. https://doi.org/10.1016/j.archoralbio.2016.06.026 (2016).
82. Schulte, F. A. et al. Local mechanical stimuli regulate bone formation and resorption in mice at the tissue level. PLoS ONE 8, e62172.
https://doi.org/10.1371/journal.pone.0062172 (2013).
83. Yuan, Y. et al. The roles of exercise in bone remodeling and in prevention and treatment of osteoporosis. Prog. Biophys. Mol. Biol.
122, 122–130. https://doi.org/10.1016/j.pbiomolbio.2015.11.005 (2016).
84. Robling, A. G. & Turner, C. H. Mechanical signaling for bone modeling and remodeling. Crit. Rev. Eukaryot. Gene Expr. 19,
319–338. https://doi.org/10.1615/critreveukargeneexpr.v19.i4.50 (2009).
85. DeLong, A. et al. Protective effects of controlled mechanical loading of bone in C57BL6/J mice subject to disuse. JBMR plus 4,
e10322. https://doi.org/10.1002/jbm4.10322 (2020).
86. Nomura, S. & Takano-Yamamoto, T. Molecular events caused by mechanical stress in bone. Matrix Biol. J. Int. Soc. Matrix Biol.
19, 91–96. https://doi.org/10.1016/s0945-053x(00)00050-0 (2000).
87. Krolner, B. & Toft, B. Vertebral bone loss: An unheeded side effect of therapeutic bed rest. Clin. Sci. 64, 537–540. https://doi.org/
10.1042/cs0640537 (1983).
88. Zerwekh, J. E., Ruml, L. A., Gottschalk, F. & Pak, C. Y. The effects of twelve weeks of bed rest on bone histology, biochemical
markers of bone turnover, and calcium homeostasis in eleven normal subjects. J. Bone Miner. Res. 13, 1594–1601. https://doi.org/
10.1359/jbmr.1998.13.10.1594 (1998).
89. Krolner, B., Toft, B., Pors Nielsen, S. & Tondevold, E. Physical exercise as prophylaxis against involutional vertebral bone loss: a
controlled trial. Clin. Sci. 64, 541–546. https://doi.org/10.1042/cs0640541 (1983).
90. Iwamoto, J., Yeh, J. K. & Aloia, J. F. Differential effect of treadmill exercise on three cancellous bone sites in the young growing rat.
Bone 24, 163–169. https://doi.org/10.1016/s8756-3282(98)00189-6 (1999).
91. Pham, D. & Kiliaridis, S. Evaluation of changes in trabecular alveolar bone during growth using conventional panoramic radio-
graphs. Acta Odontol. Scand. 70, 127–132. https://doi.org/10.3109/00016357.2011.600706 (2012).
92. White, S. C. & Rudolph, D. J. Alterations of the trabecular pattern of the jaws in patients with osteoporosis. Oral Surg. Oral Med.
Oral Pathol. Oral Radiol. Endod. 88, 628–635. https://doi.org/10.1016/s1079-2104(99)70097-1 (1999).
93. Mashiatulla, M., Ross, R. D. & Sumner, D. R. Validation of cortical bone mineral density distribution using micro-computed
tomography. Bone 99, 53–61. https://doi.org/10.1016/j.bone.2017.03.049 (2017).
94. Tan, J. et al. Micro-CT-based bone microarchitecture analysis of the murine skull. Methods Mol. Biol. 2403, 129–145. https://doi.
org/10.1007/978-1-0716-1847-9_10 (2022).
95. Willinghamm, M. D. et al. Age-related changes in bone structure and strength in female and male BALB/c mice. Calcif. Tissue Int.
86, 470–483. https://doi.org/10.1007/s00223-010-9359-y (2010).
96. Papageorgiou, M., Foger-Samwald, U., Wahl, K., Kerschan-Schindl, K. & Pietschmann, P. Age- and strain-related differences in
bone microstructure and body composition during development in inbred male mouse strains. Calcif. Tissue Int. 106, 431–443.
https://doi.org/10.1007/s00223-019-00652-8 (2020).
Acknowledgements
We thank Brian Dawson and Cole D. Kuzawa for technical assistance. This study was supported by grants from
the National Institute of Dental and Craniofacial Research, NIH (R01DE026767), to J.I. and UTHealth School
of Dentistry faculty funds to J.I.
Author contributions
J.S., C.I., and C.G.A. performed the experiments. J.S., C.I., A.S., and J.I. wrote the manuscript. All authors read
and approved the final manuscript.
Funding
This article was funded by National Institute of Dental and Craniofacial Research (Grant no. R01DE026767).
Scientific Reports | (2022) 12:8117 | https://doi.org/10.1038/s41598-022-11965-4 15
Vol.:(0123456789)www.nature.com/scientificreports/
Competing interests
The authors declare no competing interests.
Additional information
Supplementary Information The online version contains supplementary material available at https://doi.org/
10.1038/s41598-022-11965-4.
Correspondence and requests for materials should be addressed to J.I.
Reprints and permissions information is available at www.nature.com/reprints.
Publisher’s note Springer Nature remains neutral with regard to jurisdictional claims in published maps and
institutional affiliations.
Open Access This article is licensed under a Creative Commons Attribution 4.0 International
License, which permits use, sharing, adaptation, distribution and reproduction in any medium or
format, as long as you give appropriate credit to the original author(s) and the source, provide a link to the
Creative Commons licence, and indicate if changes were made. The images or other third party material in this
article are included in the article’s Creative Commons licence, unless indicated otherwise in a credit line to the
material. If material is not included in the article’s Creative Commons licence and your intended use is not
permitted by statutory regulation or exceeds the permitted use, you will need to obtain permission directly from
the copyright holder. To view a copy of this licence, visit http://creativecommons.org/licenses/by/4.0/.
© The Author(s) 2022
Scientific Reports | (2022) 12:8117 | https://doi.org/10.1038/s41598-022-11965-4 16
Vol:.(1234567890)You can also read