Michigan's Adaptive Management Plan for Lake Erie - March 2020
←
→
Page content transcription
If your browser does not render page correctly, please read the page content below
Michigan’s
Adaptive Management Plan
       for Lake Erie
       March 2020

                       1|Page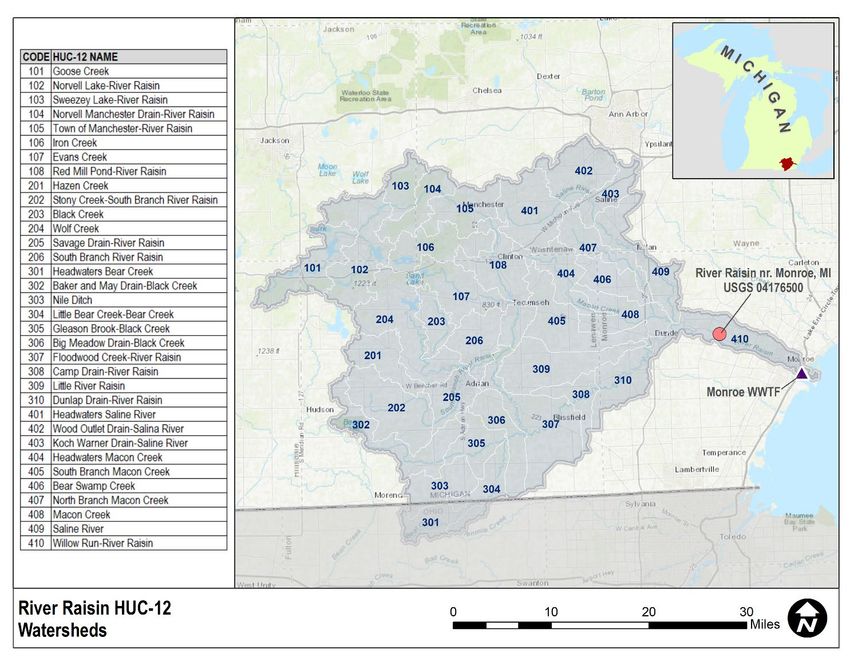
Michigan DAP Adaptive Management Plan Draft, v.6.3, 25 Feb 2020
On the cover: center - Great Lakes map highlighting Lake Erie in dark blue, with image of the Detroit
River mouth in the background (adapted from Michigan Sea Grant); clockwise from upper left – water
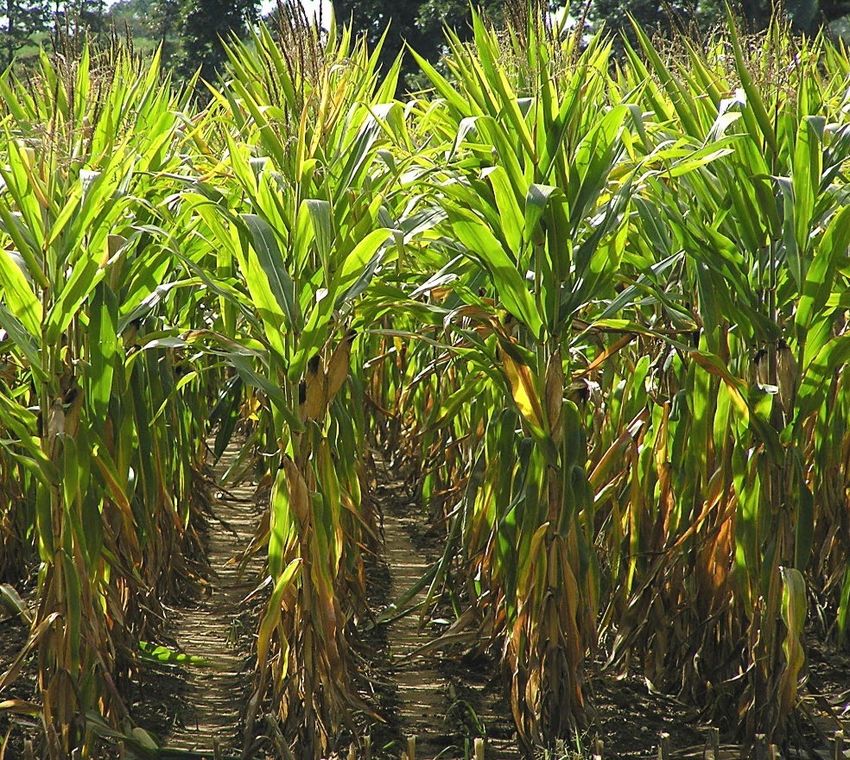
sampling from the Detroit RiverWalk (LimnoTech), corn plants (LimnoTech), Detroit International Wildlife
Refuge (U.S. Fish and Wildlife Service).
Table of Contents
Executive Summary ................................................................................................................... 1
Introduction ................................................................................................................................ 3
Background................................................................................................................................ 5
Assessment of Michigan’s Portion of the Lake Erie Basin .......................................................... 7
Western Lake Erie Basin ........................................................................................................ 8
Upper Maumee River Tributaries – Bean Creek and the St. Joseph River .......................... 8
River Raisin .......................................................................................................................10
Central Lake Erie Basin .........................................................................................................13
Detroit River .......................................................................................................................14
Adaptive Management Approach ..............................................................................................16
DAP Adaptive Management Team Roles and Responsibilities ..............................................17
Stakeholder Roles and Responsibilities .................................................................................17
Addressing Uncertainties and Developing Hypotheses..........................................................19
Performance Measures and Benchmarks ..............................................................................19
Program Tactics and Selected Management Actions.............................................................20
Monitoring, Research, and Evaluation Approach ...................................................................20
Mechanisms for Incorporating Learning into Future Decisions ...............................................21
Schedule and Reporting Progress .........................................................................................22
Outreach and Engagement....................................................................................................22
Near-Term .........................................................................................................................23
Annual and Five-Year Cycle...............................................................................................23
Next Steps ................................................................................................................................24
Appendix A – Michigan DAP/Adaptive Management Plan Task Table ......................................25
Appendix B – Conceptual Model Diagrams ...............................................................................43
Appendix C - References ..........................................................................................................45
Appendix D - Footnotes to accompany Figure 12......................................................................48
Appendix E - Acronyms and Initialisms .....................................................................................49
Michigan DAP Adaptive Management Plan Draft, v.6.3, 25 Feb 2020
List of Figures
Figure 1. Southeast Michigan watershed areas contributing to the St. Clair-Detroit River System
and Western Lake Erie (dark green) and DAP point sources, superimposed on a satellite
image; Ohio and Indiana watershed areas are shown in lighter green. Ontario watershed
areas are not distinguished. ................................................................................................ 4
Figure 2. Estimated past and future percent P loading reduction over time to Lake Erie from
Michigan. Load reduction targets were set by the Annex 4 Objectives and Targets Task
Team (2015). ...................................................................................................................... 7
Figure 3. Western Lake Erie algal bloom severity since 2002, including 2019 forecast (red box
with dots) and actual values (green bar farthest to the right). Source: NOAA, 2019. ........... 8
Figure 4. Upper Maumee Basin tributary watersheds -- St. Joseph River branches, and
monitoring station locations. ................................................................................................ 9
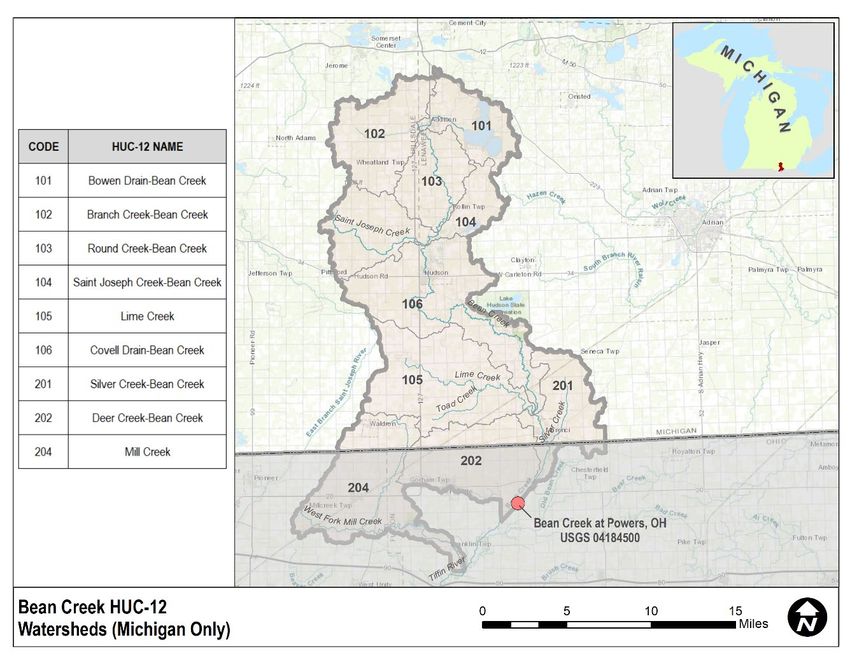
Figure 5. Upper Maumee River tributaries -- Bean Creek, and monitoring station location. .......10
Figure 6. River Raisin Watershed map showing HUC-12 subwatersheds, monitoring location
(USGS station), and Monroe WWTF location. ....................................................................11
Figure 7. River Raisin annual (left) and spring (right) flow (top), TP loads (middle), and SRP
loads (bottom). Note the steady to slightly increasing trend over the last 20 years in both
annual loads and spring loads. Green 40% goal lines for TP in metric tons (MT) are from
the 2018 DAP.....................................................................................................................12
Figure 8. Acreage in the CRP and CREP programs in River Raisin counties declined from 2013-
2017, which may have contributed to the recent increase in annual and spring TP loads
shown in Figure 7 above due to expected increased runoff from cultivation of former CRP
and CREP fields. ................................................................................................................13
Figure 9. Top panel: Lake Erie average summer circulation (top panel, large arrows) showing
transport of Detroit River discharge to Central Basin in lower left of panel (Beletsky et al.,
1999). Bottom panel: Numerical model simulation of the low-oxygen area of central Lake
Erie for 18 September 2018: https://noaaglerl.blog/tag/hypoxia/ . See Rowe et al. (2019) for
more details on the model. Colored circles indicate locations of monitoring data, for
comparison with model output. A conceptual diagram of Central Basin processes is
included in Appendix B. ......................................................................................................14
Figure 10. Adaptive management process diagram modified from the Michigan DAP (2018).
Source: National Academies Press; original figure adapted from a Department of Interior
source (see Williams et al., 2009). .....................................................................................16
Figure 11. Proposed conceptual governance and support structure for Michigan DAP adaptive
management cycle. Note that components, roles, and commitments are currently under
development. .....................................................................................................................17
Figure 12. River Raisin and Maumee tributaries conceptual diagram of the NPS phenomena
and processes that influence nutrient loading from Michigan to Lake Erie. Nutrient
movement (light green) is from fields to waterways to the lake (bottom to top). State
management programs and options are shown in blue boxes (lower right), and external
drivers are shown in orange boxes (lower left). Additional notes on this figure are contained
in Appendix D. Acronyms are listed in Appendix E. ............................................................18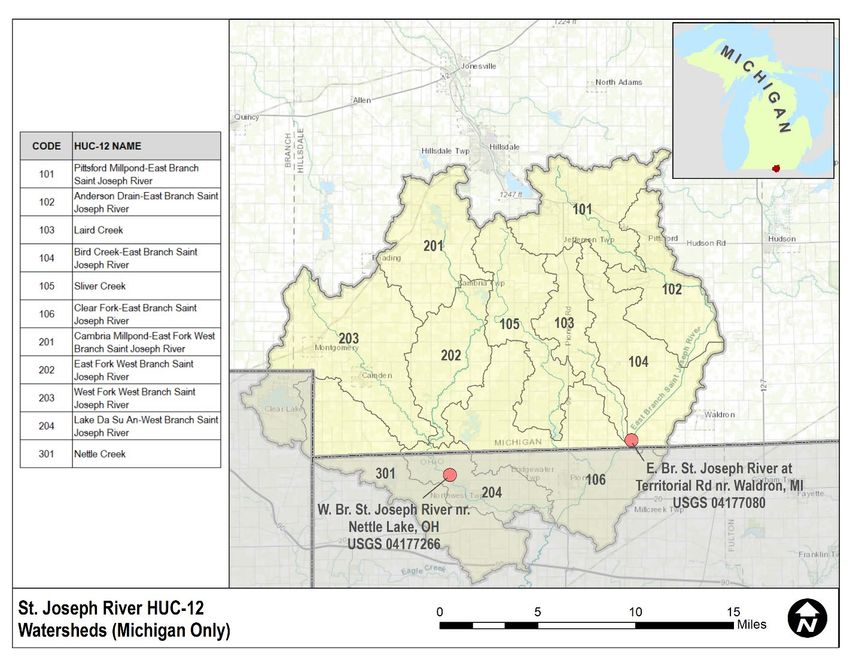
Michigan DAP Adaptive Management Plan Draft, v.6.3, 25 Feb 2020

How to cite:
State of Michigan, 2020. Michigan’s Adaptive Management Plan for Lake Erie. Prepared by
Michigan Department of Agriculture and Rural Development (MDARD), Michigan Department of
Natural Resources (DNR), and Department of Environment, Great Lakes, and Energy (EGLE),
50 p.
Financial support for preparation of this plan was provided by the U.S. Environmental Protection
Agency as part of the U.S. Great Lakes Restoration Initiative.
Executive Summary
Lake Erie, Michigan’s warmest and shallowest Great Lake, has experienced impacts from algae
overgrowth fueled by excess nutrients and other factors, and a growing hypoxic or “dead zone”
at the bottom of the lake, where dissolved oxygen is depleted during the summer and fall. The
causes are complex, and natural resource managers at the binational, federal, state, regional,
and local levels are working to fully understand them. The State of Michigan is committed to
reducing inputs of the nutrient phosphorus to the lake to help reduce occurrences of harmful
algal blooms (HABs) that can produce toxins, and to improve oxygen concentrations to reduce
the “dead zone” area. In February 2018, the state released the Michigan Lake Erie Domestic
Action Plan (DAP) that provides the road map for reducing phosphorus entering Lake Erie by 20
percent by 2020, and 40 percent by 2025. The DAP was drafted by management staff from the
Michigan departments of Agriculture and Rural Development (MDARD); Natural Resources
(DNR); and Environment, Great Lakes, and Energy (EGLE).
These state agencies collaborate with regional and local partners to improve conditions in the
Lake Erie watershed and in the lake by reducing contributions from rural and urban sources of
phosphorus to the water. MDARD continues to promote comprehensive conservation planning
on farmlands through the Michigan Agriculture Environmental Assurance Program (MAEAP). In
partnership with EGLE, investments in upgrades to wastewater treatment plants by communities
in Southeast Michigan have substantially improved water quality in the Detroit River over the
last 10 years, putting Michigan ahead of schedule on the aspirational goal of a 20 percent
phosphorus load reduction by 2020. However, the work is not complete. Reducing nutrient loads
from farmland and other distributed sources to achieve the 40 percent reduction goal by 2025
has proven more challenging.
To address societal and environmental challenges in the Western Lake Erie Basin (WLEB),
Michigan is developing an adaptive management framework and plan that will serve as a
companion document to the DAP. This approach is a learning-based management framework
that recognizes the uncertainties that are inherent in management of complex social and
environmental systems, and that seeks to reduce these uncertainties over time. The framework
incorporates active hypothesis development and testing so that future management actions
become progressively more effective and the uncertainty around achieving positive outcomes is
reduced (Williams et al., 2009). The framework also incorporates transparency throughout the
process so that management decisions can be made with input from affected and interested
stakeholders, as well as from technical experts.
The adaptive management cycle consists of six
iterative steps: 1) setting goals, 2) planning and
prioritizing, 3) implementing, 4) monitoring, 5)
evaluating, and 6) adjusting. MDARD, EGLE,
and DNR staff are working together as the
Adaptive Management Team to plan and
implement a cohesive and structured adaptive
management process. They are developing
joint annual progress reports and two-year
work plans, along with five-year DAP updates,
that will capture lessons learned, spell out
commitments of responsible agencies and key

                                                                                   1|Page
Michigan DAP Adaptive Management Plan Draft, v.6.3, 25 Feb 2020

partners, and help align resources and research with management needs. This regular and
predictable planning, assessment, and reporting cycle, with feedback from an advisory group(s)
built in and roles clearly defined, is designed to give managers and stakeholders more
confidence in the collaborative process of tackling Lake Erie’s HAB and hypoxia issues
together.
Similar to the 2018 DAP process, the adaptive management approach described above is
expected to maximize environmental and economic benefits, while addressing the nutrient
issues in Michigan’s portion of the Lake Erie Basin. The state agencies are committed to this
process and actively working with partners to strategically target planning and implementation
actions using existing programmatic technical and financial assistance, supporting new
innovative approaches and partnerships, and accelerating comprehensive conservation
planning through MAEAP and other land management programs. The ability to specifically track
implementation of these management actions through an adaptive management framework
informed by monitoring of watersheds, rivers, and Lake Erie, will improve the state’s ability to
adjust our strategic actions moving forward. Ultimately, success will be defined by actions taken
by all stakeholders in the Lake Erie Basin.
DAP and Adaptive Management Reporting Timeline

    2018         2019        2020         2021         2022         2023         2024        2025
                  DAP                   DAP/AM       DAP/AM                    DAP/AM       DAP/AM
   MI DAP                                                           DAP
                Progress                Progress     Progress                  Progress     Progress
  Developed                                                        Update
                 Update                  Update       Update                    Update       Update
    Taking                                DAP          DAP                       DAP          DAP
 Action Lake                            Progress     Progress                  Progress     Progress
 Erie Website                            Update       Update                    Update       Update
                            Adaptive
                           Mgmt. Plan
                           Developed
                           Two-Year
                           Work Plan*
                                        Two-Year
                                        Work Plan*
                                                     Two-Year
                                                     Work Plan*
                                                                  Two-Year
                                                                  Work Plan*
                                                                               Two-Year
                                                                               Work Plan*

*Two-year work plans will be revised each year, as the second year will contain projections.

                                                                                            2|Page
Michigan DAP Adaptive Management Plan Draft, v.6.3, 25 Feb 2020

Introduction
Lake Erie is Michigan’s warmest and shallowest Great Lake, which contributes to its
vulnerability to algal blooms and dissolved oxygen depletion. Michigan, along with the other
states that contain parts of the Lake Erie watershed (Figure 1) and the province of Ontario, are
engaged in a collaborative effort to reduce nutrient inputs to the lake, in order to address
negative ecosystem impacts including HABs in the WLEB, hypoxia (i.e., low dissolved oxygen)
in the Central Basin, and nuisance Cladophora growth in the Eastern Basin. Since the 2012
Great Lakes Water Quality Agreement (GLWQA) went into effect in 2013, the Parties to the
GLWQA (i.e., the federal governments of Canada and the United States [U.S.]), have been
working through the Annex 4 (Nutrient) process with state and provincial jurisdictions to
determine specific ecosystem goals to achieve, establishing a collaborative process for
identifying actions needed, and creating a framework for measuring water quality improvement
and making progress toward meeting the ecosystem improvement goals. An important
component of this binational process was for each jurisdiction to develop a domestic action plan
or DAP.
Michigan released its DAP in 2018 (State of Michigan, 2018), which was drafted by
management staff from MDARD, DNR, and EGLE. The DAP outlined Michigan-specific
programmatic tactics and management tasks for reducing phosphorus entering Lake Erie from
Michigan’s waters by 40 percent by 2025. The Michigan DAP and the other jurisdictions’ DAPs
informed the development of the U.S. Environmental Protection Agency (USEPA) Action Plan
for Lake Erie (2018) and the Lake Erie Binational Phosphorus Reduction Strategy (GLWQA
Nutrients Annex Subcommittee, 2019). When taken together, these plans outlined the
binational, federal, state, regional, and local actions and priorities for meeting the overall
ecosystem goals for Lake Erie set forth under the GLWQA, as well as identifying gaps in data or
process understanding that posed challenges.
Each of the DAPs (e.g., State of Ohio, 2020) make reference to the use of an adaptive
management approach for implementation, which consists of a structured process for:
    1.   Considering alternative ways to meet environmental objectives,
    2.   Moving forward with thoughtful actions based on the current state of knowledge,
    3.   Monitoring to learn about the impacts of implemented management actions, and
    4.   Using the resulting information to update knowledge, to guide future research and
         monitoring, and to adjust management actions.
This approach is a learning-based management framework that recognizes the uncertainties
that are inherent in managing complex social and environmental systems. The framework
incorporates active hypothesis testing over time so that future management actions become
progressively more effective and the uncertainty around achieving positive outcomes is reduced
(Williams et al., 2009). The framework also incorporates transparency throughout the process
so that management decisions can be made with input from affected and interested
stakeholders.
The adaptive management cycle consists of six iterative steps: 1) setting goals, 2) planning and
prioritizing, 3) implementing, 4) monitoring, 5) evaluating, and 6) adjusting. For a complex issue
like addressing eutrophic conditions in Lake Erie, clear explanations need to be communicated
at the decision point in the management cycle about: 1) how choices were made among
competing alternatives to optimize outcomes and minimize negative impacts; 2) how watershed

                                                                                       3|Page
Michigan DAP Adaptive Management Plan Draft, v.6.3, 25 Feb 2020

and lake monitoring and modeling will be used to assess relative effectiveness as
implementation moves forward; and, 3) what research is underway or should be conducted to
reduce uncertainty and to improve the next round of decisions.
This Adaptive Management Plan provides progress updates and expands on DAP objectives,
tactics, and associated tasks outlined in the 2018 Michigan DAP (Appendix A). The Plan also
outlines the initial set-up phase of a collaborative framework under which active adaptive
management will be carried out by MDARD, EGLE, DNR, and partners. Aspects of the plan
include: background information, a description of the state of the watersheds and ecosystems, a
proposed governance and support structure for the adaptive management process, a multi-year
adaptive management schedule, and an outreach and engagement approach.

Figure 1. Southeast Michigan watershed areas contributing to the St. Clair-Detroit River System
and Western Lake Erie (dark green) and DAP point sources, superimposed on a satellite image;
Ohio and Indiana watershed areas are shown in lighter green. Ontario watershed areas are not
distinguished.

                                                                                    4|Page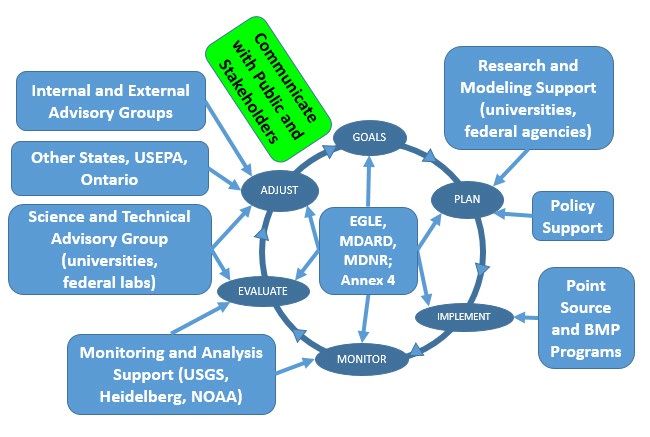
Michigan DAP Adaptive Management Plan Draft, v.6.3, 25 Feb 2020

Background
Michigan’s approach to managing nutrient loads is governed by several agreements, including
the 2012 GLWQA (Annex 4), the 2015 Western Lake Erie Collaborative Agreement
(Collaborative Agreement) that set the phosphorus reduction 2020 and 2025 time-bound
commitments, the 2018 Michigan DAP, and Governor Whitmer’s 2019 Executive Directive No.
2019-14, which reaffirmed the state’s commitment to achieving the 40 percent phosphorus
reduction goals by 2025 that were set forth under the GLWQA and the Collaborative
Agreement.
The GLWQA Annex 4 (Nutrients) states that:
“…the Parties shall develop for Lake Erie, within five years of entry into force of this Agreement
[2013] and for other Great Lakes as required, phosphorus reduction strategies and domestic
action plans to meet Substance Objectives for phosphorus concentrations, loading targets, and
loading allocations apportioned by country, developed pursuant to this Annex. These strategies
and action plans shall include:
     (a) Assessment of environmental conditions;
     (b) Identification of priorities for binational research and monitoring; and
     (c) Identification of priorities for implementation of measures to manage phosphorous
     loading to the Waters of the Great Lakes”.
The following ecosystem goals for Lake Erie were also established through the Annex 4
process:

•   Minimize the extent of hypoxic zones in the waters of the Central Basin of Lake Erie.
    Reduce total phosphorus (TP) entering the Western and Central basins of Lake Erie by 40
    percent - from the U.S. and from Canada – to achieve an annual load of 6,000 metric tons
    (MT) to the Central Basin. This amounts to a reduction from the U.S. and Canada of 3,316
    MT and 212 MT, respectively.
•   Maintain algal species consistent with healthy aquatic ecosystems in the nearshore waters
    of the Western and Central basins of Lake Erie. For the Western Basin this means
    conditions that are similar to or smaller than bloom conditions observed in mid-year blooms
    in 2004 or 2012, 90 percent of the time. Reduce spring total and SRP loads from the
    following watersheds where algae is a localized problem by 40 percent: in Canada, the
    Thames River and Leamington tributaries; and in the U.S., the Maumee, River Raisin,
    Portage River, Toussaint Creek, Sandusky River, and Huron River (Ohio).
•   Maintain cyanobacteria biomass at levels that do not produce concentrations of toxins that
    pose a threat to human or ecosystem health in the waters of the Western Basin of Lake
    Erie. Reduce spring total and SRP loads from the Maumee River in the U.S. by 40 percent.
Based on 2008 load estimates determined through the Annex 4 process, Michigan estimated
phosphorus loading reductions needed from the following tributaries and associated
watersheds by 20 percent by 2020, and 40 percent by 2025 (Table 1):

    •   TP loads from the Detroit River,
    •   Spring TP loads from the River Raisin,
    •   Spring SRP loads from the River Raisin, and
    •   Spring TP and SRP loading contributions from the Maumee River.

                                                                                        5|Page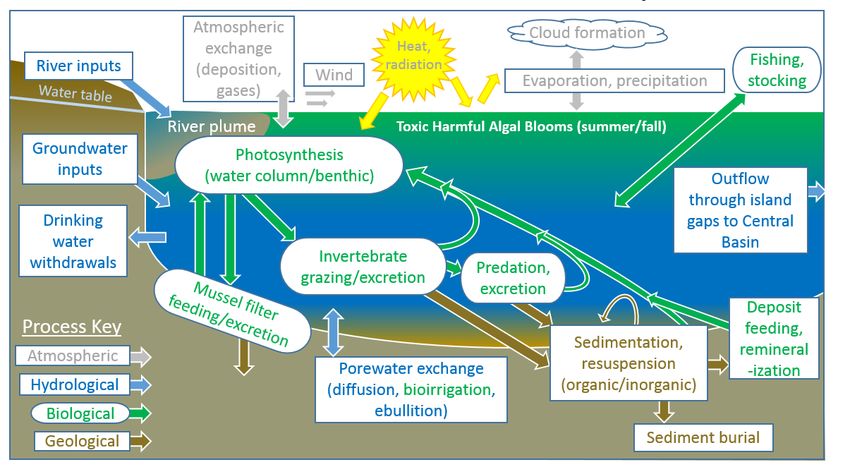
Michigan DAP Adaptive Management Plan Draft, v.6.3, 25 Feb 2020

The load reductions related to Michigan’s portion of the Maumee River Watershed (Figure 1),
specifically the St. Joseph River (Figure 4) and Bean Creek (Figure 5) subwatersheds, will be
further refined based on collaborative monitoring that is being conducted by Michigan, Ohio, and
Indiana in partnership with USEPA and the U.S. Geological Survey (USGS).
The 2018 DAP also included 10 tasks with associated actions that were to be implemented to
help reach the 40 percent reduction goal. Appendix A contains an updated and expanded
version of the DAP Tasks Table, and includes new projects and initiatives thought to be
conducive to the adaptive management process. Particularly significant under the 2018 priority
tasks were: continued reduction of point sources that directly discharge to the Detroit River or
Lake Erie, collaboration and coordination with partners on additional HABs research,
implementation of additional agricultural practices to reduce nonpoint source (NPS) nutrient
loads in the River Raisin and Upper Maumee Watershed (i.e., Bean Creek and St. Joseph
River), and implementation of green infrastructure projects and restoration of wetlands to
remove phosphorus from tributaries (Kalcic et al., 2018).
The most substantial progress to date, relative to a 2008 baseline, has been reduction of point
source loads via upgrades to wastewater treatment facilities, especially those of the Great
Lakes Water Authority (GLWA) in Detroit (Figure 1). Based on actual and projected phosphorus
reductions, limited progress in reducing nutrient loads from Michigan toward 2025 targets has
been achieved since approximately 2012 when the 2020 goal of 20 percent reduction was met,
(Figure 2). There is a need to continue to keep the wastewater treatment facilities in compliance
with their reduced phosphorus effluent limits and to focus on NPS management actions in the
River Raisin and Upper Maumee watersheds.
Besides the greater challenges of reducing NPS loading relative to point source reductions,
additional factors such as weather variability and flooding can overwhelm the positive signal of
NPS management actions that might have otherwise been detected in tributary monitoring.
Improving understanding of the human and ecological processes that influence nutrient loading
is a priority focus of the adaptive management process.
Table 1. Phosphorus load reduction goals reproduced from the 2018 Michigan DAP.

                                                                                      6|Page
Michigan DAP Adaptive Management Plan Draft, v.6.3, 25 Feb 2020
Figure 2. Estimated past and future percent P loading reduction over time to Lake Erie from
Michigan. Load reduction targets were set by the Annex 4 Objectives and Targets Task Team
(2015).
Assessment of Michigan’s Portion of the Lake Erie Basin
Effective adaptive management of environmental restoration requires regular assessment of the
state of management actions themselves, expected direct results of management actions, and
expected ecosystem outcomes. One way to keep track of refinements in understanding of how
the ecosystem components function is to develop and regularly revisit conceptual models of
parts of the Lake Erie system (Appendix B).
In preparation for developing the Adaptive Management Plan, agency staff held an influence
diagram workshop to “gather the givens” to clarify nutrient sources, review results of recent
research on NPS loading, including recent findings related to Lake Huron nutrient inputs (Scavia
et al. 2019a, 2019b), and consider how point source and NPS programs might be better
quantified and enhanced to track and accelerate progress toward nutrient reduction goals
(Scavia et al., 2016). Point sources to the Detroit River (Figure 1) were also discussed briefly,
but primary attention was concentrated on processes and programs identified in a draft NPS
loading influence diagram (Figure 12). The conceptual models and influence diagrams that were
developed as outputs of the workshop and the following status assessments of Michigan’s
portion of the Lake Erie Basin helped determine new projects and initiatives that were thought to
address knowledge gaps and uncertainties, and that were also conducive to using an adaptive
management approach.
7|PageMichigan DAP Adaptive Management Plan Draft, v.6.3, 25 Feb 2020
Western Lake Erie Basin
It is important to understand the components and processes operating to produce HABs in the
WLEB (Appendix B). Understanding the relative magnitudes of the biomass pools and fluxes of
nutrients and energy in the system can help with determining where management actions and
monitoring systems might be effectively applied to reduce HABs. As further studies and
monitoring improve understanding of the system, additional components of the simplified
conceptual model diagram of the system can be added, and existing components can be
removed or modified. The conceptual model can also be simulated quantitatively with a
numerical model (e.g., Verhamme et al., 2016). Satellite imaging indicates that blooms in the
last four years have not reached the sizes of the 2011 or 2015 blooms, despite heavy spring
rains in 2019 (Figure 3). One hypothesis to explain this result, which is consistent with tributary
data, is that conditions were wet enough to prevent many fields from being planted or fertilized
in spring of 2019, reducing the phosphorus mass available for transport to the lake.
(2019)
Figure 3. Western Lake Erie algal bloom severity since 2002, including 2019 forecast (red box
with dots) and actual values (green bar farthest to the right). Source: NOAA, 2019.
Upper Maumee River Tributaries – Bean Creek and the St. Joseph River
The Michigan areas of the Upper Maumee Basin, including the St. Joseph River (Figure 4) and
Bean Creek (Figure 5), do not have specific target phosphorus load reductions under Annex 4
or the DAP. They were listed as priority watersheds, even though they likely contribute relatively
small TP and SRP loads, because they are part of the larger Maumee River Watershed, which
is the major source of phosphorus that drives WLEB HABs (Verhamme et al., 2016). However,
Michigan, Indiana, and Ohio have committed to increasing monitoring of the Maumee tributaries
under the Annex 4 process to better define their contributions. For example, Michigan has
collected multiple rounds of samples at up to 19 stations in the Upper Maumee River watershed
in 2016 through 2018. This kind of monitoring does not allow a high-resolution load to be
calculated but it does make it possible to determine relative loads from subwatersheds
(LimnoTech, in review). The Generally Accepted Agricultural and Management Practices
8|PageMichigan DAP Adaptive Management Plan Draft, v.6.3, 25 Feb 2020
(GAAMP) for Manure Management and Utilization was released in January 2019 by the State of
Michigan and is expected to have some impact on water quality in these areas, as well saw in
the River Raisin Watershed. In its 2019 draft CAFO permit, EGLE also proposed new limits on
livestock manure spreading (Long et al., 2019; LimnoTech, 2017; International Joint
Commission, 2018). Because of the substantial distance between Michigan’s Upper Maumee
River tributaries and Lake Erie, in-stream tributary loss of phosphorus between the Ohio state
line and the mouth of the river in Toledo would also be expected.
In Ohio, Tetra Tech (2018) prepared a technical report that linked Annex 4 targets to Total
Maximum Daily Loads (TMDLs) in the Maumee Watershed. The 2018 Ohio DAP stated that TP
was relatively high in the St. Joseph River mainstem, but low in the Silver Creek tributary. The
Bean Creek mainstem, which is the Ohio Tiffin River headwaters, had low TP, but certain parts
of Lime Creek and Silver Creek had the highest TP concentrations. Relationships between
water quality results and nearby land use characteristics are being explored to determine why
concentrations are greater in some locations than in others (LimnoTech, in review).
Figure 4. Upper Maumee Basin tributary watersheds -- St. Joseph River branches, and
monitoring station locations.
9|PageMichigan DAP Adaptive Management Plan Draft, v.6.3, 25 Feb 2020
Figure 5. Upper Maumee River tributaries -- Bean Creek, and monitoring station location.
River Raisin
The River Raisin Watershed is considered a high priority watershed for the State of Michigan
(Figure 6). River Raisin nutrient loads, which have Annex 4 TP targets but not SRP targets
(Table 1), are primarily from NPS, but also include some point sources, the largest of which is
the Monroe Wastewater Treatment Facility. While small relative to Maumee River loads, the
River Raisin inputs are locally important for HAB initiation and impacts to impaired Michigan
waters of Lake Erie. In November 2016, the former Michigan Department of Environmental
Quality (now EGLE) included the WLEB on the 2016 303(d), Impaired Waters list submitted to
the USEPA (State of Michigan, 2018). This impairment listing was based on repeated,
widespread and persistent cyanobacteria blooms along Michigan’s Lake Erie shoreline.
The conditions in Lake Erie are documented by monitoring data along Michigan’s shoreline and
through satellite imagery. The blooms in Michigan’s waters of the WLEB were determined to be
excessive/nuisance conditions indicating ecological imbalance in the vicinity of the mouth of the
River Raisin. Heidelberg University’s National Center for Water Quality Research has monitored
and analyzed River Raisin annual and spring TP loads and SRP loads since 1999. Analysis of
data from 2019 indicates that an apparent declining trend from 2008 to 2016 that was reported
in the 2018 DAP did not continue, while TP loads appear to have increased since then, or at
least returned to approximately the long-term average (Figure 7). The drop in Conservation
Reserve Program (CRP) and Conservation Reserve Enhancement Program (CREP) acreage
(Stubbs, 2019) that occurred from 2013 through 2016 (Figure 8), due to reduced funding and
10 | P a g eMichigan DAP Adaptive Management Plan Draft, v.6.3, 25 Feb 2020
other factors, may have contributed to these results (Stubbs, 2019). More rigorous analysis of
other contributing factors, such as increased flows over this interval, would also need to be
conducted to draw any definitive conclusions (Choquette et al., 2019).
Figure 6. River Raisin Watershed map showing HUC-12 subwatersheds, monitoring location
(USGS station), and Monroe WWTF location.
11 | P a g eMichigan DAP Adaptive Management Plan Draft, v.6.3, 25 Feb 2020
Figure 7. River Raisin annual (left) and spring (right) flow (top), TP loads (middle), and SRP
loads (bottom). Note the steady to slightly increasing trend over the last 20 years in both annual
loads and spring loads. Green 40% goal lines for TP in metric tons (MT) are from the 2018 DAP.
12 | P a g eMichigan DAP Adaptive Management Plan Draft, v.6.3, 25 Feb 2020
Figure 8. Acreage in the CRP and CREP programs in River Raisin counties declined from 2013-
2017, which may have contributed to the recent increase in annual and spring TP loads shown
in Figure 7 above due to expected increased runoff from cultivation of former CRP and CREP
fields.
Central Lake Erie Basin
Due to its depth, stratification, and annual deposition of phytoplankton biomass that consumes
oxygen as it decays, the Central Basin of Lake Erie is subject to seasonal hypoxia (i.e., oxygen
depletion) that typically reaches its greatest extent in late summer or early fall (Rowe et al.,
2019). Algal biomass driving hypoxia comes from spring diatom blooms in the Western and
Central Basins, which are driven to a greater extent by nutrient loading from the Detroit River
than are Western Basin HABs (Rucinski et al., 2016), as well as from more localized loading
from Central Basin tributaries and greenhouse effluent in the Leamington region of southern
Ontario (Maguire et al., 2018).
Sediment oxygen demand and meteorological conditions that influence stratification are also
important. Benthic organisms are eliminated by hypoxia in the summer, and fish feeding and
spawning are likely restricted. Biological impacts of hypoxia is a topic of active research (Stone
et al., in press). The primary human impacts are on drinking water quality in Cleveland and
other cities that draw drinking water from the Central Basin due to upwelling of low-oxygen
water into intakes (Rowe et al., 2019). Because hypoxia is not detectable from satellites, the
spatial and historical coverage of data on hypoxia extent and duration in the basin is much more
limited than that of HABs data, although hypoxia has been studied more intensively than it had
been previously beginning in approximately 2014.
Hypoxia forecasting models have become increasingly sophisticated (Rowe et al., 2019;
Figure 9). Highly resolved annual delineations of hypoxic area or volume are not available.
Research is needed on ways to detect changes in Central Basin hypoxia over time in response
to nutrient loading reductions, as distinct from other factors such as variable weather conditions.
A conceptual model diagram of the Central Basin is shown in Appendix B. Rowe et al. (2019)
suggested that there is some evidence of greater oxygen demand on the western end of the
13 | P a g eMichigan DAP Adaptive Management Plan Draft, v.6.3, 25 Feb 2020
Central Basin than on the eastern end, which could be linked to its proximity to the highly
productive WLEB. More research and assessment through the Annex 4 process will help
address knowledge gaps for the Central Basin.
Figure 9. Top panel: Lake Erie average summer circulation (top panel, large arrows) showing
transport of Detroit River discharge to Central Basin in lower left of panel (Beletsky et al., 1999).
Bottom panel: Numerical model simulation of the low-oxygen area of central Lake Erie for 18
September 2018: https://noaaglerl.blog/tag/hypoxia/ . See Rowe et al. (2019) for more details on
the model. Colored circles indicate locations of monitoring data, for comparison with model
output. A conceptual diagram of Central Basin processes is included in Appendix B.
Detroit River
Low-concentration high-volume nutrient loads from the Detroit River flow along the north side of
the WLEB, and eventually to the Central Basin. These nutrients drive production of biomass that
sinks to the bottom of the Central Basin and drives hypoxia as it decays (Figure 9, Appendix B).
These loads originate from a complex set of binational sources (Appendix B). U.S. nutrient
sources may include the Michigan waters of Lake Huron, as well as point and nonpoint sources
between Port Huron and the mouth of the Detroit River. Canadian sources include the southeast
14 | P a g eMichigan DAP Adaptive Management Plan Draft, v.6.3, 25 Feb 2020
shore of Lake Huron in Ontario waters, the agricultural watersheds that discharge to Lake St.
Clair (i.e., Sydenham River and Thames River), and point sources from Sarnia to Windsor.
Several recent research reports and papers have been published on loading and nutrient
cycling in parts of this system, along with management implications (Maccoux et al., 2016;
Bocaniov and Scavia, 2018; Burniston et al., 2018). For example, recent research from the
University of Michigan Water Center indicates that over 50 percent of the phosphorus load
coming from the Detroit River may originate from Lake Huron (Scavia et al., 2019a and 2019b).
The State of Michigan commitments in the 2018 DAP for nutrient loading reductions in the
Detroit River were focused on point source load reductions, under the National Pollution
Discharge Elimination System (NPDES) permit program, at three sites: the GLWA Wastewater
Resource Recovery Facility (WRRF) in Detroit, the Wayne County Downriver Wastewater
Treatment Facility (DWTF), and Ypsilanti Community Utility Authority (YCUA) Wastewater
Treatment Plant that discharges to the Rouge River (a Detroit River tributary) (Figure 1). These
point sources were selected for inclusion in the DAP because they discharged over 90 percent
of the TP point source load from Michigan to the Detroit River and Lake Erie, and when permit
limits were met, would achieve Michigan’s goal for reducing nutrient impacts from point sources
that are affecting hypoxia in the Central Basin.
In addition to required wastewater NPDES permits, the facilities are required to have an NPDES
permit for the management of biosolids generated at the facility. The communities that these
facilities service are required to have Municipal Separate Storm Sewer System (MS4) NPDES
permits to reduce the discharge of pollutants in stormwater to surface waters of the state. An
MS4 is a system of drainage (e.g., roads, storm drains, pipes, and ditches) that is not a
combined sewer or part of a wastewater treatment plant. As of February 2020, the wastewater
treatment facilities and the communities they service are in compliance with their required
NPDES permits. Efforts are underway in all MS4 NPDES communities to reduce overall
stormwater discharges by implementation of green infrastructure projects and other actions that
decrease urban runoff and increasing infiltration and evaporation of precipitation.
15 | P a g eMichigan DAP Adaptive Management Plan Draft, v.6.3, 25 Feb 2020
Adaptive Management Approach
The 2018 DAP calls for the state to implement an “active” adaptive management approach at
two levels: the Michigan-specific level and the binational Lake Erie basin level, through the
GLWQA Annex 4 process. Michigan is following the adaptive management framework as
defined by the U.S. Department of the Interior (Williams et al., 2009). This involves “…exploring
alternative ways to meet management objectives, predicting the outcomes of alternatives based
on the current state of knowledge, implementing one or more of these alternatives, monitoring to
learn about the impacts of management actions, and then using the results to update
knowledge and adjust management actions.” This plan serves as a companion document to the
DAP.
It is an approach intended to achieve objectives in systems that are responsive to management
actions where there is uncertainty. It is useful in the management of natural systems because
the detailed workings of such systems may not be fully known, but many policy and program
alternatives exist. Efforts are underway to reduce nutrient loads to Lake Erie and address algae
blooms at the binational, federal, state, and provincial levels. Each water year (October through
September) that passes offers an opportunity to learn more about the Lake Erie system
response and to adjust actions if and where necessary.
This Adaptive Management Plan is considered a living document that describes how the state is
using information gained during implementation of the actions described in the 2018 Michigan
DAP to improve the effectiveness of future actions, including testing of hypotheses, establishing
desired monitoring outcomes, incorporating results of new research in order to accelerate
progress, enhancing coordination with partners, and leveraging resources to gain water quality
improvements in the system. Below is a diagram of the general steps in the adaptive
management cycle (Figure 10).
Figure 10. Adaptive management process diagram modified from the Michigan DAP (2018).
Source: National Academies Press; original figure adapted from a Department of Interior source
(see Williams et al., 2009).
16 | P a g eMichigan DAP Adaptive Management Plan Draft, v.6.3, 25 Feb 2020
DAP Adaptive Management Team Roles and Responsibilities
State of Michigan agencies, including EGLE, MDARD, and DNR play critical management and
technical roles in achieving Annex 4 goals, along with supporting internal policy development.
EGLE-Water Resources Division (WRD) has responsibility for permitting point sources and
monitoring tributary nutrient loads. MDARD oversees or facilitates agricultural conservation
programs that contribute to NPS nutrient load reductions under a variety of federal and state
programs, including MAEAP. The DNR monitors fish and wildlife habitats and populations in
Lake Erie and associated tributaries that may be impacted by excess nutrients. To be most
effective in the implementation of the Michigan DAP and the adaptive management framework,
it will be important to define roles and responsibilities and to develop a structured decision-
making process based on the six-core elements of the adaptive management cycle (Figure 11).
Figure 11. Proposed conceptual governance and support structure for Michigan DAP adaptive
management cycle. Note that components, roles, and commitments are currently under
development.
Stakeholder Roles and Responsibilities
Michigan’s state agencies cannot meet DAP goals and commitments alone. The state’s
Adaptive Management Team will form an external advisory group(s) to provide stakeholder
feedback and technical input throughout the adaptive management process, especially in
“evaluate” and “adjust” phases. Beyond the state agencies themselves, critical contributions
from others are necessary for DAP success (Figure 11):
• Governance, research coordination, and policy support: GLWQA Annex 4
Subcommittee, USEPA, GLWQA Great Lakes Executive Committee, Great Lakes
Commission, SEMCOG, Lake Erie Lakewide Action and Management Plan (LAMP)
Partnership Working Group, Lake Erie LAMP Management Committee, universities;
• Research, monitoring, modeling, data management, technical review, and technology
transfer: universities, National Oceanic and Atmospheric Administration (NOAA), USGS,
U.S. Fish and Wildlife Service, USEPA, MSU Extension, Heidelberg University’s
17 | P a g eMichigan DAP Adaptive Management Plan Draft, v.6.3, 25 Feb 2020
National Center for Water Quality Research;
• Internal and external advisory groups: State Adaptive Management Team, Nutrient Run-
Off and Algal Blooms Workgroup, MAEAP Advisory Council, MAEAP Communications
Work Group, MICLEAR Partnership, Annex 4 Adaptive Management Task Team, Lake
Erie/St. Clair Citizens Fishery Advisory Committee; and
• Accountability and public engagement: general public, farmers, external stakeholder
groups, urban and rural communities supporting wastewater treatment plants that are
named in the DAP, and representatives of other impacted groups.
One critical component of success will be sustained funding within state agencies and external
financial and technical support for partners doing planning and implementation on the ground
throughout the entire adaptive management process. An influence diagram that shows linkages
between the natural and human systems that control and influence conditions in Lake Erie,
including State of Michigan programs and stakeholder activities, is shown in Figure 12, and
described in more detail in Appendix D.
Figure 12. River Raisin and Maumee tributaries conceptual diagram of the NPS phenomena
and processes that influence nutrient loading from Michigan to Lake Erie. Nutrient movement
(light green) is from fields to waterways to the lake (bottom to top). State management programs
and options are shown in blue boxes (lower right), and external drivers are shown in orange
boxes (lower left). Additional notes on this figure are contained in Appendix D. Acronyms are
listed in Appendix E.
18 | P a g eMichigan DAP Adaptive Management Plan Draft, v.6.3, 25 Feb 2020
Addressing Uncertainties and Developing Hypotheses
Uncertainties are defined as gaps in our knowledge and will always exist in the natural resource
management context. Given the complexity of the WLEB watershed and in-lake water quality
dynamics, there are believed to be multiple sources of uncertainty that apply to an adaptive
management process of this magnitude. The MDARD, EGLE, and DNR staff, as part of the
state’s adaptive management team, will use expert judgement and seek additional expertise
when necessary to identify and reduce uncertainties over time. The agencies will also seek to
estimate and communicate the degree of uncertainty when sharing forecasts and projections
about the impacts of management actions. Building from the influence diagram workshop and
the review of the conceptual models for Lake Erie, the adaptive management team will be able
to better categorize uncertainties (e.g., effectiveness, costs, relationships) and use the
information to prepare working hypotheses related to selected projects and programs, and/or
management actions (Appendix A).
New publications are expected soon on whole-lake biogeochemical modeling of Lake Erie,
Central Basin Hypoxia, Maumee Basin watershed modeling, HAB toxin production drivers, and
investigations of Lake Huron loads to Lake Erie. As noted in the DAP, additional factors beyond
nutrient loading from Michigan watersheds and point sources influence Lake Erie water quality
and biological conditions. Therefore, it will be important to distinguish the strength of the full set
of drivers to determine whether impacts of implementation of BMPs in Michigan would be
expected to be distinguishable in Lake Erie ecosystem responses.
Performance Measures and Benchmarks
Setting goals and measuring progress toward goals relative to benchmarks is a critical
component of adaptive management. The ability to track implementation of management
actions and link them to associated positive impacts within an adaptive management framework
will make it possible to make informed and timely adjustments to strategic approaches moving
forward. Much progress has been made in meeting nutrient reduction goals with the aim of
improving Lake Erie water quality and ecosystems, but much work remains. The agencies are
relying on voluntary support and input from many others to adapt to changing conditions,
unexpected results, findings of new research, and taking advantage of new opportunities that
arise as we seek to improve the state of Lake Erie’s ecosystems. The State of Michigan is
committed to working effectively across agencies and with partners to achieve program goals.
The state will continue to work through the GLWQA Annex 4 process to understand how best to
measure progress in areas where there are no SRP targets set (i.e., Bean Creek and the St.
Joseph River). Watershed management planning efforts include important performance
measures and benchmarks that can be used to track progress at the watershed level. In
addition to the high-level goals and targets already established at the binational, federal, state
and watershed scales, it will be necessary to develop NPS measures and benchmarks at finer
scales, such as hydrologic unit code 12 (HUC-12) or smaller subwatersheds, in order to link
monitoring results closely with field scale management practices and watershed management
planning and implementation efforts. Agricultural inventory projects that are currently underway
in the WLEB, along with analysis of monitoring results, which will help inform this process of
establishing the appropriate indicators with performance measures and benchmarks, as well as
inform the BMP selection and implementation process.
19 | P a g eMichigan DAP Adaptive Management Plan Draft, v.6.3, 25 Feb 2020
Examples of metrics that exist or could be developed as part of the adaptive management
process include (see Appendix A):
• Point Source:
--Maintain discharge limit compliance at four DAP WWTPs
--Maintain compliance with biosolids NPDES permits
--Maintain compliance with MS4 NPDES permits
• NPS:
--Track MAEAP nutrient management plan status and projected increase
--Track new drainage water management control structures and acreage
--Track participation in MAEAP and environmental gains on verified/non-verified farms
• Other: Develop social-based metrics of public and farmer perceptions
In addition to items contained in Appendix A, any additional specific performance measures and
programmatic goals and timelines for implementation of BMPs to reduce NPS loads will be
incorporated into the two-year work plans described below. Work plans with more detailed
performance measures that will lead to 40 percent phosphorus reduction goals will be
developed in 2020-2021 under this adaptive management framework, in close collaboration with
the adaptive management advisory group(s) that will be created in the near future.
Program Tactics and Selected Management Actions
Within the context of the adaptive management framework, there are agencies and
stakeholders that have some degree of decision-making authority. During the development of
the plan, the 2018 DAP Task Table was reviewed and updated (Appendix A). Some program
tactics are longer term. For example, ongoing point-source management activities include
implementation of NPDES permit requirements and Long-Term Control Plan Program (LTCP)
elements to address combined sewer overflows (CSOs). Nonpoint source focus areas are
watersheds that need 319-approved watershed management plans, nutrient management plans
at the farm scale, improved manure management, increased creation of riparian buffers,
expansion of cover crop planting, reversal of declining CRP/CREP acreage, and increasing
MAEAP enrollment.
More targeted implementation of NPS activities to increase impact will be possible at the
subwatershed scale (HUC-12 or smaller) as agricultural inventories at the HUC-12
subwatershed level are completed and/or updated, but mechanisms to take advantage of this
resource-intense process will need to be developed. Incorporation of innovative tile drainage
management or treatment systems will be reviewed in the future to determine their relative cost
and effectiveness. For example, the effectiveness of phosphorus-optimal wetlands that are
being installed in Ohio is being looked at as a possible model for Michigan. The DNR is actively
pursuing the creation of a wetland mitigation bank in the WLEB as a pilot project to address
nutrients. Appendix A provides a list of the ongoing programs, projects and other tasks being
planned and implemented.
Monitoring, Research, and Evaluation Approach
Monitoring, including biological monitoring of fish and other aquatic organisms that integrate
river and lake water quality conditions, is a critical component of the adaptive management
process because data generated can be used as a means to assess progress toward selected
objectives and targets. Beyond in-state programs, the State of Michigan will need to work
through the Annex 4 process to develop the binational operational monitoring and modeling
20 | P a g eMichigan DAP Adaptive Management Plan Draft, v.6.3, 25 Feb 2020
infrastructure and resources to support ongoing evaluation of changing watershed conditions
and Lake Erie responses to nutrient reduction investments. This will be a critical component of
assessing progress toward achieving the GLWQA nutrient reduction targets and Lake Erie
ecosystem restoration goals.
Monitoring should be sensitive enough to detect change. For example, initial results of finer
spatial scale water quality monitoring (e.g., LimnoTech, in review), which has been conducted in
recent years in the River Raisin and Maumee tributaries, indicate that there is a need for greater
temporal resolution in some locations to capture loading from the spring freshet and storm
events. This could be accomplished by installing continuous nutrient measurement devices,
water quality sondes, or cost-effective water quality sensors that can measure proxies for
nutrients. A further result is that sampling locations can be refined based on initial results to
focus outreach in HUC-12 subwatersheds with the greatest apparent loads. Another important
component of effectively using monitoring data for adaptive management is integrating data sets
across locations and data types (e.g., water chemistry, BMP implementation, stream and lake
biology) through modeling and other synthesis approaches to extract the greatest amount of
information and value from these data sets.
Additional research to scale edge-of-field results (Daniels et al., 2018) to subwatershed and
watershed scales (Bosch et al., 2011), including results of runoff measurements and tile drain
measurements, would also be useful. Finally, research to more closely link best management
practices (BMPs) to their impacts in the particular watersheds of interest here would be
valuable. For example, HUC-12 agriculture inventories are being completed in the Bean Creek
Watershed at the field scale. This detailed information is being used to strengthen a watershed
model that can be used to help optimize BMP placement and impact. MDARD and EGLE are
collaborating with Michigan State University (MSU) to conduct a five-year research project in the
River Raisin watershed monitoring drainage water management effectiveness in reducing
nutrient loads from farmland with tile drainage systems.
Michigan agency staff participate actively in research communities related to Lake Erie issues
including the HABs Collaborative and the Invasive Mussel Collaborative. Staff also interact with
NOAA’s multi-university Cooperative Institute for Great Lakes Research, which is coordinated
by the University of Michigan. Michigan staff share information with local advisory groups
including the WLEB Team (i.e., conservation districts, MAEAP technicians, NRCS staff, and
River Raisin Watershed Council), the Michigan Cleaner Lake Erie through Action and Research
(MICLEAR) Partnership, farmer-led conservation groups, and other agricultural partners.
Mechanisms for Incorporating Learning into Future Decisions
Formalizing a structured adaptive management framework and process, including stabilizing
funding and management of technical (e.g., monitoring, modeling, and research) and internal
and external policy efforts, and outreach and engagement with technical and stakeholder
advisory groups will provide the structure and information to allow learning to take place. True
learning will require transparency, rigor, and timely analysis by state agencies and their
technical support teams, as well as careful tracking of hypotheses, management alternatives,
and uncertainty. Plans for oversight by an external stakeholder advisory group are in
development to assure accountability and consideration of important external viewpoints in
agency analysis and resulting decisions. The adaptive management process being developed
by the State of Michigan is also nested within the larger adaptive management activities of the
21 | P a g eMichigan DAP Adaptive Management Plan Draft, v.6.3, 25 Feb 2020
GLWQA Annex 4 group including other states, U.S. federal agencies, and Canadian
representatives.
Schedule and Reporting Progress
Overlapping two-year work plans, along with annual reporting and DAP updates every five years
will support the commitment, assessment, and communication objectives of the adaptive
process (Table 2). Work plans will be developed from the existing expanded task table
(Appendix A) to capture the commitments of responsible parties. These will help with aligning
resources with needs. A regular and predictable reporting cycle, with feedback built in, will give
stakeholders confidence in the process and will let collaborators in other states, in Canada, and
in federal agencies know when they can expect to hear about progress, lessons learned, and
new research results that could benefit their own jurisdictions and missions. A progress update
on DAP activities was released by EGLE on January 22, 2019, and the DAP website is regularly
updated.
Table 2. DAP and Adaptive Management Reporting Timeline.
2018 2019 2020 2021 2022 2023 2024 2025
DAP DAP/AM DAP/AM DAP/AM DAP/AM
MI DAP DAP
Progress Progress Progress Progress Progress
Developed Update
Update Update Update Update Update
Taking DAP DAP DAP DAP
Action Lake Progress Progress Progress Progress
Erie Website Update Update Update Update
Adaptive
Mgmt. Plan
Developed
Two-Year
Work Plan*
Two-Year
Work Plan*
Two-Year
Work Plan*
Two-Year
Work Plan*
Two-Year
Work Plan*
*Two-year work plans will be revised each year, as the second year will contain projections.
Outreach and Engagement
Public understanding of the importance of Lake Erie’s issues and the actions that are being
taken to improve conditions in the lake is a critical component of a successful program. Public
perception, including by the particular wastewater treatment plant communities and agricultural
producers in the watersheds that have been prioritized in the DAP, ranges from highly engaged
and well-informed, to disengaged or even skeptical. For example, recent survey research by
Wilson et al. (2018) found that willingness of farmers to adopt BMP practices was highly
dependent on two factors: 1) the confidence of farmers in their ability to implement practices,
and 2) the degree of farmer's belief in the effectiveness of the practices at reducing nutrient loss
and improving local water quality. Both of these issues can be addressed by more effective
outreach, including more and better training, and improved communication of research results
concerning the impacts of particular practices on water quality. Social metrics to track public
perception could be developed and used in the adaptive management process.
22 | P a g eYou can also read