Metrology applied to Human Ecology: critical analysis of geospatial data for regionalization of Brazilian Anthromes
←
→
Page content transcription
If your browser does not render page correctly, please read the page content below
Metrology applied to Human Ecology: critical analysis of
geospatial data for regionalization of Brazilian Anthromes
Maximiliano Soares Lemos Araujo Gobbo ( maxgobbo91@gmail.com )
Instituto Nacional de Metrologia Qualidade e Tecnologia https://orcid.org/0000-0002-4668-2364
Thiago de Oliveira Araujo
Instituto Nacional de Metrologia Qualidade e Tecnologia
Claudia de Oliveira Faria Salema
Instituto Nacional de Metrologia Qualidade e Tecnologia
Research Article
Keywords: metrology, socio-ecological system, critical analysis, anthromes, ISO/IEC 17025, land use planning
Posted Date: September 24th, 2021
DOI: https://doi.org/10.21203/rs.3.rs-833533/v1
License: This work is licensed under a Creative Commons Attribution 4.0 International License. Read Full License
Page 1/39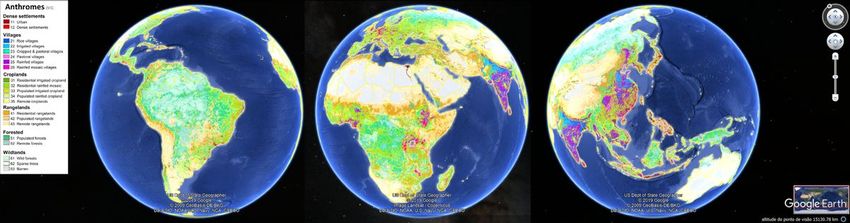
Abstract
Establishing territorial planning tools that meet the precepts of sustainable development is always challenging. In this sense,
anthromes emerge as a differential mechanism. Its structure considers population and environmental parameters, which
optimizes the recognition of areas of interest in the territory. However, it is necessary to consider regional aspects, approaching
the input data in the cluster analysis. Assuming this, data on population density and land use and cover of National Spatial
Data Infrastructure (INDE – Brazil) were analyzed as a source for regionalization. Therefore, an analytical system based on the
ISO/IEC 17025 standard was proposed. Globally, this standard is used to guarantee the quality of results through the
metrological pillars. Thus, the validation parameters were used to assess the adequacy of the methods to the intended uses
and the ability to bring the data closer to the local reality. The tools to guarantee the validity of internal results guided the
verification of the quality of treatments performed on the results generated by the methods. The results show that the methods
meet their respective scopes, framing the geospatial information investigated in the acceptance profile required for the
regionalization of Brazilian anthromes. Furthermore, they bring the information closer to the local reality and characterize
important natural features. In this way, the quality of the geospatial data indexed in the INDE to be applied in the cluster
analysis was guaranteed. Furthermore, a resource that collaborates in the critical analysis of the results and in the evaluation of
environmental and anthropic methods was presented.
Introduction
In a constantly changing world, ecosystem changes are increasingly present (Ellis, 2015; Ellis et al., 2010; Morrison et al., 2021;
Mottl et al., 2021; Nowosad et al., 2019). Globally, government entities, non-governmental organizations, research groups and
academic centers are dedicated to understanding how ecosystem changes affect the climate, environment, and geology of the
planet in the Anthropocene (Brondizio et al., 2016; Crona et al., 2021; Delanty, 2018; Keck, 2021; Louro et al., 2021; Rockström et
al., 2009; Ryder et al., 2021). In this context, it is imperative to plan, systematize and adapt the use of spaces and natural
resources to ensure a healthy environment for present and future generations (Loft et al., 2017; Loiseau et al., 2021; Magliocca
et al., 2015; Matthews, 2021; Mbaru et al., 2021; Parreira et al., 2019; Picuno et al., 2019; Somorin et al., 2014), as advocated by
the Sustainable Development Goals (UN, 2015).
Entering the ecosystem sustainability framework, the literature suggests that socio-ecological models (Balvanera et al., 2017;
Costanza & Kubiszewski, 2012; Danielsen et al., 2021; Martínez et al., 2013) significantly collaborate to maintain planetary
resilience and of life on Earth (Bagstad et al., 2013a; Burkhard et al., 2012; Groot et al., 2010; Haines-Young et al., 2012; Maes et
al., 2012). Through them, the relationship established between humanity and the environment is better understood. In addition,
they can assist in the development of public policies for spatial planning and planning at the national level (Bagstad et al.,
2013b; Battiston et al., 2021; Costenbader, 2011; O'Connor et al., 2021; Petrescu et al., 2021).
Anthromes (Ellis & Ramankutty, 2008), subdivisions of terrestrial biomes based on the interpolation between man and the
environment, emerge as a tool that can contribute to this scope. The modeling of this system is done by associating
information on population density and land use and land cover (Ellis, 2015; Ellis et al., 2012). Data are transformed into
numerical values, statistically treated, and applied to correlation analysis (Alessa & Chapin, 2008; Ellis, 2013b; Ellis &
Ramankutty, 2008). This mathematical resource aggregates the data, considering its coverage area and the respective
geolocations (Ellis, 2011; Ellis et al., 2010).
In the mapping produced by Ellis and Ramankutty (2008) the data were captured on global geospatial platforms. The generated
product portrays anthropogenic biomes on a global scale and can be viewed through Google LCC's Earth platform. after
downloading the plug-in available to the user (http://www.ecotope.org/anthromes/maps/). On a global scale, this technological
resource makes it possible to understand the relationships between population and environment in each of the classified
anthropogenic biomes (Ellis, 2015; Jia et al., 2019; Nowosad et al., 2019). It also allows its application at the regional level
(countries and continents) as a mechanism for the management of natural resources and for the development of public and
environmental policies (De Keersmaeker et al., 2014; Picuno et al., 2019) (Fig. 1).
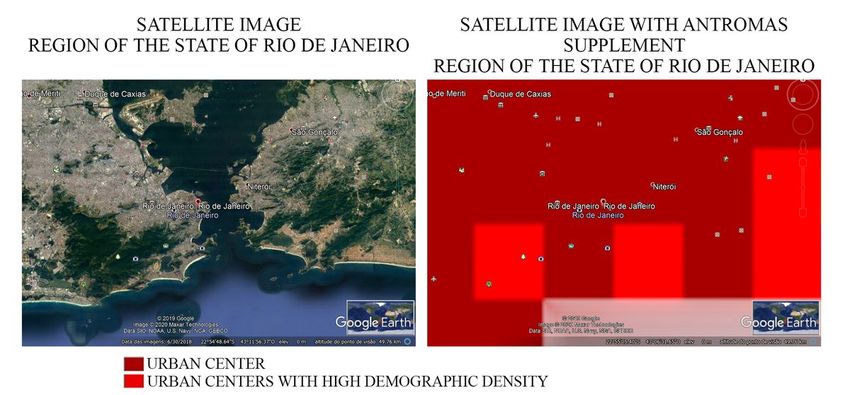
Page 2/39However, viewing details at a local scale (municipalities and states) points to the limitation of the product (Fig. 2). In polygons
of smaller areas there are discrepancies between the real information and the information presented in the mapping. One of the
reasons that lead to this deviation is found in the large areas represented by data from global platforms, which makes detailing
into smaller areas unfeasible and consequently impairs the mapping of anthromes (De Keersmaeker et al., 2014; Loiseau et al.,
2021; Pedersen et al., 2021; Saah et al., 2020).
The literature points out that national databases can provide more consistent sources of geographic information for mapping
anthromes (Danielsen et al., 2021; Junior, 2021; Li et al., 2016; Picuno et al., 2019). These platforms have a greater number of
data for smaller areas, which enables greater detailing of the investigated sectors (Chuai & Feng, 2019; Massetti & Gil, 2020;
Parente et al., 2019; Winkler et al., 2021; Zheng et al., 2014). Consequently, by applying these data in the correlation analysis, it
would be possible to increase the detail of the mapping of Brazilian anthropogenic biomes (Dandois et al., 2017; Dandois et al.,
2015b; Ellis, 2014b; Magliocca et al., 2015 ; Margulies et al., 2016; Morrison et al., 2021), including data that consider the
natural features of the country (Dandois & Ellis, 2013; Dandois et al., 2015a; Fuentealba et al., 2021; Magliocca & Ellis, 2013;
Zahawi et al., 2015) to collaborate with the development of spatial planning and planning policies.
When it comes to regional bases for providing geographic information closer to the local reality, Brazil has the National Spatial
Data Infrastructure (INDE) (BRASIL, 2008). Its creation aims to harmonize national geographic information structures with other
Spatial Data Infrastructures (IDEs) around the globe (CINDE, 2010). One of the central objectives is the comparability of results
between national IDEs, to create a global scheme for decision-making and to produce more assertive public policies (IBGE,
2019). It is also noted that the IDEs intend to generate traceability to geographic information and give reliability to the data
reported therein (CINDE, 2010; CONCAR, 2017).
An important resource regarding the structure of the INDE is the methodological standardization to produce geographic
information (CINDE, 2010). Standard methods, or official methods, were conceived by institutions that legally produce
geospatial data (official INDE actors) and are adopted to systematize the production of results in the country (BRASIL, 2008;
IBGE, 2019). Another tool presented by the INDE structure is the Metadata Profile (CONCAR, 2017), based on the ISO 19115
Standard (ISO, 2003), where the minimum data requirements for indexing in the INDE platform are pointed out. Metadata
provide information about the method, the producers, the treatments performed on the data and additional information that
support the results (CONCAR, 2017; ISO, 2003). This unique presentation scheme allows the comparison of data between
nations (Magliocca et al., 2014; Steffen et al., 2015) and enables critical analysis (Goldbergs et al., 2018; Ryder et al., 2021) of
the results based on metrological tools (BIPM, 2017).
In this context, Metrology adds to Human Ecology by presenting tools that support the quality assurance of results (Brondizio et
al., 2016; Steffen et al., 2015), either to assess reliability geospatial information through structures that attest to the operability
of the methods and the results they generate (Mahmoud et al., 2021; Mittaz et al., 2019), or to propose schemes for data
comparability and traceability through associated characteristics the measurement or estimation performed (BIPM, 2017;
Fermam, 2012; Sené et al., 2017). In general terms, the ISO/IEC 17025(ISO, 2017) standard designates two metrological
resources that contribute to this scope. Method validation parameters (item 7.2.2) can help demonstrate the suitability for the
intended use of standard methods in measuring or estimating geographic information (De Bievre et al., 1998; Macarthur & von
Holst, 2012; Magnusson, 2014; Thompson et al., 2002), as population density and land use and cover. Moreover, the tools to
guarantee the validity of internal results (item 7.7.1.) provide resources for critical analysis of the results (ISO, 2015b, 2015c,
2016, 2019), helping in the evaluation and evidence of the resources used before, during and after the production of results
(Bagstad et al., 2013b; Balvanera et al., 2017; IPCC, 2014, 2018; Maestripieri et al., 2017; Mas et al., 2012).
The evaluation of the methods and results they generate through these metrological tools can help to reduce distortions
between the real image and the mapped image (Burkhard et al., 2012; DeFries et al., 2012; Goldbergs et al., 2018; Pouliot et al.,
2014). By analyzing the methods considering the validation parameters, it is possible to identify whether the methods can
reduce the areas of representation (Chuai & Feng, 2019; Jia et al., 2019; Parente et al., 2019), to generate better visualization of
details in the terrain. It is imperative that the methods of population density and land use and cover represent smaller areas of
polygons (Didoné et al., 2017; Leinenkugel et al., 2013; Olsson et al., 2019), for that the correlation analysis generates a more
Page 3/39accurate mapping of the anthromes (Ellis, 2015; Ellis & Ramankutty, 2008; Magliocca & Ellis, 2013). On that account, by
demonstrating that the standard methods of INDE (CINDE, 2010) can improve the baseline information applied in the
correlation analysis (Erb et al., 2017; Haines-Young et al., 2012; Wang & Han, 2019), it would be possible to regionalize Brazilian
anthromes to adopt them as a tool for spatial planning at a local scale (city/state) (Magliocca et al., 2015; Margulies et al.,
2016).
Even, the literature points out that the uncertainty of geospatial data applied in the cluster analysis must be addressed (Costa,
2017; Freire & Castro, 2014). Therefore, the tools to guarantee the validity of internal results (ISO, 2017) help to identify the
treatments performed, inferring the efficiency of these treatments, and pointing to mechanisms that help to guarantee the
quality of the information to be used in the cluster analysis (Blundo et al., 2021; Loiseau et al., 2021; van Wilgen, 2021). In
addition, these tools help identify reliability mechanisms as imperative to increase the quality of mapped information (Brewer et
al., 2019; Mahmoud et al., 2021; Sené et al., 2017).
Therefore, this study verified the presence of method validation parameters and tools to ensure the validity of internal results
(ISO, 2017) in the standard methods of the INDE and in the results generated by them (CINDE, 2010; BRAZIL, 2008; CONCAR,
2017). The objective was to correlate these two metrological tools (ISO, 2017) to methods of population density (IBGE, 2010,
2013b, 2018b) and land use and cover (IBGE, 2013a, 2017, 2018a, 2020a), in a way to establish a critical analysis scheme to
ensure the quality of results on the national platform (IBGE, 2019b). By establishing this scheme, it is expected to contribute
with other users of geospatial data, indicating to a guideline for a better understanding of the methods and results generated by
them. In addition, it was verified through this systematic if the methods can improve the resolution of geographic information
(Araujo et al., 2017), to adjust the mapping of anthromes to the local reality. It is indicated that this research recommends the
application of data from the INDE platform in the analysis of cluster for the regionalization of Brazilian anthromes as a
resource for land use planning and planning.
Methodology
The starting point for the regionalization of Brazilian anthromes is the National Spatial Data Infrastructure (INDE). In the
document "INDE Implementation Plan" (CINDE, 2010), the Brazilian Institute of Geography and Statistics (IBGE) is described as
the actor responsible for the production and management of data on population density (IBGE, 2013b) and land cover and use
(IBGE, 2013a). Based on this, all documents dealing with the two methods were listed: manuals and technical reports, data and
metadata, mappings and tables. Table 1 describes all the investigated documents, divided between methods and results.
Page 4/39Table 1
Investigated documents.
Methods and Documents
Results
Demographic • INSTITUTO BRASILEIRO DE GEOGRAFIA E ESTATÍSTICA (IBGE); Manuais técnicos em Geociências
Census número 14: acesso e uso de dados geoespaciais. Rio de Janeiro, IBGE, 143 p., 2019.
(method)
• INSTITUTO BRASILEIRO DE GEOGRAFIA E ESTATÍSTICA (IBGE); Metodologia do censo demográfico
2010. IBGE, Rio de Janeiro, 712p., 2013.
• INSTITUTO BRASILEIRO DE GEOGRAFIA E ESTATÍSTICA; Estimativas da População Residente para os
Municípios e para as Unidades da Federação Brasileiros com Data de Referência em 1º de julho de 2019.
Ministério da Economia e Instituto Brasileiro de Geografia e Estatística (IBGE), 2019.
Demographic • http://www.metadados.geo.ibge.gov.br/geonetwork_ibge/srv/por/main.home
Census
(results) • https://sidra.ibge.gov.br/tabela/1298
• https://sidra.ibge.gov.br/tabela/1288
• https://sidra.ibge.gov.br/tabela/608
• https://sidra.ibge.gov.br/tabela/1286
• https://sidra.ibge.gov.br/tabela/1294
• https://sidra.ibge.gov.br/tabela/1309
• https://sidra.ibge.gov.br/tabela/3107
• https://sidra.ibge.gov.br/tabela/1301
Land Use • COMISSÃO NACIONAL DE CARTOGRAFIA (CONCAR); Norma Cartográfica Brasileira: Especificações
and Cover Técnicas para Estruturação de Dados Geoespaciais Vetoriais (ET-EDGV 3.0). Ministério do Planejamento,
(methods) Desenvolvimento e Gestão/CONCAR, Brasília, 43p., 2017.
• IBGE. Manuais técnicos em Geociências número 14: acesso e uso de dados geoespaciais. Rio de Janeiro,
IBGE, 143 p., 2019.
• INSTITUTO BRASILEIRO DE GEOGRAFIA E ESTATÍSTICA (IBGE); Avaliação da qualidade de dados
geoespaciais: manual técnico em Geociências n° 13. IBGE, Rio de Janeiro, 2ª ed., 117p., 2019.
• INSTITUTO BRASILEIRO DE GEOGRAFIA E ESTATÍSTICA (IBGE); Manuais Técnicos em Geociência (n. 7):
manual técnico de uso da terra. IBGE, Rio de Janeiro, 3ª ed., 171 p., 2013.
• INSTITUTO BRASILEIRO DE GEOGRAFIA E ESTATÍSTICA (IBGE); Manuais Técnicos em Geociências (n.1):
manual técnico da vegetação brasileira. IBGE, Rio de Janeiro, 2ª ed., 271 p., 2012.
• INSTITUTO BRASILEIRO DE GEOGRAFIA E ESTATÍSTICA (IBGE); Manuais Técnicos em Geociências
(n.12): manual de procedimentos técnicos para fiscalização, controle de qualidade e validação da base
cartográfica contínua na escala 1:250000. IBGE, Rio de Janeiro, 31 p., 2011.
• INSTITUTO BRASILEIRO DE GEOGRAFIA E ESTATÍSTICA (IBGE); Mapeamento de Uso e Cobertura da
Terra Utilizando dados numéricos do Censo Agropecuário 2006: nota técnica. IBGE, Rio de Janeiro, 4 p.,
2018.
• INSTITUTO BRASILEIRO DE GEOGRAFIA E ESTATÍSTICA (IBGE); Monitoramento da Cobertura e Uso da
Terra do Brasil 2000–2010 – 2012–2014 em grade territorial estatística. IBGE, Rio de Janeiro, 35p., 2017.
• INSTITUTO BRASILEIRO DE GEOGRAFIA E ESTATÍSTICA (IBGE); Monitoramento da Cobertura e Uso da
Terra do Brasil 2014–2016. IBGE, Rio de Janeiro, 32p., 2018.
• INSTITUTO BRASILEIRO DE GEOGRAFIA E ESTATÍSTICA (IBGE); Monitoramento da Cobertura e Uso da
Terra do Brasil 2016–2018. IBGE, Rio de Janeiro, 27p., 2020.
Source: the author.
Page 5/39Methods and Documents
Results
Land Use • https://www.ibge.gov.br/geociencias/informacoes-ambientais/cobertura-e-uso-da-terra.html
and Cover
(results) • http://www.metadados.inde.gov.br/geonetwork/srv/por/main.home
• http://mapasinterativos.ibge.gov.br/recortes/index.html
• http://mapasinterativos.ibge.gov.br/atlas_ge/brasil1por1.html
• https://bdiaweb.ibge.gov.br/#/home
• https://www.ibge.gov.br/apps/macrocaracterizacao/
• http://mapasinterativos.ibge.gov.br/monitoramento_uso/
• http://www.metadados.inde.gov.br/geonetwork/srv/por/main.home
• http://www.metadados.inde.gov.br/geonetwork/srv/por/metadata.show?id=75659&currTab=simple
• https://www.ibge.gov.br/geociencias/informacoes-ambientais/vegetacao/15842-biomas.html?=&t=o-
que-e
• http://metadados.geo.ibge.gov.br/geonetwork_ibge/srv/por/main.home
• https://www.ibge.gov.br/geociencias/informacoes-ambientais/cobertura-e-uso-da-terra/15833-uso-da-
terra.html?=&t=o-que-e
• https://www.ibge.gov.br/geociencias/informacoes-ambientais/vegetacao/24252-macrocaracterizacao-
dos-recursos-naturais-do-brasil.html?=&t=o-que-e
• https://www.ibge.gov.br/geociencias/informacoes-sobre-posicionamento-geodesico/servicos-para-
posicionamento-geodesico/16312-progrid.html?=&t=o-que-e
• https://www.ibge.gov.br/geociencias/informacoes-ambientais/vegetacao/22453-cartas-1-250-000.html?
=&t=acesso-ao-produto
• https://www.ibge.gov.br/geociencias/informacoes-ambientais/vegetacao/10872-vegetacao.html?=&t=o-
que-e
• https://www.ibge.gov.br/geociencias/informacoes-ambientais/vegetacao/22460-vegetacao-por-
estado.html?=&t=o-que-e
Source: the author.
After listing all documents, the metrological concepts present in the ISO/IEC 17025 (ISO, 2017) were transposed to adapt it to
the investigated methods. In general, this standard is used as a resource for evaluating the competence of calibration and
testing laboratories. Despite this designation, its scope concerns the evaluation of methods and the results they generate,
allowing its application in other areas of science. It is pointed to that the standard in question synthetically designates the
validation parameters of methods and the tools to guarantee the validity of internal results. Furthermore, it does not describe
direct application to the “population density” and “land use and cover” methods. Therefore, based on the literature, a correlation
was made between the metrological concepts of each of the method validation parameters and the tools to guarantee the
validity of results and the characteristics of the investigated methods. In Table 2 the correlations between the validation
parameters of methods and the two methods are presented, while in Table 3 the tools to guarantee the validity of internal
results are treated.
Page 6/39Table 2
Correlation between Metrological Concepts of Method Validation and Characteristics of Environmental and Anthropogenic
Methods.
Correlation between Metrological Concepts of Method Validation and Characteristics of Environmental and Anthropogenic
Methods.
Validation Metrological Definition of Correlation of the metrological Correlation of the metrological
Parameter the Validation Parameter concept with characteristics of the concept with characteristics of
demographic method "land use and cover" methods
Specificity Ability of the method to Specific characteristic of the Terrain-specific feature during
generate a signal only for population. image classification and
the product of interest. processing.
Selectivity Ability of the method to Different characteristics in the Characteristics that typify the
generate responses for investigated population that can different uses in the field during
different components of be individualized. image classification and
interest, but which are processing.
distinguishable from each
other.
Working Range Used to demonstrate that Ability of the method to produce Ability of the method to produce
the results produced by the geographic information within the geographic information within the
method are provided with standard of acceptance of results, standard of acceptance of results,
acceptable precision and which is established in synergy which is established in synergy
accuracy in the range in between the institution responsible between the institution responsible
which it is operated. for the standard method and the for the standard method and the
reference institutions. reference institutions.
Linearity Associated with the working Ability to describe trait(s) in Ability to describe terrain
range, it refers to the different population sizes. feature(s) in different sizes of
method's ability to produce areas.
linear responses within the
investigated operating
range.
Detection limit It refers to the smallest Minimum number of individuals to Area smaller than that which the
amount of information be censused to obtain information classification and processing
identified in a particular on the population, according to the method can distinguish,
investigated sector, but that area of operation. generating confusion in the
cannot be quantified for the classification produced.
acceptance standards
established for the
methods.
Quantification Less amount of information Minimum number of individuals Smaller area than the
Limit needed to identify a certain censused to obtain population classification and processing
characteristic in the information, with confidence method can operate and produce
investigated sector. established for the method. results in the acceptance range
proposed by the data producer.
Accuracy Ability of the method to Ability of the method to estimate a Delimitation of a certain land
(Recovery + produce results close to real given characteristic of the census use/cover against the true value of
Precision > values (true values). population against the real value the area.
Precision = of the characteristic.
Repeatability +
Intermediate
Precision +
Reproducibility)
Recovery Comparison of the average Comparison with other Use of standard classification
of the results generated by demographic operations, using images to analyze the method's
the method to a reference growth rates for estimation. ability to distinguish features in
value (trend analysis – terrains.
bias), normally carried out
by Certified Reference
Materials (CRMs).
Source: the author.
Page 7/39Correlation between Metrological Concepts of Method Validation and Characteristics of Environmental and Anthropogenic
Methods.
Repeatability Degree of agreement Sequential tests performed before Analysis of the same image over
between results obtained by the census operation. and over to verify that the
the same method in the processing and classification
same area, with a short software responds to the
space between minimum precision value
measurements/estimations, established for the procedure.
being performed by the
same operator.
Intermediate Degree of agreement Variation of census takers and the Analysis of orbital images
Precision between the results, varying census time interval as sources of captured throughout the year and
pre-established variation in the census method. the different imaging sources used
characteristics during the to calibrate the method.
information
measurement/estimation
process.
Reproducibility Degree of agreement Degree of agreement between the Degree of agreement between the
between results for the results obtained by the different classification carried out in the
same scope, varying census takers and in the different different areas investigated in the
operators, and census sectors, to cover the entire territory.
areas/sectors. population.
Adequacy to Possibility of establishing a Estimation model represents a Processing and classification
Mathematical mathematical model to mathematical model, which is method represents a
Models methods response. based on calculated population mathematical model, considering
growth rates. its response to different false-color
scales in bands 5R, 4G and 3B,
which are numerically expressed
in the analyses.
Source: the author.
Page 8/39Table 3
Correlation between Metrological Concepts of Tools to Guarantee the Validity of Internal Results and Characteristics of
Environmental and Anthropogenic Methods.
Correlation between Metrological Concepts of Tools to Guarantee the Validity of Internal Results and Characteristics of
Environmental and Anthropogenic Methods.
Tool to Metrological Correlation of the metrological Correlation of the metrological
Guarantee the definition of the Tool concept with characteristics of concept with characteristics of "land
Validity of for "demographic density" methods use and cover" methods
Internal Results
Guarantee of Validity
of Internal Results
Use of Use of established Use of population growth rates Use of standard images as a
reference standards for the calculated based on previous census resource to assess the quality of
materials or methods as a operations and which are used to processing and classification of
materials for resource to analyze assess the quality of results obtained orbital images, which resemble
quality control the quality of the in the present census operation. reference materials for quality
information produced. control.
Using Instruments used in Use of statistical resources to Use of other imaging sources to
alternative conjunction with estimate the population, as well as analyze the capacity of the
calibrated methods to generate other tools that help to compare classification software to operate
instrumentation traceable and national and international within the acceptance range
to provide comparable results demographic results. established in the method.
traceable with other institutions.
results
Functional Temporal analysis of Systems used in the census Resources for monitoring the
checks of the instruments used operation, enabling operators to processing and classification of land
measuring and in the methods, verify problems during the operation use and cover assist in checking the
testing evaluating their ability and analyze compliance with software throughout the entire
equipment to produce results acceptance standards. procedure.
within acceptance
standards.
Use of check Mechanisms used to Operation monitoring systems are Use of standard images in
patterns or check the instruments examples of checking patterns, processing software as an aid to
work patterns used by the methods, pointing out information through the product quality control. Use of
with control as well as the results census indicators and about the standardization in the reporting of
charts, when they produce. census process. generated results, serving as a
applicable control chart for the generated
geographic information.
Intermediate This tool reflects Indicators as tools for the Evaluation of the classification of the
checks on actions taken during intermediate checks of the census, as result to the minimum standard for
measuring the execution of the they are intricately linked to the acceptance of the generated
equipment methods, resulting in questionnaires applied in the census classification.
the minimum operation.
standard for
acceptance of the
result.
Replicated tests Tests performed on Tests performed prior to the Tests performed using standard
or calibrations, methods to produce application of the demographic images are resources that aid in the
using the same results and method are mechanisms to calibrate calibration of processing and
or different demonstrate the the method, to generate results that calibration, as the results must match
methods adequacy of the fall within the scope of the action. the stipulated acceptance level.
resources used to
generate them.
Retest or Carrying out actions Performing the reapplication of the Field validation or reclassification of
recalibration of to reassess the results questionnaire (sampling) in uses and cover performed.
retained items obtained by the households where the information
methods. was not properly collected or not
collected is a mechanism to retest
the retained item.
Source: the author.
Page 9/39Correlation between Metrological Concepts of Tools to Guarantee the Validity of Internal Results and Characteristics of
Environmental and Anthropogenic Methods.
Correlation of Interpolation of The questionnaires applied must Different terrain properties, which
Results from different have different characteristics on the lead to different classifications.
Different characteristics of the census population.
Characteristics same investigated
of an Item object.
Critical analysis Study performed on Evaluation of census indicators Used when rating in software through
of reported the results produced during operation. After the operation, acceptance level. After classification,
results by the methods, to the comparative analysis of the the field work intends to validate the
validate them or not. results obtained with those estimated results generated, enabling the
(which use the growth rates production of the field report.
calculated through other census
operations).
Intralaboratory Comparison of results In addition, comparison with data Comparison between different areas
Comparisons obtained by the result obtained from other census and their results, based on the
producer. operations. established acceptance level.
Testing of blind Tests performed Lack of knowledge of the population Lack of knowledge of land use and
sample(s) using unknown data. before the census to determine a cover in the orbital image applied in
given demographic characteristic. the processing and classification
software, given that no previous
treatment was applied to the images.
Source: the author.
After establishing this correlation, the documents listed in Table 1 were searched for notes or characteristics that would raise
the presence of these metrological tools in both methodological structures. In addition, the presence of ancillary resources that
also contributed to guarantee the quality of environmental and anthropic results was verified.
Results
First, it is not pointed out in the methodological framework of the standard methods of INDE for population density and land
use and cover (IBGE, 2013a, 2013b) direct employment of the ISO/IEC 17025 (ISO, 2017). However, in the structuring and
functioning of both methods, studies and verifications that are directly correlated to those proposed by the metrological tools
applied here are described. Therefore, the results presented are the result of the transposition of metrological concepts into the
methods of “demographic density” (IBGE, 2013b) and “land use and cover” (IBGE, 2013a) (Tables 2 and 3).
The survey carried out in the Technical Manuals and Reports (Table 1) enabled the identification of characteristics that describe
the presence of the validation parameters (7.2.2.) (ISO), 2017) in both methods. Table 4 summarizes the parameters that were
found in the methodological structures.
Page 10/39Table 4
Verification of the presence of the method validation parameters (7.2.2.)74 in the technical manuals of
the methods of land use and cover105 and demographic density101 of INDE.
Verification of the presence of the method validation parameters (7.2.2.)74
Validation parameters Method: Land Use and Cover Method: Demographic Census
Selectivity X X
Specificity X X
Linearity X X
Working Range X X
Detection Limit X X
Quantification Limit X X
Accuracy X X
Recovery X X
Repeatability X X
Intermediate Precision X X
Reproducibility X X
Adequacy To Mathematical Models X X
Source: the author.
On the other hand, the investigation of data, metadata, numerical results, and mappings allowed the detection of resources that
raised the tools to guarantee the validity of internal results (7.7.1.) (ISO, 2017) in both methods. Table 5 depicts the tools that
are present in the treatment and analysis of the results produced by the methods.
Page 11/39Table 5
Verification of the presence of tools to guarantee the validity of internal results (7.7.1.)74 in technical reports, data, and
metadata of the land use and cover105 and demographic density101 methods of INDE.
Verification of the presence of tools to guarantee the validity of internal results (7.7.1.)74
Tools to guarantee the validity of results Method: Land Use and Method: Demographic
Cover Census
Use of reference materials or materials for quality control X X
Using alternative calibrated instrumentation to provide traceable X X
results
Functional checks of measuring and testing equipment X X
Use of check patterns or work patterns with control charts, when X X
applicable
Intermediate checks on measuring equipment X X
Replicated tests or calibrations, using the same or different X X
methods
Retest or recalibration of retained items X X
Correlation of Results from Different Characteristics of an Item X X
Critical analysis of reported results X X
Intralaboratory comparisons X X
Testing of blind sample(s) X X
Source: the author.
Complementarily, the set of researched documents evidenced some accessory tools of the methods, which contribute to
guarantee the quality of the results generated by them. These tools are described in Table 6 and are significant for
understanding how the methods work.
Table 6
Accessory tools to guarantee the quality of results.
METHOD ACCESSORY TOOLS TO GUARANTEE THE QUALITY OF RESULTS
DEMOGRAPHIC 1) ISO 19115 standard. 2) Management System of the Collection Post (SIGPC). 3) Management System
DENSITY of the Collection Post (SIGC). 4) Imputation and Criticism System. 5) System Validation and Approval
METHOD 101 System. 6) Territorial Base. 7) Geographic Operational Base (BOG). 8) GEOBASE. 9) Quality Inspector.
10) Estimation Error Analysis in the Mathematical Model. 11) Survey to Evaluate the Coverage of the
2010 Census Collection (PA 2010). 12) Pairing of 2010 Census and 2010 PA Data. 13) Method
Calibration. 14) Estimates Calculations. 15) Sample Error. 16) Sample fractions.
METHOD OF 1) Use of the series of ISO 19115 standards to report data. 2) Comparison of analytical results with
LAND USE AND results from other information bases. 3) Methods for evaluating and measuring errors = data interpreter
COVER105 and sample checking. 5) Estimates with equivalent precision. 6) Sample fraction based on the
dimensions of the areas to be reassessed.
Source: the author.
This set of information enabled the critical analysis of the methods and their respective results. It also brought notes on the
reliability, comparability and traceability of geographic information indexed on the INDE platform. In addition, it made it
possible to verify the method's ability to reduce the coverage areas of geospatial data indexed in INDE. These points set the
stage for the discussion that follows.
Page 12/39Discussion
The investigation fulfilled demonstrated that the standard methods of “demographic density” (IBGE, 2013b) and “land use and
cover” (IBGE, 2013a) of the National Spatial Data Infrastructure (INDE) (CINDE, 2010) do not use of Standard 17025 (ISO, 2017)
in the methodological framework or during the production and analysis of results. However, the research showed that a
significant part of the metrological tools for validating methods (7.2.2.) and ensuring the validity of internal results (7.7.1.) is
analyzed in the planning, structuring, execution and quality control of methods and their results (IBGE, 2013a, 2013b), to
contribute to the pillars of reliability, comparability, and traceability of geographic information (IBGE, 2019b).
Method validation parameters
Selectivity and Specificity
these two validation parameters are associated with the ability of the census method (IBGE, 2013b) to select characteristics of
interest. Specificity (ISO, 2017) refers to the collection of specific information from the set of population characteristics
(Magnusson, 2014), such as age, gender, ethnicity. While selectivity (ISO, 2017) is linked to different characteristics that
generate signals, but which can be distinguished, that is, analyzed separately (Macarthur & von Holst, 2012). Assuming these
parallels, the analysis revealed that features of these parameters make up the standard INDE method (IBGE, 2013b), which
significantly contribute to the characterization of populations (Magnusson, 2014). To regionalize the anthromes is important
have results that represent the population in different population agglomerates, to characterize them in the best possible way
(Ellis, 2014a; Magliocca et al., 2014; Schug et al., 2018). In this manner, these two aspects of validation significantly contribute
to the use of these data in the correlation analysis (Erb et al., 2017; Haines-Young et al., 2012), as they demonstrate the ability
of the standard method to distinguish information relevant to the construction of the anthromes model (Ellis, 2011; ELLIS, 2013;
Ellis & Ramankutty, 2008).
In the land use and cover method (IBGE, 2013a), the specificity (ISO, 2017) refers to the method's ability to identify a unique
terrain feature during the processing and classification of orbital images (Meng et al., 2017). In addition, selectivity (ISO, 2017)
deals with the method's ability to assimilate different types of use and coverage, enabling the individualization of
characteristics in small areas (Bayoudh et al., 2015). This research verified that in the standard method (IBGE, 2013a) a
reference value is used for the acceptance of the classification generated in the processing and classification (Lark et al., 2017;
Liu et al., 2018). This value, also treated as “minimum acceptance accuracy”, is based on the method's ability to distinguish
areas through false color in bands 5R, 4G and 3B (Leinenkugel et al., 2013). It was possible to recognize that the establishment
of this value is commonly used for this scope in the literature (Amici, 2011; Rial et al., 2017; Saah et al., 2020). In Brazil, the
minimum acceptance accuracy level is 85% and is similar to international acceptance profiles for other methods (Chetcuti et al.,
2021; Koch et al., 2021; Mishra et al., 2021; Morrison et al., 2021; Tao et al., 2021; Winkler et al., 2021; Yletyinen et al., 2021). For
Metrology, the reference value (VIM, 2012) provides evidence on the measurement capacity of institutions (BIPM, 2017) and,
through it, it is possible to establish traceability to the International Bureau (Araujo et al., 2017). In this line of thought, by
establishing a reference value for the acceptance of processing and classification of orbital images in land use and land cover
methods, it would be possible to establish resources for comparability (VIM, 2012) of the information nationally (Mittaz et al.,
2019). Furthermore, through it, it would be feasible to establish traceability (VIM, 2012) schemes of the geographic information
produced by other institutions (Sené et al., 2017). In this sense, the verification of the two parameters (ISO, 2017) in the
structuring of the method (IBGE, 2013a) provides evidence that points to the efficiency of the software in identifying and
distinguishing properties in the field (Girardin et al., 2021; Jia et al., 2019; Parreira et al., 2019). By verifying these parameters in
the standard method, it was also found that the method can distinguish particularities on the ground in areas of 1 km² within
the acceptance accuracy level (IBGE, 2013a). This area is sufficient to distinguish important natural features in the territory (De
Keersmaeker et al., 2014; Li et al., 2016; Liu et al., 2018; Maestripieri et al., 2017; Pouliot et al., 2014) and provides subsidies that
favor the application of data in the cluster analysis for regionalization of anthromes (Ellis, 2011; Ellis, 2015).
Working Range and Linearity
Page 13/39these parameters are associated with the ability of census methods (IBGE, 2013b) to operate in a working range (ISO, 2017),
generating results with acceptable precision and accuracy for the intended use (Magnusson, 2014). The investigation in the
census method demonstrated that the design of sample fractions over the years aims to obtain sufficient data to characterize
the population in each census sector (IBGE, 2011, 2018b, 2020b). Therefore, the reference values of the sample fractions guide
the number of individuals to be censused to meet the linear model proposed by the method (Spalding & Hull, 2021; Zheng et al.,
2014). The literature indicates that concise data on the different population densities in an area contributes to the identification
of singularities of anthromes at a local scale (Ellis et al., 2010; Magliocca et al., 2014; Olsson et al., 2019). In this way, through
these methodological aspects, paths are indicated for the regionalization of anthromes, to assimilate characteristics and
natural features existing in the national territory (Ellis, 2014a; Magliocca et al., 2013, 2014).
Additively, in the land cover and use method (IBGE, 2013a) the working range (ISO, 2017) refers to the range established
between the limits of largest and smallest area that the classification software can operate, framing the product in the
acceptance profile (Laraby & Schott, 2018; Macarthur & von Holst, 2012). Completely, linearity (ISO, 2017) is associated with
this range, presenting a linear response to the variation in sector sizes and characterizing them with the referred precision (Do
Valle Júnior et al., 2019; Magnusson, 2014). Through this research, quadrants of 1 km² were identified as the smallest
classification area of the standard method, within the acceptance value (IBGE, 2013a). This size favors the assimilation of
characteristics specific to the territory, such as natural features linked to rivers and preservation and conservation areas (Calvin
et al., 2019; Koch et al., 2021; Magioli, et al., 2021b; Morrison et al., 2021; Schug et al., 2018; Winkler et al., 2021). By
determining a single area size for investigation, the results produced for the entire national territory become comparable
(Magliocca et al., 2015; Sené et al., 2017), reaching one of the pillars that are aimed at comparability (VIM, 2012). Furthermore,
by assimilating errors and uncertainties (VIM, 2012) in image processing (level of precision), it is possible to have more clarity
about the information generated (BIPM, 2008), improving the geospatial data and ensuring its quality based on the reference
value (Laraby & Schott, 2018; Thompson et al., 2002). In this sense, the richness of geographic information indexed in the INDE
favors the application of land use and cover data (IBGE, 2013a) in the cluster analysis for regionalization of anthromes (Ellis,
2011; Ellis, 2015; Zheng et al., 2014).
Detection Limit and Quantification Limit
both parameters are linked to the minimum amount of information for the census method to respond (Magnusson, 2014), in
the other words, for the method to be able to present results that characterize the population. Following this metrological
precept, its close relationship with the establishment of sample fractions in census methods is noted (IBGE, 2010, 2013b,
2020b). The fractions reflect the concept that a minimum number of collections is necessary for the estimation to be
accomplished with the precision aimed at (Arlé et al., 2021; Dong et al., 2021; Magliocca et al., 2014; Song et al., 2021; al.,
2012). If the number is lower than necessary, the method will generate noise (Macarthur & von Holst, 2012), but it will not be
possible to characterize the information (Igbal & Khan, 2021; Schug et al., 2018; Trappes, 2021). For geographic information to
be sufficiently close to the reality of the census sector, it is imperative to establish more accurate sample fractions (Liu et al.,
2018; Saah et al., 2020; Sené et al., 2017). In this manner, through the analysis of the sample fractions of the demographic
method, it was possible to verify that the population is efficiently described in each of the census sectors (IBGE, 2013b, 2020b),
bringing the population data closer to smaller areas when compared to the bases global (Blundo et al., 2021; Erb et al., 2017; Li
et al., 2016; Nedkov & Burkhard, 2012). This directly contributes to the spatialization of information about the population
(Umunay, 2015; Margulies et al., 2016; Rockström et al., 2009), allowing a closer approximation of the demographic data to the
local reality (Danielsen et al., 2021; Junior, 2021; Mbaru et al., 2021; Picuno et al., 2019).
In the land use and cover method (IBGE, 2013a), the quantification limit (ISO, 2017) deals with the smallest area that the
processing and classification software can distinguish, producing results within the acceptance profile (Magnusson, 2014).
Smaller than this sector size, the program does not perform the operation efficiently, generating noise (Macarthur & von Holst,
2012), which characterizes the detection limit (ISO, 2017). These limits, in the standard INDE method, are established by the
method's ability to distinguish disparate tones in the false-color scale in the 5R, 4G and 3B bands, as previously presented
(IBGE, 2013a). The delimitation of a minimum size of area promotes the comparability of geographic information, as it
provides characteristics on the readability of the method in different contexts of land cover and use (Liu et al., 2018; Magioli et
Page 14/39al., 2021b; Morrison, 2021; Winkler et al., 2021). In addition, noise analysis contributes to the study of uncertainties associated
with the classification and mapping generated (Goldbergs et al., 2018; Parreira et al., 2019). Assuming the analysis of these two
validation parameters in the structuring of the standard method, it was observed that both help to ensure the quality of the data
generated, as it is through them that it is identified that the method can reduce the areas of analysis without harming the results
generated (Chuai & Feng, 2019; Umunay, 2015; Parente et al., 2019; Vuolo et al., 2015). Therefore, the challenge of improving
the resolution of anthromes in the national territory finds other resources that collaborate to meet this objective (Alessa &
Chapin, 2008; Ellis, 2011; Ellis, 2015).
Recovery
the study of this parameter reflects the trend analysis (Hegerl et al., 2010; Magliocca et al., 2015), usually associated with
population estimation (IBGE, 2018b, 2019a). This research found that the trend analysis is based on population growth rates,
which are calculated based on the historical series of operations (IBGE, 2013b, 2018b). The comparison between the estimated
value (present base) and the projected value (past base) directly helps in controlling the quality of the information generated
(Macarthur & von Holst, 2012). Through it, it becomes possible to study the statistical variability between the two pieces of
information (Thompson et al., 2002). This brings consistency to the population data, positively affecting the regionalization of
anthromes (Magliocca et al., 2015), as it delivers more robust demographic information (Ellis, 2013a; Jia et al., 2019).
In the land use and cover method (IBGE, 2013a) this parameter is associated with the use of standard images to assess the
ability of the classification method to distinguish terrain properties (Do Valle Júnior et al., 2019). There is in the standard
method the use of previously classified images, which are established as standard by their framing in the acceptance profile
(IBGE, 2012, 2013a). Its application is aimed at trend analysis (bias) (Macarthur & von Holst, 2012), which is linked to the
agreement of the results obtained over consecutive measurements. The analysis of the method trend contributes to reducing
the uncertainty of the generated products, in view of the distortion between the results obtained that should be presented in this
aspect (Laraby & Schott, 2018; Meng et al., 2017). Additively, the analysis of this parameter contributes to the adequacy of the
method to the intended use, in other words, it demonstrates its ability to maintain a pattern of measurements with small
variations in the results generated (Bayoudh et al., 2015; Feilhauer & Schmidtlein, 2011; Magnusson, 2014). In this sense, it was
noted that this practice is already consolidated in the standard method of the INDE, which generates reliability in geographic
information on land use and cover (Sené et al., 2017). Furthermore, the reporting of deviations from the results generated by
repeated measurements minimizes the impacts of errors and uncertainties (BIPM, 2008) on the products generated,
contributing to ensure the quality of information for cluster analysis (Goldbergs et al., 2018; Parreira et al., 2019). Consequently,
there is other evidence that corroborates the use of data from the INDE platform as a basis for regionalization of Brazilian
anthromes (Ellis, 2011; Ellis, 2015; Ellis & Ramankutty, 2008).
Intermediate Precision
reflects the degree of agreement between the results generated by the same method when varying characteristics during the
process (Magnusson, 2014). Through research using the standard method (IBGE, 2013b) it was noted that this parameter is
linked to different values of standard deviation and coefficients of variation (Macarthur & von Holst, 2012), which change
according to size of the population of the census sector (IBGE, 2011, 2018b, 2019a). The two statistical resources contribute to
the demonstration of method accuracy (Thompson et al., 2002), increasing the quality of information (Mairota et al., 2013;
Mastrandrea et al., 2010; Nunes et al., 2021) and allowing the verification of the proximity of the data to the local scale
(Gaüzère & Devictor, 2021; Plowright et al., 2017). In addition, both collaborate to control errors and uncertainties (VIM, 2012) in
the estimations, as they are part of the study of measurement uncertainty (BIPM, 2008). In this sense, the analysis of this
parameter has more cohesive data (Arlé et al., 2021; Boer et al., 2021; Morrison, 2021), contributing to obtain better results in the
cluster analysis (Mittaz et al., 2019; Sun et al., 2017) for the regionalization of Brazilian anthromes (Ellis, 2015).
In the method of land use and cover (IBGE, 2013a), the parameter encompasses the degree of agreement between the
classifications of the same image, varying the period of image capture and the source of the image of the same area (Valle
Júnior et al., 2019; Laraby & Schott, 2018). The investigation of this validation parameter strongly contributes to temporal
Page 15/39analyzes in socio-ecological systems (Landrum et al., 2015; Meng et al., 2017). The variability of results over a given period
positively affects the understanding of environmental dynamics (Chen et al., 2021; Parente et al., 2019; Winkler et al., 2021;
Yang et al., 2019) and, consequently, that of the mapping of anthromes (Amiot et al., 2021; Dong et al., 2021; Finlayson et al.,
2021; Jia et al., 2019). Research accomplished using the standard method (IBGE, 2013a) indicated that measurements are
demonstrated in a pre-established period, to optimize the understanding of changes in land use and land cover (IBGE, 2017,
2018a, 2020a). This is essential to apply anthromes mapping as a land use planning tool, as it assumes territorial
transformations over the years (De Keersmaeker et al., 2014; O'Connor et al., 2021; Picuno et al., 2019; Wang & Han, 2019;
Weissteiner et al., 2011; Zheng et al., 2014). Therefore, the analysis of the method's intermediate precision is a unique resource
for solving the barriers associated with temporal analyzes (Amiot et al., 2021; Pouliot et al., 2014; Qin et al., 2021).
Accuracy
This parameter is a metrological composition based on recovery and intermediate precision aspects (Magnusson, 2014;
Thompson et al., 2002). In the investigation fulfilled using the census method, it was observed that there is no variation in the
different levels of information aggregation (cities, states and country) (IBGE, 2011, 2013b, 2019b; Pinto et al., 2020), which may
be verified through the consulted tables shown in Table 1. Thus, the accuracy of the information in different census sectors
contributes to the application of these data in the cluster analysis (Magliocca et al., 2014; Olsson et al., 2019). This is because
the data make it possible to approximate the model to smaller areas (Gaüzère & Devictor, 2021; Lark et al., 2017; Sené et al.,
2017; Zheng et al., 2014), considering important regional cuts, which it is essential for the regionalization of anthromes (Calvin
et al., 2019; Chuai & Feng, 2019; Magliocca et al., 2015). In addition, the data allow the joining of areas for models that
encompass different characteristics of the sectors (Altieri et al., 2014; Sun et al., 2017).
When it comes to the land use and cover method (IBGE, 2013a), accuracy assumes the character of the method's ability to
classify a certain land use and cover against its true classification (Magnusson, 2014). In this sense, it is noted that the
investigation of the other parameters that compose it lead to the interpretation of the accuracy with which the software
operates, considering the level of precision for acceptance of the result (Bayoudh et al., 2015; Do Valle Júnior et al., 2019;
Laraby & Schott, 2018). Accuracy demonstrates the effectiveness of the software in classifying land properties, assimilating
important natural features for the application of anthromes in land use planning (Liu et al., 2018; Novelli et al., 2016). In
addition, it is correlated with quality control (Sené et al., 2017; Thompson et al., 2002) and supplements the process of
producing data closer to reality (Landrum et al., 2015; Parente et al., 2019; Plowright et al., 2017; Wen et al., 2019), carrying
characteristics that better describe the areas analyzed. Through research made in the standard method (IBGE, 2013a) it was
possible to identify that the parameter applies to the structuring of the method, as it sufficiently describes areas of 1 km². In this
way, the data indexed in the INDE enriches the knowledge about the areas (Arlé et al., 2021; Blundo et al., 2021; Boer et al., 2021;
Morrison, 2021), approximating the information of the local area through the complex expressed by accuracy, consequently
improving the results that can be obtained in the cluster analysis (Mittaz et al., 2019; Sun et al., al., 2017).
Repeatability
associated with the degree of agreement between results obtained by the same method in the same area, with a short space
between the estimates, being performed by the same operator (Magnusson, 2014). In verifying the census method, it was found
that the series of tests performed during the structuring of the method has its results analyzed by a single system (IBGE,
2013b). Testing contributes substantially to demonstrating the quality of information, as it allows the assessment of the
variation in the measurement/estimation results produced (Magliocca & Ellis, 2013; Thum et al., 2021). In this way, data
variability, which directly affects the regionalization of anthromes, is minimized and becomes capable of being controlled
(Alvarenga et al., 2016; Landrum et al., 2015; Pouliot et al., 2014; Schug et al., 2018; Sené et al., 2017; Vuolo et al., 2015), since it
is known how concordant the values obtained for each census sector area.
Regarding the method of land use and cover (IBGE, 2013a), the parameter refers to the analysis of the same orbital image
numerous times during a pre-established time interval, to verify whether the results are variants among themselves (Laraby &
Schott, 2018; Macarthur & von Holst, 2012). In the research fulfilled, it was noted that this mechanism is used to evaluate
Page 16/39You can also read