Meeting of the Market Oversight and Transparency Committee - October 6, 2021
←
→
Page content transcription
If your browser does not render page correctly, please read the page content below
Meeting of the Market Oversight
  and Transparency Committee
                       October 6, 2021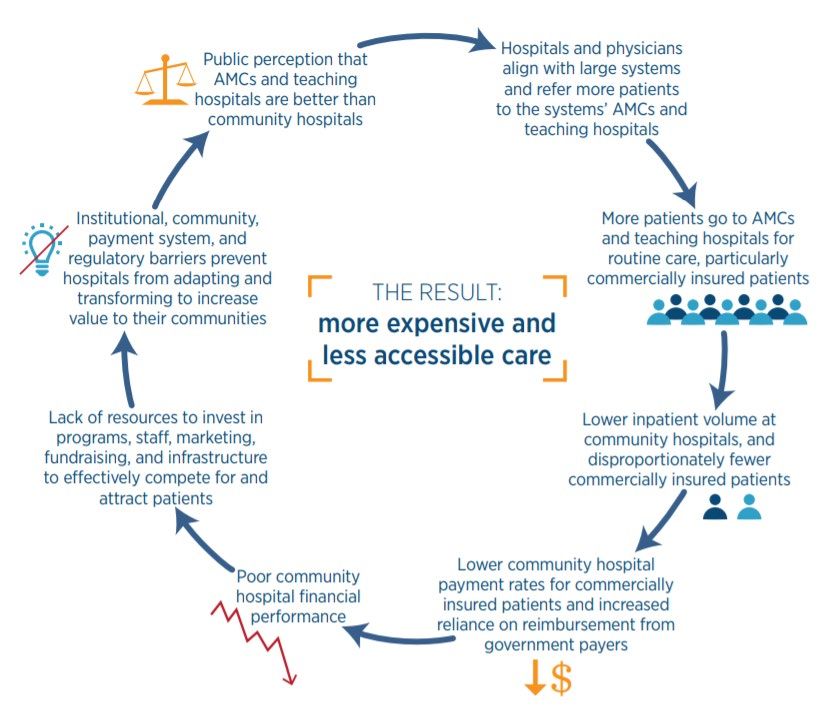
AGENDA Call to Order Approval of Minutes from June 2, 2021 (VOTE) Report Findings: Children with Medical Complexity in the Commonwealth HPC 2021 Policy Recommendations Schedule of Upcoming Meetings
AGENDA Call to Order Approval of Minutes from June 2, 2021 (VOTE) Report Findings: Children with Medical Complexity in the Commonwealth HPC 2021 Policy Recommendations Schedule of Upcoming Meetings
VOTE: Approving Minutes

MOTION: That the Commission hereby approves the minutes
of the Commission meeting held on June 2, 2021 as
presented.

                                                          5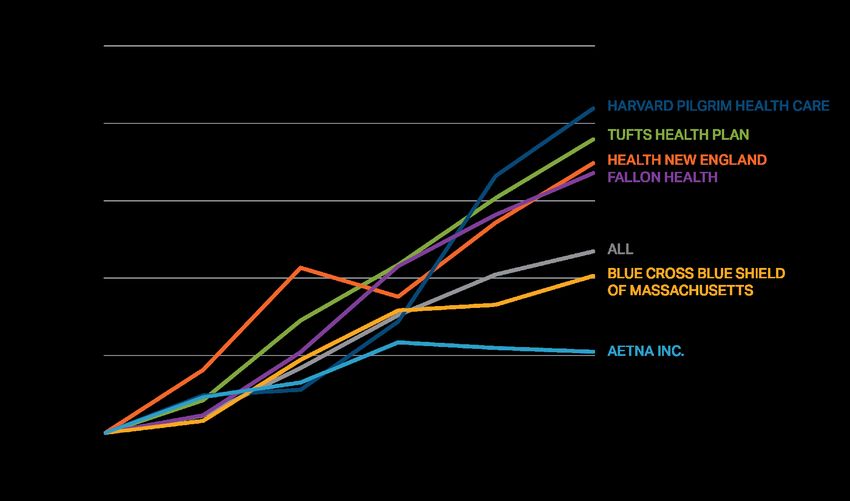
AGENDA Call to Order Approval of Minutes from June 2, 2021 (VOTE) Report Findings: Children with Medical Complexity in the Commonwealth HPC 2021 Policy Recommendations Schedule of Upcoming Meetings
Report Findings:
Children with Medical Complexity in the Commonwealth

   Legislative Charge

   Defining Children with Medical Complexity

   Demographics, Spending, and Utilization

   Stakeholder Perspectives

   Next Steps

                                                       6
Legislative Charge

      To better understand the landscape of care for children with
      medical complexity (CMC) in the Commonwealth, the
      Massachusetts Legislature enacted Chapter 124 of the Acts of
      2019: An act relative to children’s health and wellness.

      Section 7 of Chapter 124 of the Acts of 2019 tasks the
      Massachusetts Health Policy Commission (HPC) with estimating
      the number of CMC in the Commonwealth, their demographics,
      primary diagnoses, health coverage, access to and utilization of
      health care, associated costs, and recommendations for ongoing
      data collection and reporting.

                                                                         7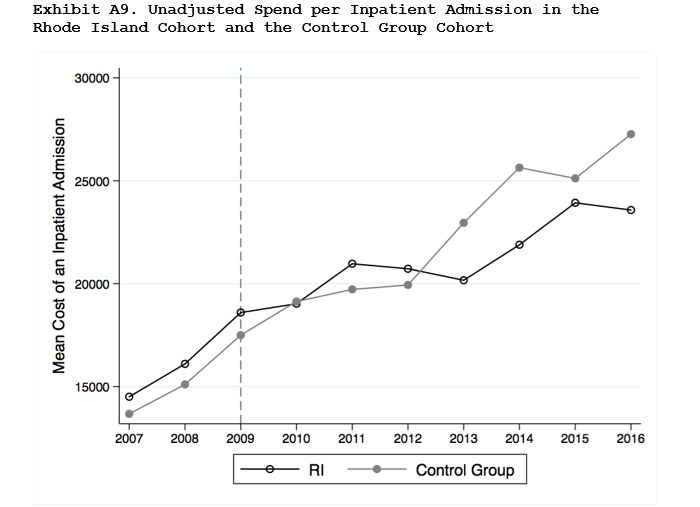
Background on Children with Medical Complexity
CHARACTERISTICS
Serious, chronic, and multiple medical and mental, behavioral, or developmental health
conditions, including functional limitations, high health service needs, and high utilization.1
A diverse and high-need population, representing the most medically fragile subgroup of
children with special health care needs.2
– Children with special health care needs have or are at risk of chronic physical,
developmental, behavioral, or emotional conditions, requiring services beyond those
required by children generally.3
UTILIZATION
Often require surgery or inpatient services, or rely on DME and supplies, medical technology,
or home health services.4-6
CMC have disproportionately high health spending compared with healthy children.5
PREVALENCE
Research estimates that nationally, CMC represent 1-4% of all children,8,9 and 5-6% of
children covered by Medicaid.5,7
1 Berry JG, Agrawal RK, Cohen E, Kuo DZ. The Landscape of Medical Care for Children with Medical Complexity. Children's Hospital Association. June 2013. Available at:
http://www.columbia.edu/itc/hs/medical/residency/peds/new_compeds_site/pdfs_new/PL3%20new20readings/Special_Report_The_Landscape_of_Medical_Care_for_Children_with_Medical_Complexity.pdf
2 Cohen E, Kuo DZ, Agrawal R, Berry JG, Bhagat SKM, Simon TD, Srivastava R. Children With Medical Complexity: An Emerging Population for Clinical and Research Initiatives. Pediatrics. 2011; 127(3):529-583.
3 HRSA Maternal & Child Health. Children with Special Health Care Needs: NSCH Data Brief. Jul 2020. Available at: https://mchb.hrsa.gov/sites/default/files/mchb/Data/NSCH/nsch-cshcn-data-brief.pdf
4 Doupnik SK, Rodean J, Feinstein J, Gay JC, Simmons J, Bettenhausen JL, Markham JL, Hall M, Zima BT, Berry JG. Health Care Utilization and Spending for Children With Mental Health Conditions in Medicaid. Academic Pediatrics. 2020;
20(5):678-686.
5 Berry JG, Hall M, Neff J, Goodman D, Cohen E, Agrawal R, Kuo D, Feudtner. Children With Medical Complexity And Medicaid: Spending And Cost Savings. Health Affairs. 2014; 33(12): 2199-2206.
6 Kuo DZ, Melguizo-Castro M, Goudie A, Nick TG, Robbins JM, Casey PH. Variation in Child Health Care Utilization by Medical Complexity. Maternal and Child Health Journal. 2015; 19: 40-48.
7 Reuland CP, Collins J, Chiang L, Stewart V, Cochran AC, Coon CW, Shinde D, Harguani D. Oregon’s approach to leveraging system-level data to guide a social determinants of health-informed approach to children’s healthcare. BMJ Innovations.
2020; 7(1): 1-8.
8 NASHP. National Care Coordination Standards for Children and Youth with Special Health Care Needs. Oct 16, 2020. Available at: https://www.nashp.org/national-care-coordination-standards-for-children-and-youth-with-special-health-care-
needs/#toggle-id-1
9 Children's Hospital Association. Coordinating All Resources Effectively for Children with Medical Complexity (CARE Award): Early Lessons Learned from the Project. Sept 2016. Available at: https://www.childrenshospitals.org/-
/media/Files/CHA/Main/Programs_and_Services/Quality_Safety_and_Performance/CARE/CARE_award_early_lessons_learned_sept2016.pdf 8About the Report
Children with medical complexity (CMC) are a high-need population, with
significant use of health and social services.
The health system is not always set up to adequately support CMC, for whom
health care and health coverage are often fragmented, and who require
coordination across multiple overlapping medical and social service settings
and systems.
To understand the population of CMC and their health care landscape in the
Commonwealth, the HPC investigated demographics, health coverage, health
service utilization, and spending.
The HPC also met with stakeholders to understand issues of care not
measurable in administrative data, including access, care continuity, and social
complexity for families.
9Report Findings:
Children with Medical Complexity in the Commonwealth
Legislative Charge
Defining Children with Medical Complexity
Demographics, Spending, and Utilization
Stakeholder Perspectives
Next Steps
10Children with medical complexity and their families often rely on multiple
health and social service systems.
Mental and behavioral
health care
Specialty and Private health
subspecialty care insurance
Primary care Public health
insurance
Home health Physical and
occupational therapy
Outpatient care Public health
departments
Inpatient care
Schools
Navigating across multiple sources of care can be burdensome for CMC and their families.
11There are many insurance coverage and public programs supporting
CMC in Massachusetts.
12Example Family Care Map
• Care maps are family-created
diagrams depicting the
constellation of providers,
services, and supports needed
to care for CMC.1
• This care map for a patient with a
chromosomal disorder depicts
public programs, speech,
physical, and occupational
therapy, public and private health
insurance, health services
including pediatric, other
outpatient, hospital inpatient,
medication, and DME, and school-
based health and educational
services and supports, as well as
support from family and friends.
1 Adams S, Nicholas D, Mahant S, Weiser N, Kanani R, Boydell K, Cohen E. Care maps for children with medical complexity. Developmental Medicine & Child Neurology. 2017; 59(12):
1299-1306.
Exhibit source: Children's Wisconsin. A picture paints a thousand words: Care maps help families identify what matters most. Nov 9, 2017. Available at:
https://childrenswi.org/NewsHub/stories/a-picture-paints-a-thousand-words-care-maps-help-families-identify-what-matters-most
13Research estimates that CMC make up about 1-4% of all children, or
approximately 14,000 – 56,000 children in Massachusetts.
All children
1.4 million in MA1
Children with special
healthcare needs
18% of children2
252,000 in MA
CMC
1-4% of children2,3
14,000-56,000
in MA
1 United States Census Bureau. Quickfacts: Massachusetts. Available at: https://www.census.gov/quickfacts/MA
2 NASHP. National Care Coordination Standards for Children and Youth with Special Health Care Needs. Oct 16, 2020. Available at:
https://www.nashp.org/national-care-coordination-standards-for-children-and-youth-with-special-health-care-needs/#toggle-id-1
3 Children's Hospital Association. Coordinating All Resources Effectively for Children with Medical Complexity (CARE Award): Early Lessons Learned from the
Project. Sept 2016. Available at: https://www.childrenshospitals.org/-
/media/Files/CHA/Main/Programs_and_Services/Quality_Safety_and_Performance/CARE/CARE_award_early_lessons_learned_sept2016.pdf
14Report Findings:
Children with Medical Complexity in the Commonwealth
Legislative charge
Defining Children with Medical Complexity
Demographics, Spending, and Utilization
Stakeholder Perspectives
Next Steps
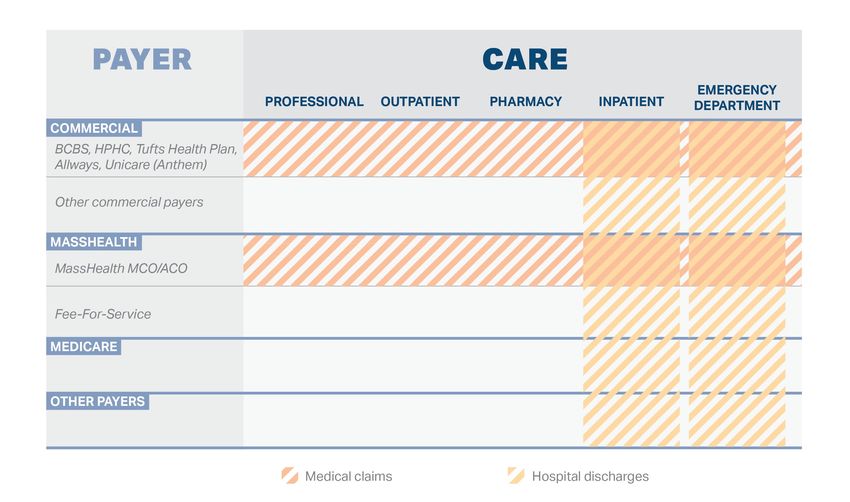
15Data Sources: The HPC analyzed both all-payer hospital discharge data
and medical claims from certain commercial and MassHealth plans.
16Using the Pediatric Medical Complexity Algorithm to Identify CMC in Inpatient Stay and Claims Data The PMCA sorts individuals aged 21 and younger into three groups: NON-CHRONIC Individuals with no diagnoses or with acute non-chronic conditions lasting
In 2018, there were over 8,000 children with medical complexity who had
at least one inpatient hospital stay.

31,258 of the approximately 800,000 inpatient hospital stays in Massachusetts
                   in 2018 were among people ages 1-21.
      41% of the 31,258 stays were for children with medical complexity.

                               Non-chronic
                                Stays: 8,542
                             Individuals: 8,179

Hospital inpatient        Non-complex chronic
   Stays: 31,258                Stays: 9,925
Individuals: 25,109          Individuals: 8,863

                            Complex chronic                     CMC
                               Stays: 12,791                 Stays: 12,791
                             Individuals: 8,067            Individuals: 8,067

                                                                                18
Demographics of CMC with Inpatient Hospital Stays, 2018
Discharges
1201 1153 Half of CMC are in the four
1-5 lowest income deciles
19-21 17%
886
30% 817
679 713 681
648 606 639
Half of CMC 6-10
are ages 15-21 13%
11-14
15-18 15% Lower Higher
25% Income Deciles
54% 52%
CMC
48% male Non-CMC
24%
20%
52% female 13%
11% 10% 10%
3% 4%
Asian Black/African Hispanic White Other or
American Unspecified Race
Note: Analysis excludes individualsThe average length of an inpatient stay for CMC was 6.5 days, nearly
double the length of stay for non-CMC.
Discharges
Mean hospital inpatient length of stay in days for CMC and non-CMC, 2018
Non-CMC 3.6
CMC 6.5
Note: Analysis excludes individualsCMC inpatient stays were concentrated at a few hospitals, with nearly
70% of stays taking place at five hospitals.
Discharges
Proportion of CMC discharged per hospital at the top 15 hospitals for CMC discharges, 2018
Community
36%
Teaching
AMC
Specialty
10%
7% 7%
6%
4%
2% 2% 2% 2% 1% 1% 1% 1% 1%
Note: Analysis excludes individualsIdentifying CMC in 2018 Claims Data: 4.5% of children with commercial coverage
and 6.4% of children with MassHealth MCO/ACO primary coverage are CMC.
All individuals
Commercial: 201,657
MCO/ACO: 119,774
Complex chronic Non-complex chronic Non-chronic
Commercial: 16,503 Commercial: 36,238 Commercial: 148,916
MCO/ACO: 16,440 MCO/ACO: 28,485 MCO/ACO: 74,849
Multiple years Use of 2+
Inpatient 2+ months
with top 10% N utilization N types of N home health N Not CMC
spending DME/supplies
Y Y Y Y
CMC
Commercial: 9,117
MassHealth MCO/ACO: 7,651
Notes: See appendix for more detail
22Demographics of Commercially-Insured CMC, 2018
Claims
CMC make up 3-6% of each age group
19-21 5.4%
15-18 5.6%
1 in 5 11-14 3.9%
CMC have mood disorders 6-10 3.5%
such as anxiety and depression. Other
common behavioral diagnoses include 1-5 4.5%
autism and ADHD.
4.7% 4.7% 4.9%
4.3% 4.4% 4.3% 4.3% 4.3% 4.3%
4.1% 4-5% of each
52% of CMC income decile is
are male CMC. Half of
commercially-
insured CMC are
in the three
48% of CMC highest income
are female deciles.
1 2 3 4 5 6 7 8 9 10
Lower Higher
Income Deciles
Notes: Analysis excludes individualsDemographics of CMC covered by MassHealth MCO/ACO plans, 2018
Claims
CMC make up 6-11% of each age group
19-21 11.2%
15-18 7.0%
1 in 5 11-14 5.9%
CMC have mood disorders
6-10 5.5%
such as anxiety. Other common
behavioral diagnoses include autism
and ADHD 1-5 6.5%
7.4%
6.8% 5-7% of each
6.1% 6.0% 6.3% 6.1% 5.8%
5.7% 5.5% income decile
5.3%
58% of CMC is CMC. Nearly
two-thirds of
are male
CMC covered
by MassHealth
managed care
42% of CMC plans are in the
are female three lowest
income deciles
Lower Higher
Income Deciles
Notes: Analysis excludes individualsAverage total annual spending for commercially-insured CMC was
$36,263, compared to $2,058 for non-CMC.
Claims
Mean commercial inpatient, outpatient, professional, pharmacy, and other spending for CMC and non-CMC per member
per year, 2018
$36,263
$14,448
$8,474
$6,731
$5,685
$1,253 $2,058
$395 $367 $925
$31 $12
Inpatient Outpatient Professional Pharmacy Other Total
CMC Non-CMC
Notes: Analysis excludes individualsAverage total annual spending for CMC with MassHealth MCO/ACO
coverage was $24,856, compared to $1,737 for non-CMC.
Claims
Mean MCO/ACO inpatient, outpatient, professional, pharmacy, and other spending for CMC and non-CMC per member
per year, 2018
$24,856
$12,662
$4,993
$3,268
$2,417 $1,737
$954 $1,516
$52 $421 $302 $9
Inpatient Outpatient Professional Pharmacy Other Total
CMC Non-CMC
Notes: Analysis excludes individualsAverage annual commercial out-of-pocket spending for CMC was 5.5
times ($2,251) that of non-CMC ($407).
Claims
Commercial out-of-pocket medical and pharmacy spending for CMC and non-CMC per member per year, 2018
$2,251
$407
CMC Non-CMC
Notes: Analysis excludes individualsCMC make up 3-5% of commercially-insured pediatric patients per
provider organization.
Claims
Proportion of commercially-insured CMC ages 1-21 by provider organization, 2018
Children's Medical Center Corporation 5.4% (2434)
Partners 4.8% (1553)
South Shore 4.7% (220)
Atrius 4.4% (1010)
Unattributed 4.4% (470)
BIDCO 4.3% (220)
Other 4.3% (93)
Wellforce 4.2% (1005)
UMass 4.1% (396)
Steward 4.1% (574)
Lahey 4.0% (263)
Reliant 4.0% (224)
MACIPA 3.8% (94)
Southcoast 3.7% (42)
Baystate 3.6% (220)
Acton Medical Associates 3.4% (66)
Sturdy Memorial Foundation 3.1% (32)
BMC 2.8% (85)
Notes: Analysis excludes individualsCMC are more likely to use the ED than non-CMC and have almost twice
as many ED visits per person.
Claims
Proportion of commercially- and MassHealth ACO/MCO-insured CMC and non-CMC with any ED utilization and mean
ED visits per person among individuals who used the ED, 2018
Commercial MCO/ACO
Proportion of CMC and non-CMC with ED Proportion of CMC and non-CMC with ED
utilization utilization
37%
56%
12%
2.7 3.1 28%
1.8
1.4
Mean ED visits per person among those with Mean ED visits per person among those with
any ED visits any ED visits
CMC Non-CMC CMC Non-CMC
Notes: Analysis excludes individualsSummary of Key Findings
4.5% of commercially-insured children and 6.4% of children with MassHealth MCO/ACO
coverage are children with medical complexity (CMC).
About half of CMC in Massachusetts have commercial insurance, and about half are covered
by MassHealth.
– Preliminary findings do not capture children with primary commercial and secondary
MassHealth coverage.
CMC who are hospitalized have nearly double the length of inpatient stay of healthier
children who are hospitalized (6.5 vs. 3.6 days). A plurality of CMC (36%) are hospitalized at
Boston Children’s Hospital.
Annual commercial spending for CMC is 18 times that of healthier children ($30,578 vs.
$1,691), and annual MassHealth MCO/ACO spending for CMC is 16 times that of healthier
children ($22,439 vs. $1,435).
Annual commercial out-of-pocket spending for CMC is 5.5 times that of healthier children
($2,251 vs. $407).
21% of CMC have an identified mood disorder, such as anxiety or depression.
CMC are all types of children and live in all parts of Massachusetts: similar rates of CMC are
found across all demographic groups and regions of the Commonwealth.
30Report Findings:
Children with Medical Complexity in the Commonwealth
Legislative Charge
Defining Children with Medical Complexity
Demographics, Spending, and Utilization
Stakeholder Perspectives
Next Steps
31Stakeholders Consulted in the Development of the Report
Baystate Health
Boston Children’s Hospital
Federation for Children with Special Needs
Health Care for All
MassGeneral Hospital for Children
Massachusetts Center for Health Information and Analysis (CHIA)
Massachusetts Department of Public Health (DPH)
MassHealth
Reliant Medical Group
Assorted researchers and clinicians
32Stakeholders discussed access concerns for CMC.
Primary Care
Community pediatricians may only be able to treat a few CMC at a time.
Specialty Care
According to stakeholders, a shortage of pediatric specialists who accept MassHealth can create
access delays.
Many CMC require specialty and sub-specialty treatment or inpatient care, which is concentrated in
the Boston area; stakeholders noted challenges for CMC who have difficulty traveling or who lack
transportation.
Transportation difficulties can lead to missed appointments and families being denied further
appointments as no-shows.
COVID-19
Caution about exposure has led to missed in-person care, including fewer home health or PCA visits.
Providers noted that telehealth has helped to resolve some access issues but is not appropriate for
all children or available to all families.
1 Berry JG, Hall M, Neff J, Goodman D, Cohen E, Agrawal R, Kuo D, Feudtner. Children With Medical Complexity And Medicaid: Spending And Cost Savings.
Health Affairs. 2014; 33(12): 2199-2206. 33Stakeholders identified care continuity and coordination concerns.
Coverage and Benefit Design
Stakeholders described frequent changes or interruptions in employment for parents of CMC,
making care continuity difficult for families with commercial insurance.
Providers noted that benefit designs intended to reduce avoidable spending can lead to
interruptions in care for CMC.
Likewise, avoidable emergency department (ED) utilization and spending can occur when benefit
design limits access to DME and supplies.
Care Coordination
Stakeholders explained that families need an "air traffic controller" – a high level of coordination
across systems.
Stakeholders agreed this level of coordination belongs at regional public health agencies.
34Stakeholders reflected that social complexity for families with CMC likely
contributes to additional challenges.
Families of CMC often face financial and social marginalization.1
Parents of CMC are at increased risk of poor mental health.2
Some families face additional social complexity challenges including
poverty, housing instability, food insecurity or insufficiency, lack of
transportation, language barriers, or foster system involvement.3
Stakeholders agreed that social complexity can make it more difficult for
families of CMC to navigate systems involved in caring for their children.
1 Foster CC, Corniy A, Kwon S, Kan K, Heard-Garris N, Davis MM. Children With Special Health Care Needs and Forgone Family Employment. Pediatrics. 2021; 148(3).
2 Bayer ND, Wang H, Yu JA, Kuo DZ, Haltrerman JS, Li Y. A National Mental Health Profile of Parents of Children With Medical Complexity. Pediatrics. 2021; 148(2).
3 Reuland CP, Collins J, Chiang L, Stewart V, Cochran AC, Coon CW, Shinde D, Harguani D. Oregon’s approach to leveraging system-level data to guide a social
35
determinants of health-informed approach to children’s healthcare. BMJ Innovations. 2020; 7(1): 1-8.Report Findings:
Children with Medical Complexity in the Commonwealth
Legislative Charge
Defining Children with Medical Complexity
Demographics, Spending, and Utilization
Stakeholder Perspectives
Next Steps
36The HPC anticipates releasing a final report in the coming months.
Additional topics may include:
Pediatric to adult care transitions
Behavioral health
Emergency Department boarding
30-day hospital inpatient readmissions
Additional spending analyses
37AGENDA
Call to Order
Approval of Minutes from June 2, 2021 (VOTE)
Report Findings: Children with Medical Complexity in the Commonwealth
HPC 2021 Policy Recommendations
– Strengthen Accountability for Excessive Spending
– Constrain Excessive Provider Prices
Schedule of Upcoming MeetingsHealth care in Massachusetts is increasingly unaffordable.
Health care spending growth exceeded the benchmark in 2018 and 2019, placing
increasing burden on employers, individuals, and state budgets.
– THCE per capita increased 3.6% in 2018 and 4.3% in 2019.
– Commercial spending per enrollee grew 4.6% in 2018 and 4.1% in 2019.
Affordability for individuals and families is worsening.
– Health care spending increases from 2017-9 outpaced wage increases.
– Health care spending absorbs more than 1/4th of all earnings for one-third of middle-
class families (up from 28%).
– Nearly 1 in 3 lower income residents with commercial coverage avoided care due to
cost in 2019.
According to a 2021 survey of Massachusetts adults:
51% experienced any affordability burden
46% delayed or skipped care due to cost
26% struggled to pay medical bills
Affordability burdens were much higher for Black (75%) and Hispanic (68%)
residents
Massachusetts Health Policy Commission 2021 Annual Cost Trends Report
Altarum Healthcare Value Hub, Data Brief 97, September 2021,” Massachusetts Residents Struggle to Afford High Healthcare Costs; Worry About
Affording Care, Leading to Support for Government Actions to Address High Healthcare Costs”AGENDA
Call to Order
Approval of Minutes from June 2, 2021 (VOTE)
Report Findings: Children with Medical Complexity in the Commonwealth
HPC 2021 Policy Recommendations
– Strengthen Accountability for Excessive Spending
– Constrain Excessive Provider Prices
Schedule of Upcoming MeetingsHPC 2021 Policy Recommendations
AREAS OF FOCUS
1 2 3 4 5
Strengthen Constrain Make Health Advance Implement
Accountability Excessive Plans Health Targeted
for Excessive Provider Accountable for Equity for All Strategies and
Spending Prices Affordability Policies
Strengthen Accountability for Excessive Spending. Strengthen the mechanisms for
holding providers, payers, and other health care actors responsible for spending
performance by improving the metrics used in the annual performance improvement
plan (PIP) process, increasing financial penalties for above-benchmark spending or non-
compliance, and considering additional tools to reflect and respond to underlying
variation in the relative level of provider prices.
41Recommendation 1: Strengthening Accountability for the Benchmark
PIPs Process and Limitations
Impact of Increased Coding Intensity
Improving Accountability
42Accountability for the Health Care Cost Growth Benchmark: An Overview
Step 1: Benchmark Step 2: Data Collection
Each year, the process starts by CHIA then collects data from payers on unadjusted
setting the annual health care and health status adjusted total medical expense
cost growth benchmark (HSA TME) for their members, both network-wide and
by primary care group.
Step 4: HPC Analysis Step 3: CHIA Referral
HPC conducts a confidential, but CHIA analyzes those data and, as required by statute,
robust, review of each referred provider confidentially refers to the HPC payers and primary care
and payer’s performance across providers whose increase in HSA TME is above bright line
multiple factors thresholds (e.g. greater than the benchmark)
Step 5: Decision to Require a PIP Step 6: PIP Implementation
After reviewing all available information, including The payer or provider must propose the PIP and is
confidential information from payers and providers subject to ongoing monitoring by the HPC during the
under review, the HPC Board votes to require a PIP if 18-month implementation. A fine of up to than $500,000
it identifies significant concerns and finds that a PIP can be assessed as a last resort in certain circumstances.
could result in meaningful, cost-saving reforms. The
entity’s identity is public once a PIP is required.
43Accountability for the Health Care Cost Growth Benchmark: CHIA Referral
CHIA is required by statute to refer providers and payers to the HPC based on an
increase in health-status adjusted total medical expense (HSA TME).
Total medical expense (TME) is a measure of all medical spending (rx, hospital,
physician office visits, etc.) for a group of patients. Provider TME reflects all spending by
the provider’s primary care patients, regardless of where the spending occurred.
Health status adjusted (HSA) means that the spending figures are then adjusted based
on demographic information and health conditions in patients’ medical records to reflect
the health status of the population.
HSA TME exists only for payers and primary care providers. It does not exist for other
provider types (e.g., hospitals)
CHIA has created two bright line thresholds for referral to the HPC:
1. HSA TME growth ≥ the benchmark; OR
2. HSA TME growth ≥ 85% of the benchmark if the payer or provider is large (≥ 2% of
statewide member months) and has either high unadjusted growth (≥ the benchmark)
or, for providers, a high baseline level of spending (≥ the 75th percentile).
High unadjusted spending growth, a high spending level, or high prices (which can
impact other entities’ TME and statewide THCE) alone do not trigger referral.
44Reflecting on Five Years of Accountability Under the PIPs Process:
Strengths and Limitations
Strengths Limitations
The CHIA and HPC processes are well- By statute, PIP referrals must be based on
coordinated. increases in HSA TME, but:
HPC’s review of individual payer and – Health status adjustment is impacted by
provider performance has been effective in medical coding changes, masking
distinguishing between factors that are spending growth for many entities; and
more within their control (e.g., prices) – Entities with high spending levels or
and those that are unexpected or outside providers with high prices that impact
of their control (enrollment changes, new other entities’ TME and statewide THCE
high-cost drugs, COVID). may not be referred.
Payers and providers have appreciated Under the statute, only payers and
the greater insight into their own primary care providers can be referred
performance. and subject to a PIP.
– Providers are only accountable for their
Payers and providers have been willing to primary care patients’ spending (not,
work with HPC on an ongoing basis to e.g., hospital spending for patients with
address spending trends, even without a outside PCPs) .
public PIP.
Penalties are low and unrelated to
spending levels.
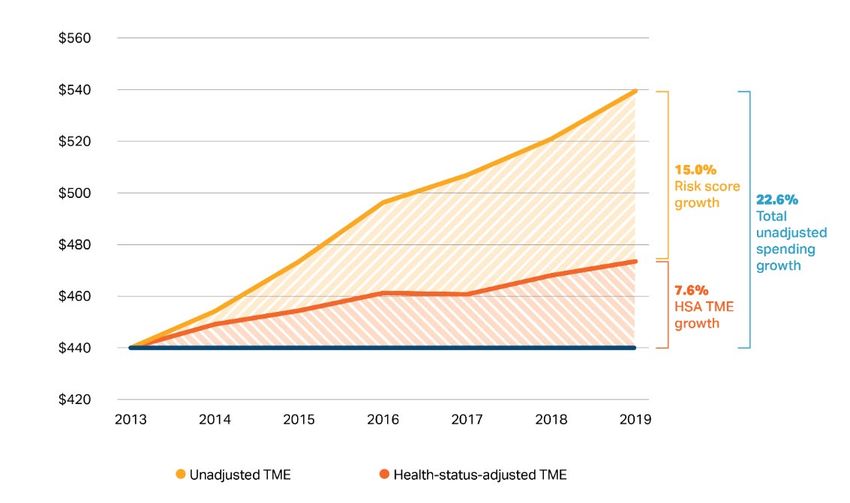
45HSA TME does not fully reflect spending growth: risk scores have grown
15% in 6 years, obscuring two-thirds of spending growth.
Total spending growth, risk score growth and HSA TME growth, 2013 to 2019 for Massachusetts commercial payers
Notes: United, Cigna, BMC Healthnet, Minuteman, Celticare and NHP (now Allways) excluded due to data anomalies or wide membership fluctuations
Source: Massachusetts Center for Health Information and Analysis, 2016 and 2018 databooks.
46Population health changes don’t explain risk score growth.
Change in average risk score for all members, by payer, 2013-2018
Changes in the age-sex
mix of the commercial
population explains 0.5%
of the 11.7% increase.
No increase in
underlying burden of
chronic disease (BRFSS,
2013-6).
– Arthritis, diabetes up
– Asthma, COPD down
No change in life
expectancy.
The growth of risk scores from 2013-2018 is equivalent to 430,000 more privately-insured
Massachusetts residents with complex diabetes or 920,000 more residents with cerebral palsy.
Notes: Risk scores normalized to 1.0 in 2013. United, Cigna, BMC Healthnet, Minuteman, NHP and Celticare excluded due to data anomalies or fluctuating membership.
Sources: CHIA TME databooks, 2016 and 2018. Federal Register vol 78 no. 47 March 11, 2013, Adult Risk Adjustment Model Factors. Burden of chronic disease analyzed
using the CDC’s BRFSS survey; rates of arthritis and diabetes among Massachusetts residents increased while COPD and asthma decreased from 2013 to 2016. Life
expectancy was unchanged. Impact of population aging assessed using insurer demographic data combined with age/sex/spending profiles from the APCD. 47HSA TME growth was below unadjusted TME growth for all major
provider groups from 2016-2019.
Percentage increase in unadjusted and health-status adjusted (HSA) TME by provider group for attributed BCBS members, 2016-9
20%
15%
10%
5%
0%
-5%
2016-2019 total % growth Unadjusted TME 2016-2019 total % growth HSA TME
Notes: PPO members are included only where assigned to a provider organization through a PCP. Only commercial members covered by Blue Cross Blue Shield of
Massachusetts (BCBSMA) are included and provider organizations are excluded if the total number of member months across these payers is below 100,000 in any
of 2016-2019. Sources: HPC analysis of Center for Health Information and Analysis TME databooks. Data for 2017-9 are based on CHIA’s 2021 Annual Report.
Data for 2016 are based on CHIA’s 2019 Annual Report and are included by computing the percentage growth in TME from 2016 to 2017 in the 2019 Annual report
applied to the 2017 values in the 2021 Annual Report to preserve within-databook consistency. 48Most entities with unadjusted TME growth over the benchmark have HSA
TME growth below the benchmark and are not referred.
Percentage increase in unadjusted vs. health-status adjusted (HSA) TME for three large provider groups and the three
major payers.
For example, in one
year, among 71 payer-
provider contracts,
unadjusted TME
growth exceeded the
benchmark for 47
(66%), but only 17
(24%) had HSA TME
growth that exceeded
the benchmark,
triggering referral.
The chart on the left
shows this dynamic for
a representative
subset of providers
and payers.
Notes: The number of referred contracts shown on this slide may not reflect the actual number of referrals as CHIA refers some contracts or books of business with HSA
TME growth below 3.6% in accordance with its published referral methodology.
Sources: Center for Health Information Analysis 49Hospital admissions continue to be coded at increasingly higher severity
levels.
Change in number of hospital admissions at each severity/complications level, 2013-2020
100%
4.4% 4.8% 5.5% 6.2% 7.0% 7.7% 8.2% 9.1%
90%
23.7% 24.8%
80% 26.5% 27.3% 28.7% 29.6% 30.6% 31.5%
70%
60%
38.0% 37.4%
50% 37.0% 36.9%
36.1% 35.8% 35.4% 34.6%
40%
30%
20%
33.9% 33.0% 31.1% 29.6% 28.2% 27.0% 25.9% 24.8%
10%
0%
2013 2014 2015 2016 2017 2018 2019 2020*
Severity Level 1 Severity Level 2 Severity Level 3 Severity Level 4
Notes: APR-DRG Level 1 is least severe and Level 4 is most severe. *COVID hospitalizations have been excluded from 2020 data.
Sources: CHIA HIDD Acute Case-mix Database, 2013-2020; MS-DRG classification system, APR-DRG classification system
50By statute, only part of the health care system is held accountable for
controlling spending growth, and tools to reduce spending are limited.
Percent of Discharges at System Hospitals among patients
By statute, only payers and primary care with a Non-System PCP
BCBS Commercial, 2016
providers are accountable for spending growth.
100%
Providers are only accountable for their primary
care patients’ spending 80%
– For example, hospitals are not accountable for
60%
their patients’ spending if those patients have
outside PCPs, and the majority of discharges
40%
at major hospital systems in Massachusetts
are for patients with PCPs outside of the 20%
system.
– If higher-priced hospitals raise prices or 0%
Beth Israel Lahey Partners Steward
increase volume from patients with outside
Deaconess
PCPs, there is limited impact on their own
TME growth.
By statute, the maximum penalty that any entity can receive for non-compliance with the PIPs
process is $500,000, which may be far below an entity’s contribution to spending growth.
The PIPs process is unable to directly address another of the major drivers of health care
spending in the state – provider prices.
51AGENDA
Call to Order
Approval of Minutes from June 2, 2021 (VOTE)
Report Findings: Children with Medical Complexity in the Commonwealth
HPC 2021 Policy Recommendations
– Strengthen Accountability for Excessive Spending
– Constrain Excessive Provider Prices
Schedule of Upcoming MeetingsHPC 2021 Policy Recommendations
AREAS OF FOCUS
1 2 3 4 5
Strengthen Constrain Make Health Advance Implement
Accountability Excessive Plans Health Targeted
for Excessive Provider Accountable for Equity for All Strategies and
Spending Prices Affordability Policies
Constrain Excessive Provider Prices. Since prices continue to be a primary driver
of health care spending growth in Massachusetts and divert resources away from
smaller, community providers, the HPC recommends the following actions:
a. Establish Price Caps for the Highest Priced Providers in Massachusetts. As a complement to
the statewide benchmark, cap prices for the highest priced providers (i.e., limiting the highest,
service-specific commercial prices with the greatest impact on spending) and limit price growth (e.g.,
limiting annual service-, insurer-, and provider-specific price growth) to reduce unwarranted price
variation and promote equity.
53Recommendation 2: Constraining Excessive Provider Prices
Hospital Prices as Key Cost Driver
Activity in Rhode Island and Other States
Constraining Prices in Massachusetts
Next Steps
54Private health insurance spending is growing faster than Medicare and
Medicaid, largely due to price increases.
Cumulative growth in spending per enrollee by type of coverage since 2008; National Health Expenditures
60.0%
50.0%
40.0%
30.0%
20.0%
10.0%
0.0%
2008 2009 2010 2011 2012 2013 2014 2015 2016 2017 2018 2019
-10.0%
Private Health Insurance Medicare Medicaid
Commercial spending per hospital stay grew 14% from 2015 to 2018 compared to 6% for
Medicare.
Commercial spending growth per hospital stay is mostly driven by facility spending growth.
– Inpatient: facility prices grew 42%; physician prices grew 18% (2007-2014)
– Outpatient: facility prices grew 25%; physician prices grew 6% (2007-2014)
Cooper, Z., Craig, S., Gaynor, M., Harish, N. J., Krumholz, H. M., & Van Reenen, J. (2019). Hospital prices grew substantially faster than physician prices for hospital-
based care in 2007–14. Health Affairs, 38(2), 184-189; Peterson-KFF Health System Tracker: https://www.healthsystemtracker.org/chart-collection/u-s-spending-
healthcare-changed-time/#item-start 55There are increasing calls for constraining provider prices from the policy
and academic community.
“While the United States will likely continue to rely largely on markets to allocate health-care resources, overall market
forces have not been sufficient to contain commercial provider prices.”
- Chernew ME, Dafny LS, Pany MJ. “A Proposal to Cap Provider Prices and Price Growth in the Commercial Health Care
Market.” The Hamilton Project, March 2020
The Hamilton Project’s Proposed Approach
Set rate caps to limit prices for Propose setting the cap at five
health care services at the very top times the 20th percentile of the
of the commercial price distribution market’s truncated commercial
price distribution
Annual price growth caps specific to each insurer-
Three- provider-service combination to reduce (but not
pronged eliminate) price growth and provider price variation
approach
Flexible government oversight to address
potential evasion
Committee for a Responsible Federal Budget: Estimates a commercial hospital price cap at 200% of
Medicare rates would reduce commercial premiums by $889B (6%) and cost-sharing by $99 billion
nationally (2%) over 10 years.
Chernew, Dafny, Pany. The Hamilton Project proposal: Chernew ME, Dafny LS, Pany MJ. “A Proposal to Cap Provider Prices and Price Growth in the Commercial
Health Care Market.” The Hamilton Project, March 202. Available at: https://www.hamiltonproject.org/assets/files/CDP_PP_WEB_FINAL.pdf. Committee for a
Responsible Federal Budget. Health Savers Initiative: Capping Hospital Prices. Available at: Final_Capping Hospital Prices_022221 (crfb.org) 56Rhode Island was the first state to cap hospital prices (excluding
Maryland), but many states have now followed their lead.
Cap on state employee health plan payments for inpatient and outpatient
hospital services (average price of all services at hospital): Payments limited to
Montana
234% of Medicare rates
(2016)
State was able to secure all major hospitals in network, due partly to public
pressure from workers and unions
Cap on state employee health plan payments for inpatient and outpatient
Oregon hospital services (for each service individually): in-network services limited to
(2019) 200% of Medicare rates and out-of-network services limited to 185% of
Medicare rates
Created public options using public-private partnerships, with plans offered
Washington through private companies (like Medicare Advantage and Medicaid MCOs)
(2019) WA capped provider payments at 160% of Medicare rates
Colorado (2021) In CO, rates can’t be lower than 155% of Medicare, but the insurance
Nevada (2021) commission can mandate lower rates if insurers fail to meet the premium target
All three states set provider participation requirements
Department of Insurance set a target for commercial payer aggregate unit
price growth for non-professional services (inpatient, outpatient, and other
Delaware
medical services) of inflation (core CPI) plus 1 percentage point
(2021)
Progress on achieving the target will inform, but not determine, DOI’s rate
review decisions
Sources: https://www.crfb.org/sites/default/files/HSI_CappingHospitalPrices.pdf; Insurance Rate Review as a Hospital Cost Containment Tool: Rhode Island’s
Experience – The National Academy for State Health Policy (nashp.org); States’ Role in Combatting High Health Care Prices | Commonwealth Fund; How a public
option for health insurance works in Colorado, Nevada, and Washington – Vox; Delaware-Health-Care-Affordability-Standards-Report-Final-03042021.pdf; Oregon
Educators Benefit Board
Notes: Maryland’s longstanding All-Payer Rate System is a different model, but also serves to restrain hospital prices. See Rates (maryland.gov)
57Rhode Island’s Affordability Standards
In 2009, the Rhode Island Legislature passed a package of Affordability Standards
including mandated increases in the percentage of overall spending devoted to
primary care and constraints on hospital price growth.
Hospital inpatient and outpatient price growth from year to year was limited to
Medicare’s hospital update factor (later switched to CPI-U) plus one percentage point
(e.g., 2.7% in 2017-8).
Growth is measured as a given payer’s aggregate price increases (inpatient and
outpatient combined) for a given hospital.
The limit is enforced by the Office of the Health Insurance Commissioner via the rate
review process.
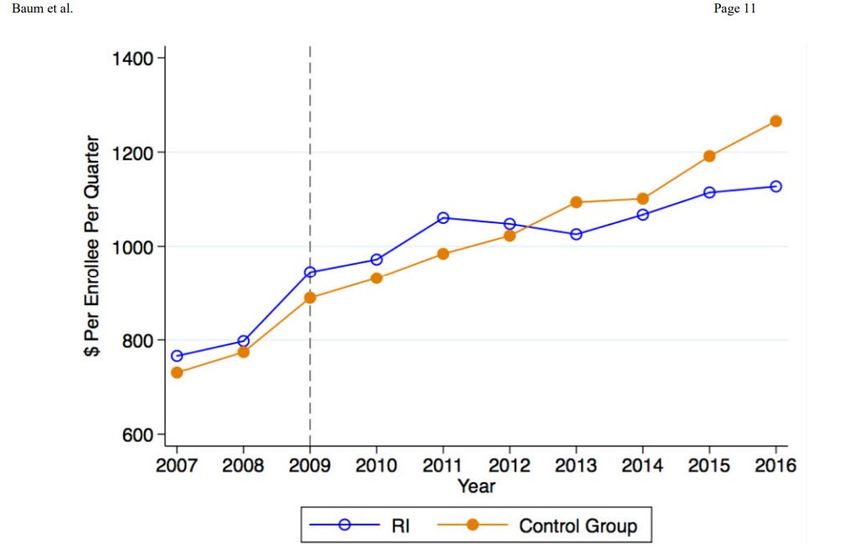
Notes: http://www.ohic.ri.gov/ohic-reformandpolicy-affordability.php 58Rhode Island’s reforms dramatically reduced spending.
Rhode Island’s spending was
initially above control states.
Spending growth declined in
Rhode Island starting in
2012; spending was 15%
below control states by 2016.
Most of the savings came via
a reduction in spending per
hospital inpatient visit.
Cost-sharing also dropped
markedly.
Quality of care was
unchanged.
“Rhode Island’s experience thus suggests that mandated price control measures may effectively leverage state regulatory
power to reduce healthcare costs, particularly in areas where the market power of providers is greater than insurers.”
– Baum et al. Health Affairs, 2019
Source: Baum, A., Song, Z., Landon, B. E., Phillips, R. S., Bitton, A., & Basu, S. (2019). Health care spending slowed after Rhode Island applied affordability
standards to commercial insurers. Health Affairs, 38(2), 237-245. 59Following reform, spending per hospital visit in RI decreased
significantly.
Source: Baum, A., Song, Z., Landon, B. E., Phillips, R. S., Bitton, A., & Basu, S. (2019). Health care spending slowed after Rhode Island applied
affordability standards to commercial insurers. Health Affairs, 38(2), 237-245. 60Prices (particularly hospital prices), are also the major driver of
commercial spending growth in Massachusetts.
Massachusetts price growth overall
– BCBS, Tufts and HPHC all reported annual prices grew from 2015-2018 more
than twice the rate of utilization.
– The Health Care Cost Institute found that Massachusetts commercial health care
prices grew 15.6% from 2014-2018 while utilization grew 7.0%.
Massachusetts price growth by category, 2016-8 (2021 Cost Trends Report)
– Hospital inpatient services: 9.1%
– Hospital outpatient services: 6.6%
– Office-based services: 4.4%
Source: HCCI 2018 Health Care Cost and Utilizaton Report. Available at: https://healthcostinstitute.org/interactive/2018-health-care-cost-and-utilization-report
Massachusetts Health Policy Commission. 2021 Cost Trends Report. Sept. 2021. Available at: https://www.mass.gov/doc/2021-health-care-cost-trends-
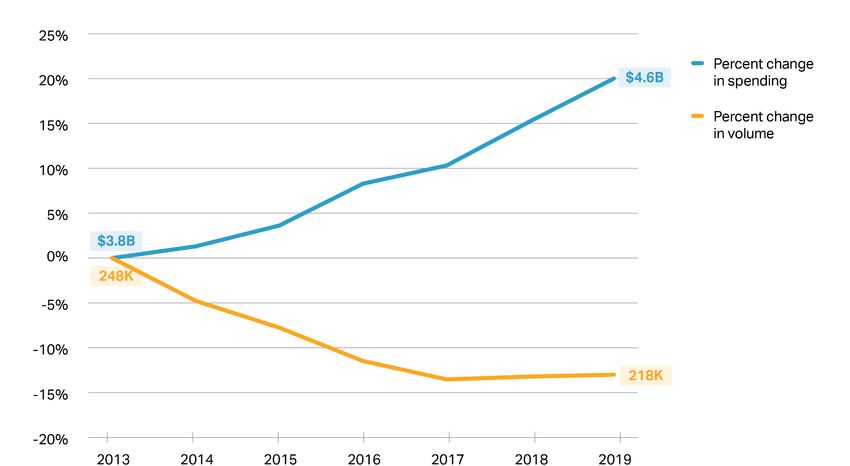
report/download 61Commercial inpatient spending on hospital stays grew 20% even as
volume declined 13% from 2013 to 2019.
Cumulative change in commercial inpatient hospital volume and spending per-enrollee (percentages) and absolute,
2013 – 2019
Spending per commercial
discharge grew 38%
(5.5% annually),
from $15,100 to $20,900,
from 2013 to 2019
5.5% growth in price per discharge has been divided roughly evenly between price
increases and acuity increases.
Notes: Data points indicate % growth from previous year (2013=0). Volume data correspond to fiscal years while spending data are calendar years.
Sources: CHIA Hospital Inpatient Discharge Data, 2013-2018. Commercial full-claims TME from CHIA Annual Report TME Databooks. 2019 Annual report (for 2017-
8 growth and 2016-7 growth), 2018 Annual Report (for 2015-6), 2017 annual report (for 2014-2015) and 2016 Annual Report (for 2013-4 growth). 62How do hospital price increases in Massachusetts compare to Rhode
Island’s growth cap?
Rhode Island limit on payer-hospital level (inpatient and outpatient combined) facility
price growth from 2017-8: 2.7%
For comparison:
Massachusetts aggregate hospital inpatient price growth 2017-2018:
– Facility and professional combined: 4.2% growth
– Facility only: 4.5% growth
Massachusetts aggregate hospital outpatient (HOPD) price growth 2017-2018:
– Facility and professional combined: 2.9% growth
– Facility only: 3.2% growth
Note: these are retrospective price growth estimates versus prospective rate increases
Notes: RI allowed amount of price growth can be found here:http://www.ohic.ri.gov/ohic-reformandpolicy-affordability.php.
Inpatient payment growth includes both facility and professional claims for an inpatient stay. Inpatient stays were identified by MS-DRG. Hospital outpatient price growth is
computed at the level of the procedure code encounter. Encounters are defined as the same person, same date of service, same procedure code. Overall average
percent price growth for inpatient and HOPD was weighted by 2018 aggregate spending for the procedure code in the respective setting. This methodology is available in
more detail in the 2021 Cost Trends Report.
Sources: HPC analysis of CHIA’s All-Payer Claims Database v8.0 63Limits on high price levels are needed as well.
“Capping prices [levels] can reduce the impact of provider market power while allowing prices to remain flexible beneath
the cap. Capping price growth ensures that prices can rise to reflect a changing economy, but not at runaway speed.”
- Chernew ME, Dafny LS, Pany MJ. “A Proposal to Cap Provider Prices and Price Growth in the Commercial Health Care Market.
Price growth caps are
important to reduce health care
spending growth, but do not
address unwarranted price
variation and could perpetuate
a cycle that disadvantages
many community hospitals.
Price level caps would affect
only the highest priced
providers and could help
mitigate these disparities.
64Aggregate payments relative to Medicare
0%
100%
150%
200%
250%
300%
350%
50%
The Mercy Hospital
Baystate Noble Hospital
Beverly Hospital
Morton Hospital
Good Samaritan Medical Center
New England Baptist Hospital
Brockton Hospital Inc.
Southcoast Hospitals Group
Anna Jaques Hospital
Steward St. Elizabeths Medical Ctr
Mass Eye & Ear Infirmary
Metrowest Medical Center
Lawrence General Hospital
excluded from figure if fewer than 250 services.
Boston Medical Center
Milford Regional Medical Center Inc
Lowell General Hospital
Emerson Hospital
Winchester Hospital
Henry Heywood Memorial Hospital
Steward Holy Family Hospital
Saint Vincent Hospital
Steward St. Annes Hospital
Mount Auburn Hospital
Baystate Medical Center
Cambridge Health Alliance
Marthas Vineyard Hospital
Steward Norwood Hospital
Nashoba Valley Hospital
Sturdy Memorial Hospital
Harrington Memorial Hospital Inc
Beth Israel Deaconess Medical Center
Hallmark Health System
South Shore Hospital
Hospital outpatient prices vary nearly threefold by hospital.
Newton Wellesley Hospital
Faulkner Hospital
Lahey Clinic Hospital Inc.
Umass Memorial Medical Center
Tufts Medical Center
North Shore Medical Center
Cooley Dickinson Hospital
from 2016-2018. Analysis based on commercial claims-level data contributed by self-insured employers and private health plans. Authors simulated Medicare
Berkshire Medical Center
Data from supplemental data files included in the report, Nationwide Evaluation of Health Care Prices Paid by Private Health Plans: Findings from Round 3 of an
payments using 3M software that applied Medicare payment rules to claims data. Data based on more than 100,000 services provided in MA hospitals. Hospitals
Employer-Led Transparency Initiative by Christopher Whaley et al, https://www.rand.org/pubs/research_reports/RR4394.html. Data represent aggregate spending
Falmouth Hospital
Aggregate commercial hospital outpatient payments to hospital relative to what they would have received from Medicare, 2016-2018
Cape Cod Hospital
Massachusetts General Hospital
Brigham And Womens Hospital
65Hospital inpatient prices vary twofold by hospital.
Aggregate commercial hospital inpatient payments to hospital relative to what they would have received from Medicare, 2016-2018
Data from supplemental data files included in the report, Nationwide Evaluation of Health Care Prices Paid by Private Health Plans: Findings from Round 3 of an
Employer-Led Transparency Initiative by Christopher Whaley et al, https://www.rand.org/pubs/research_reports/RR4394.html. Data represent aggregate spending from
2016-2018. Analysis based on commercial claims-level data contributed by self-insured employers and private health plans. Authors simulated Medicare payments
using 3M software that applied Medicare payment rules to claims data. Data based on more than 100,000 services provided in MA hospitals. Hospitals excluded from
figure if fewer than 100 inpatient stays. Specialty hospitals (Dana Farber, New England Baptist) also excluded. 66Price variation has persisted; volume and spending at high-priced
providers is growing.
The extent of price variation has not significantly diminished over time.
BCBS Acute Hospital Blended Relative Price Distribution 2010-2019
2.5
2
1.5
1
0.5
0
2010 2011 2012 2013 2014 2015 2016 2017 2018 2019
The volume at high priced providers is growing:
– The percentage of discharges from hospitals with prices 20% above average
grew from 23.8% in 2015 to 27.6% in 2019.
– The percentage of payments to hospitals in the top price quartile grew from
51.9% in 2015 to 54.3% in 2019
Sources: HPC analysis of data provided by the Center for Health Information and Analysis: Relative Price.
67There was wide variation in colonoscopy payments in 2018, with many
prices far above 200% of Medicare.
Facility price per colonoscopy encounter in Massachusetts, 2018
1400
150% 200% 250%
($1,260) ($1,680) ($2,100)
1200
1000
Number of Encounters
800
600
400
200
0
Percent of Medicare
21.7% of encounters were paid more than 200% of Medicare’s rates.
Spending for these services would be reduced by 4.8% if prices were limited
to 200% of Medicare.
Notes: The prices examined are for diagnostic colonoscopy CPT 45378. The Medicare prices represent the payment for Suffolk county. Prices are shown as percent
of Medicare payment.
Sources: HPC analysis of CHIA’s All-Payer Claims Database v8.0; Medicare data 68There was also wide price variation for hip and knee inpatient
procedures.
Facility spending per major joint replacement (DRG 470) in Massachusetts relative to Medicare base rate, 2018
600
150% 200% 250%
($22,571) ($30,095) ($37,619)
Number of Inaptient Stays 500
400
300
200
100
0
40%
50%
60%
70%
80%
90%
100%
110%
120%
130%
140%
150%
160%
170%
180%
190%
200%
210%
220%
230%
240%
250%
260%
270%
280%
290%
300%
More
Percent of Medicare
Using Medicare’s base rate as a comparison (excluding DSH and teaching add-ons):
– 25% of encounters were paid more than 200% of Medicare’s rates.
– Spending would be reduced by 4.8% if prices were limited to 200% of Medicare.
Using Medicare’s hospital specific rates as a comparison (including DSH and teaching):
– 12% of encounters were paid more than 200% of Medicare rates.
– Spending would be reduced by 1.7% if prices were limited to 200% of Medicare.
Notes: HPC created inpatient stay episodes and assigned an MS-DRG to each episode. All facility payments associated with an inpatient stay for MS-DRG 470 were
included in the facility spending for a given service. Spending is shown as a percent of Medicare’s base rate.
Sources: HPC analysis of CHIA’s All-Payer Claims Database v8.0; Medicare data 69Options for Setting Price Benchmarks
The Hamilton Project’s Proposed Approach uses a benchmark based on private rates
(5 times the 20th percentile of the distribution* of private prices).
– A private rate-based benchmark would be more influenced by local market
conditions
Many states use Medicare-based benchmarks.
Medicare hospital payments are designed to be consistent with an efficient
hospital’s costs.
• For efficient hospitals in 2019, Medicare paid 1% below their cost
• For other hospitals in 2019, Medicare paid 7% below their cost
Thus, a payment benchmark of 200% of Medicare is providing a 90+% markup over
cost for an average hospital.
Medicare spending growth is consistent with the Massachusetts benchmark.
– In Massachusetts, from 2016 to 2019:
• Commercial spending per enrollee grew 3.7% per year
• Medicare spending per enrollee grew 2.4%
MedPAC report to the Congress, March 2021.
*In some cases, the distribution would first be truncated to remove high-cost outliers.
70Next Steps
Further research and development of spending
measures that are less influenced by changes in coding
intensity, and further documentation of coding trends.
Further exploration of the implications of different price
benchmarks, including both savings estimates and
distributional impacts (which providers, impacts on
health equity).
Further research on how to implement growth and level
price caps (e.g., different levels of aggregation –
hospital-wide average or service-specific).
71AGENDA Call to Order Approval of Minutes from June 2, 2021 (VOTE) Report Findings: Children with Medical Complexity in the Commonwealth HPC 2021 Policy Recommendations Schedule of Upcoming Meetings
2021 Meetings and Contact Information

   BOARD MEETING          ADVISORY COUNCIL     COST TRENDS

     December 14              December 8        November 17

    Mass.gov/HPC             @Mass_HPC       HPC-info@mass.gov

                                                                 73 7
Appendix
Detail on Identifying Children with Medical Complexity
Identified CMC in claims and discharge data using a combination of diagnoses and utilization
The Pediatric Medical Complexity Algorithm1 is a diagnosis code-based tool to identify CMC in
administrative data, using medical, mental, and behavioral diagnoses to flag individuals under 22 years
old as having non-chronic, non-complex chronic, or complex chronic conditions
– Healthy individuals with utilization but no diagnoses (e.g., well visits) are flagged as non-chronic
The PMCA flags medical complexity using a more- and less-conservative definition of complexity, based
on the number of claims per body system of diagnosis for at least two body systems. Less-conservative
flags with at least one claim, more-conservative flags with at least two
However, diagnosis codes alone may inaccurately flag largely asymptomatic children as CMC while
omitting CMC without clear diagnoses2,3
– Diagnoses alone do not account for health service needs or functional impairments
– Diagnoses exclude individuals whose conditions are not defined by clear diagnoses or who have
trouble accessing needed care
Identifying CMC in the APCD:
– Refined the complex chronic and non-complex chronic cohorts flagged with the less-conservative
definition to flag individuals with multiple years in the top 10% of spending, any inpatient utilization,
≥2 months home health spending, or ≥2 types of DME or supplies as CMC
Identifying CMC in the Hospital Inpatient and Emergency Department Discharge Databases:
– Treated discharges flagged by the PMCA with the less-conservative as complex chronic as
equivalent to CMC
1 Simon TD, Cawthon ML, Stanford S, Popalisky J, Lyons D, Woodcox P, Hood M, Chen, AY, Mangione-Smith R. Pediatric Medical Complexity Algorithm: A New
Method to Stratify Children by Medical Complexity. Pediatrics. 2014; 133(6): e1647-e1654.
2 Cohen E, Kuo DZ, Agrawal R, Berry JG, Bhagat SKM, Simon TD, Srivastava R. Children With Medical Complexity: An Emerging Population for Clinical and
Research Initiatives. Pediatrics. 2011; 127(3): 529-538.
3 Reuland CP, Collins J, Chiang L, Stewart V, Cochran AC, Coon CW, Shinde D, Harguani D. Oregon’s approach to leveraging system-level data to guide a social
determinants of health-informed approach to children’s healthcare. BMJ Innovations. 2020; 7(1): 1-8. 75Commercially-insured CMC and non-CMC and Medical Spending per Member per
Year by Provider Organization, 2018
Non-CMC spending CMC spending CMC spending
Non-CMC CMC Percent CMC
(Mean) (Mean) (Median)
Acton Medical Associates 1851 66 $1655 $24610 $12080 3.4%
Atrius 21741 1010 $1543 $30192 $13479 4.4%
BIDCO 4838 220 $1644 $27380 $14265 4.3%
BMC 2922 85 $1452 $31891 $16242 2.8%
Baystate 5837 220 $1343 $28927 $14829 3.6%
Children's Medical Center Corporation 42552 2434 $1834 $31599 $14145 5.4%
Lahey 6365 263 $1671 $28993 $15951 4.0%
MACIPA 2359 94 $1713 $28118 $13243 3.8%
Other 2089 93 $1642 $30756 $13185 4.3%
Partners 31011 1553 $1872 $28798 $14121 4.8%
Reliant 5434 224 $1518 $30020 $16191 4.0%
South Shore 4509 220 $1739 $29075 $13616 4.7%
Southcoast 1093 42 $1474 $22189 $14027 3.7%
Steward 13418 574 $1647 $34651 $13435 4.1%
Sturdy Memorial Foundation 1002 32 $1696 $21788 $12973 3.1%
UMass 9238 396 $1520 $37844 $17243 4.1%
Unattributed 10142 470 $1592 $30812 $13366 4.4%
Wellforce 23129 1005 $1658 $29349 $13908 4.2%
Notes: “Other” includes provider groups withYou can also read