Measuring Market Power in the IPO Underwriter Industry - Yue Cai Waseda INstitute of Political EConomy
←
→
Page content transcription
If your browser does not render page correctly, please read the page content below
WINPEC Working Paper Series No.E2108
 May 2021

Measuring Market Power in the IPO Underwriter

 Industry
 Yue Cai

 Waseda INstitute of Political EConomy
 Waseda University
 Tokyo, Japan
Measuring Market Power in the IPO Underwriter
 Industry
 Yue Cai1
 Waseda University
Abstract: This paper study underwriter’s competitive behavior in the Japanese IPO

underwriting markets. We use demand estimation techniques to obtain marginal costs, and

empirically compare several models of conduct. We find that differentiated product Bertrand,

partially collusive models are rejected against the perfectly collusive models. We conclude

that spreads in the Japanese IPO underwriting markets are consistent with the collusive

pricing behavior. Underwriters seem to internalize the effect of their spread on their rivals.

1. Introduction

 The existence of collusion in the IPO underwriting market has received increased

attention.2 Economists are divided on the issue whether the spread of the IPO service is

determined by collusive pricing behavior.3 The literature is less conclusive. Chen and

Ritter (2000) present the facts that IPO underwriting spreads in the U.S. with proceeds

greater than 30 million dollars above competitive levels. They argue that IPO

underwriting spreads in the U.S. cluster at 7%, and that this serves as evidence for

implicit collusion. Using 30 years of U.S. IPO data, Lyandres, Fu and Li (2018) also find

that the empirical results largely support the implicit collusion. On the other hand,

Hansen (2001) supports the view that cluster IPO spread is the result of increased

1
 Email: caiyue02@gmail.com.
2
 For example, “The failure of underwriting fees to adjust after the crisis raises important questions about
the competitive structure of investment banking and regulatory toward is,” (“OECD criticizes high fees and
tacit collusion in IPO underwriting.” Financial Times, 31 May. 2017). “The UK financial watchdog has used
its powers for the first time to find three investment groups guilty of breaching competition law, imposing
414,900 at the end of an three-year investigation into price collusion in the initial public offering market”
(“Regulator fines two asset managers over IPO price collusion.” Financial Times, 21 February. 2019).
3
 Several theoretical papers have explored the hypothesis of implicit collusion. In a symmetrical underwriter
setting, Chen (2001) dictates that the conditions on the discount factor would support implicit collusion as an
equilibrium. Hatfield, Kominers, Lowery and Barry (2020) propose a repeated extensive form game model to
explain why collusion becomes easier in IPO markets when market concentration decreases. These two
studies provide the theoretical basis for the existence of collusion in the IPO underwriter market. In contrast,
Gordon (2003) proposes a different theory. By considering a model with differentiated underwriters and
heterogeneous issuers, he finds that in equilibrium, underwriters will charge approximately the same spread.
The spreads could be the result of non-cooperative behavior.
 1
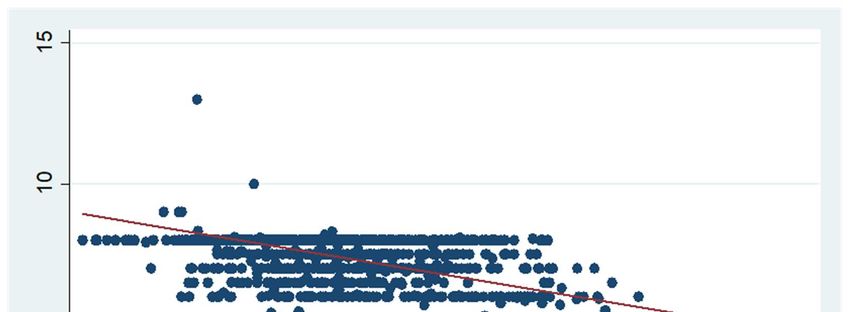
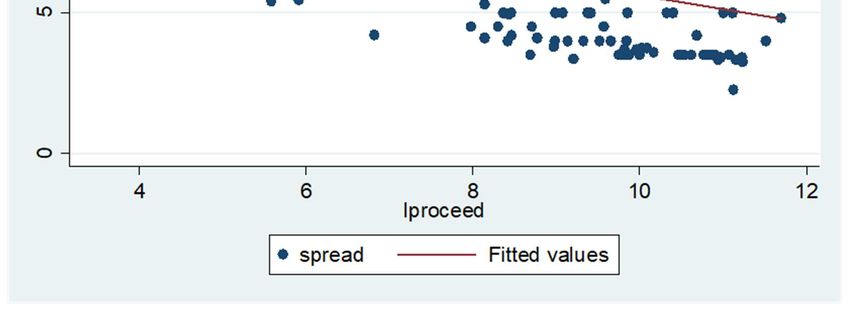
competition along non-price dimensions. Torstila (2003) also argues that clustering

spread patterns are not necessarily collusive. This debate has gained even more

importance because if there is an excessive spread of collusion in the market, there will be

an unnecessarily high social cost.4

 To test collusive hypothesis empirically, one must identify the level of competition in

the underwriting market. Several challenges limit existing empirical studies. This

identification confronts a classic problem, as the observed spread reflects both supply-side

and demand-side influences on the spread. When we observe an increase in the spread,

this may be due to the collusion of the underwriters, or it may be due to underwriters

received a correlated shock to marginal cost. Figure 1 illustrates a scatter diagram

relating proceeds and spreads of the Japanese IPO market. We can observe that there is

indeed a certain clustering of spreads between 6% and 8% bands, which is consistent with

the collusive hypothesis. But on the other hand, we can also observe the existence of

significant economies of scale. The bigger the proceed, the lower the spread. Without

additional restrictions, it is difficult to decide whether collusion is taking place just by

looking at data on spreads and proceeds. Testing for the nature of competition requires a

structural approach, in line with the approach suggested by much of the industrial

organization literature.

 This article contributes to this important debate by empirically understand the

nature of underwriter competition in the Japanese IPO underwriter market. It goes

beyond the previous research by using an empirical demand estimation. We draw data

from IPO underwriting markets in Japan, which is characterized by high concentration

and numerous entries of new underwriters. These characteristics may make this industry

an ideal setting of underwriting markets with nearly collusive pricing behavior. We begin

our empirical analysis with a reduced-form regression analysis that uses IPO data from

2002 to 2020 to understand the pricing patterns of the Japanese IPO underwriting

4
 According to Abrahamson, Jenkinson and Jones (2011), as underwriting fees are more expensive in the US
than in Europe, US companies could save an average of $1 billion per year if they could pay the European fees.
The commissioner of the Securities and Exchange Commission Robert J. Jackson, Jr., stated that
entrepreneurs need to pay 7% of what they create to go public and this disguised “IPO tax” may have
discouraged companies from going public.
 2
markets. The results of the preliminary analysis are not inconclusive. We find a negative

relationship between market concentration and price dispersion, which is consistent with

the hypothesis that collusion narrows price dispersion. On the other hand, we also found

that market concentration and the market share of bank-owned securities firms did not

have an impact on spreads. The reduced-form results cannot decide whether collusion is

taking place.

 Next, we introduce a framework of differentiated products to model the demand for

underwriter services. This feature allows a better description of the facts of collusion. We

estimate underwriter-level demand and then use the estimates jointly with pricing

behaviors implied by different models of underwriter conduct to recover marginal cost,

without observing actual costs. This allows me to evaluate which of the candidate models

best fits the data.

 The first step is the estimation of demand function. Issuers seeking IPO underwriting

service as choosing from among several underwriters, with each potential investment

bank offering service that are valued differentially by each client issuer. Each issuer

considers how well that attributes of each underwriter’s service match its needs and

chooses the underwriter offering best net value as lead managing underwriter. Client

firms’ choices of underwriter depend on the spreads offered by the underwriters,

underwriter reputation (underwriter asset size, average underpricing) and issuer’s

characteristics (average issuer asset size, average issuer asset leverage and average

secondary share portion). Our analysis treats IPO underwriting services as a

differentiated service, meaning that client firms do not see all IPO underwriting services

as perfect substitutes. If underwriting service is differentiated, all choices of underwriter

should not be driven by fees alone. This feature has been confirmed by several previous

studies. Liu and Ritter (2011) find that issuers care about non-price dimensions of IPO

underwriting such as industry expertise and analyst coverage. Fernando, Gatchev, May

and Megginson (2015) provide evidence of price and service differentiation based on

underwriter reputation. Issuer’s demand is identified from aggregate market shares.

Based on the realities of the Japanese IPO market, we assume that firms first choose

 3
between two broad classifications, the “Big 3” and other investment banks, and then

choose investment banks within each classification. Then, following Berry (1994), the

demand estimates can be obtained from a linear instrumental variable regression of

differences in log aggregate market shares on IPO service characteristics, spreads, and the

log of the within group share. We find that underwriters face downward-sloping demand

curves.

 The second step, we test underwriter conduct. Once the demand function is estimated,

it can be used in turn to back out the marginal cost implied by three industry structures:

Bertrand competition, partial collusion and joint profit maximization. We then use the

Rivers and Vuong (2002) test for selecting the model that best fits the data. The results

suggest that the marginal cost implied by the joint profit maximization models best fits

the data. This implies that pricing in the IPO underwriting markets is collusive. We also

found that Bertrand competition fitted the data better in 2002 when the participation

effect of bank competition was stronger, but this effect disappeared afterwards. This is

consistent with Hatfield et al. (2020) that market entry may facilitate collusion in

syndicated markets.

 Our approach is based on a credible demand estimate. There are two main issues

that need to be presumed to exist. First, spreads are related to some unobserved factors,

for example, underwriter quality. We use two main methods to combat this problem. The

first method uses the nature of panel data to add underwriter and year fixed effects to the

analysis. The second method uses instrumental variables. Following Berry, Levinsohn,

and Pakes (1995), the instruments are derived from the competition within market.

Oligopolistic competition makes spread as a function of rival characteristics and cost

shifters. Hence, characteristics and cost shifters of rival can be used as valid instruments.

The second issues the feature of logit model is that it imposes the independence of

irrelevant alternatives (“IIA”) property. The IIA property can result in non-realistic

substitution patterns. The “Big 3” Japanese securities firms (Nomura, Daiwa and Nikko)

have a longer history and higher reputation than other firms. Based on this characteristic,

we have introduced the nested structure to address the IIA issue. We assume that the
 4
issuer could decide whether select the “Big 3” or other securities firms as underwriter,

then within that choose an underwriter. In this case, IIA holds within a nest, but not

across nests.

 This paper contributes to the finance literature on an ongoing debate as to whether

IPO spreads are set in a collusive manner. Chen and Ritter (2000) examine several

features of the IPO spread and argue that the spread is above competitive levels.

Abrahamson et al. (2011) and Lyandres et al. (2018) also provide results consistent with

implicit collusion. They show the existence of collusive behavior using a reduced-form

approach. On the other hand, Hansen (2001) provided evidence that was inconsistent

with collusion. He argues that underwriters compete based on reputation. Ljungqvist,

Jenkinson, and Wilhelm (2003) also provide relevant evidence that higher spreads for

non-U.S. IPOs are largely due to its long-standing low-cost fixed-spread method.

Previous literature has relied on the approach regressing the IPO spread on variables that

capture underwriter and issuer’s characteristics. The theoretical and regression results

are then compared with each other to determine whether the regression results are

consistent with the collusive hypothesis or the competition hypothesis. The above

approach has provided very important results, but there are certain limitations. Our

paper’s contribution is to perform a direct econometric test to evaluate a set of candidate

models (Bertrand competition versus collusion) through the discrete choice demand

estimation methods. To the best of our knowledge, this is the first paper that studies the

IPO underwriter competition using demand estimation.

 The most similar study to ours is Kang and Lowery (2014). They estimate a model

for the process for setting IPO spreads and find optimal collusion would lead to the

observed clustering on spreads. Our study differs in two main respects. First, our interest

is in testing underwriter conduct, whereas the focus in Kang and Lowery is in estimating

the value of the IPO process. Second, their estimation focuses on the 10%/7% spreads.

Our approach is not based on this assumption and can therefore applied to IPO market in

many other countries where rigid spread is not common.

 The remainder of the paper is organized as follows: Section 2 introduces institutional

 5
details. The summary statistics for the data used in the analysis are described in Section

3. Section 4 carries out some preliminary regression analysis of spread setting. Section 5

introduces the model for estimation and summarize our findings from the estimation.

Section 6 concludes.

2. Institutional Details

 Stigler (1964) provides a general framework for evaluating the characteristics of the

market that may facilitate a move toward coordination. The logic of this framework is

that, for collusion to be viable, the participants must be able to agree on the terms of

coordination; they must also be able to monitor whether colluding participant complies

with this agreement; there must be a penalty for deviating from the agreement, and the

penalty mechanism must be credible, i.e. enforcement. This section introduces some of

the important institutional details are important for understanding the conditions for

agreement, monitoring and enforcement in the IPO underwriter industry.

2.1. Agreement

 Colluders must reach an understanding of the specific dimensions of the coordination.

We must therefore consider whether there are dimensions of coordination that may occur

in the IPO underwriting industry, as well as indications of expected behavior. IPO is

usually underwritten by a syndicate of underwriters. The syndicate is handled by a lead

underwriter. The syndicate makes a commitment in which the underwriters agree to

assume the risk of buying the entire inventory of stock issued in the IPO and sell to the

public at the IPO price. For its services, the syndicate receives a gross spread, which they

can distribute as agreed. Ellis, Michaely and O’hara (2000) find that underwriter

compensation in IPOs arises mostly from fees charged. Torstila (2001) quotes the

Timothy Main, head of the equity syndicate desk at J.P. Morgan says "For every minute

spent negotiating the gross spread with the client, we probably spend well over 20 times

negotiating the split of the gross spread among various underwriters and co-managers"

(Picker, 1998). Thus, gross spread can be a potential focal point around which

underwriters can coordinate their behavior.

2.2. Monitoring

 6
There is a real possibility that firms can quickly retaliate by making more frequent

price adjustments when one market participant undercuts another. However, oligopoly

theory suggests that such deviations must first be detected by other participants (Ivaldi

et al., 2003). As a result, reliable data on prices and other information about the industry

will make collusion easier.

 The spread and other information about IPO will be included in terms and conditions

of the offer in the prospectus published on approval of the listing. Hence, the first

important thing is that in the IPO market participants have relatively easy access to

individual data, and it is easier to identify a deviant underwriter than aggregate data.

There is little time lag between the pricing period and pricing publication period. In 1997

Japan introduced the book-building approach to the IPO process. Under this method, the

spreads charged by the underwriters are available in the amendment filed before the

public date. In this sense, the disclosure of information required during the IPO

application process may facilitate coordination, as they can significantly increase the

amount of information available to competitors.

2.3. Enforcement

 In the theory of tacit collusion, enforcement behavior is mainly through the imposition

of credible penalties on deviating firms, or for all participants when deviant firms are

found. A tacit collusion environment is predicted to be stable, if deviating from a

collusive agreement is relatively easy to detect and if credible penalties for cheating exist.

Hatfield, Kominers, Lowery and Barry (2020) argued theoretically that the coercive

penalties of the syndicated industry make collusion easier. When the IPO market is very

concentrated, “grim trigger” remains valid. And when the market is not very

concentrated, underwriters punish a price undercutter by refusing to join an

undercutter’s syndicate. This penalty is effective because in the IPO underwriting

underwriter need to work together to spread the risk. The returns of joint working are

higher when market concentration decreases.

3. Data and Descriptive Statistics

3.1. Data

 7
We draw our IPO sample from the Nikkei NEEDS financial data. The database

contains information on 1,342 IPOs between 2002 and 2020. This includes the offer price,

the amount underwritten by each underwriter, the amount of funds raised, the number of

shares to be sold, the number of shares to be newly issued. The financial data of each

company and underwriter were collected and connected from Nikkei NEEDS Financial

Quest. When combined with company financial data, 45 IPOs in the sample had no

specific information and were therefore removed from the sample. The 119 IPOs were

removed when combined with lead underwriter financial data as some underwriters do

not report financial data at a frequency of four and a half periods. Our final sample

consists of 1,178 IPOs by Japanese firms between 2002 and 2020.

3.2. Summary Statistics

 Panel A of Table 2 shows summary statistics for IPO information. The average gross

spread associated with employing the investment banking syndicate is 7.33%, which is

comparable to past studies (Chen and Ritter, 2000; Koda and Yamada, 2017). Kutsuna

and Smith (2004) report that this cost was 4.07% prior to 1999, so the 7% average gross

spread is much higher than what Japanese companies would have paid. From Figure 2,

we can also see that the median spread has also been increasing over the sample period,

but the dispersion of spread is decreasing. This trend suggests that the spread has

increased towards a fixed value between 2002 and 2020. Third row of Panel A report

mean underpricing. Particularly high levels of underpricing are observed in our sample

periods, underpricing averages 29.6%. This value is similar to the average of 32.9%

Kutsuna and Smith (2004) reported between 1995 and 1999.

 Panel D shows the summary statistics for underwriter-market characteristics. I

compute the market shares over the whole market of new issues at different time periods.

We set each annual quarter as a market. The average HHI ratio using proceeds is 0.133.

As a result of the significant entry of banks, the average HHI is 0.118 in 2002, but it has

increased since 2008, reaching a peak of 0.376 in 2011 as shown in Figure 3. “Guidelines

for the Antimonopoly Act on the Review of Business Combinations” issued by the Japan

Fair Trade Commission stipulates that when the HHI is under 0.25 and the company’s

 8
market share is under 35%, the risk of substantially restricting competition is normally

considered to be small. Hence, the concentration level of 0.376 is relatively high from a

regulatory perspective and is higher than most other financial services.5 After 2013,

however, the market concentration declined, falling to a minimum level of 0.041 in 2020.

This tendency contrast with the change in average spread. The average price has been on

an upward trend and reached its highest point level 7.83 in 2020.

4. Preliminary Regression Analysis

 Having described several features of the industry that suggest a lack of competition, we

focus in this section on testing multiple theoretical hypothesis for collusion, as suggested

by Ivaldi, Rey, Seabright and Tirole (2003). We provide number of tests for collusive

behavior.

4.1. Market Concentration

 When the industry is less concentrated, each underwriter will get less share of the pie

because they must distribute these profits. In the short term, the smaller is an

underwriter’s allocation, the gain from undercutting the collusive price is greater. In the

long term, the cost of deviating is increased precisely because the non-collusive outcome

is more competitive. Collusion is then more difficult with lower concentration. This

intuition is the basis for our first preliminary empirical test, which we use the

Price-Concentration regressions.

 log , = hhi HHI + , + + , + Industry + + , , (1)

We use log spread as our left-hand side variable, , is the spread for underwriting IPO

of firm . The , Vector includes controls for time-varying underwriting factors (i.e.,

underwriter asset, underwriter’s selling, general and administrative expenses, underwriter

financial cost). The , vector includes the natural logarithm of total firm assets and

firm’ leverage ratio. , includes controls for IPO factors (i.e., the natural logarithm of

5
 According to data published by the Japan Fair Trade Commission, the concentration of e-money and
damage insurance industry in 2013 was 0.241 and 0.24 respectively, compared to 0.376 for IPO underwriting
service. (Link: https://www.jftc.go.jp/soshiki/kyotsukoukai/ruiseki/index.html)
 9
proceeds, underpricing, and secondary share portion). We include industry-level and

underwriter-level dummies to control for time-invariant unobservable effects. We

estimate the regression using OLS and cluster standard errors at the quarter level. We

then test the hypothesis that market concentration leads to more collusive behavior if

 hhi > 0.

 The results of estimating (1) are reported in Table 3. In column 2, the coefficient on the

HHI is positive and insignificant. When using spread as the left-hand variable, we also

found positive insignificant coefficients. This result suggesting a positive, statistically

insignificant, relationship between market concentration and spread.

4.2. Market Concentration and Spread Dispersion

 Some empirical studies have found that collusive pricing behavior is characterized by

rigid price (Abrantes-Metz, Froeb, Geweke and Taylor, 2006; Vickers and Ziebarth, 2014;

Ciliberto, Watkins and Williams, 2019). The basic theoretical logic put forward by Athey,

Bagwell and Sanchirico (2004), is that collusive firms do not adjust their prices after

privately observed cost shocks. Such price rigidity diminishes the information costs that

colluding firms face to ascertain whether any of the competitors has reduced its prices.

Theory and the results of empirical studies suggest that prices become less variable

during the period of collusion than during periods of relative competition. Since collusion

is easier when the industry is more concentrated, we should be able to observe that

spread dispersion is lower when the industry is more concentrated. In this section, we

discuss the tests for how spreads change, beyond just a change in average spreads.

 We use quantile regression to implement our test of spread dispersion. Specifically, we

re-estimate Equation (1) above for 10th and 90th percentiles. If the theoretical effect of

how collusion should affect spread dispersion prevails, an increase in concentration will

increase the lower-percentile spreads than higher-percentile spread, decreasing the overall

degree of spread dispersion.

 In columns (1) and (3) of Table 4, the result from quantile regression verify that the

market concentration increases the 10th percentile spread level by more than the 90th

percentile level. These results suggest a negative relationship between market
 10
concentration and price dispersion in the IPO industry, lending support to the collusive

behavior theory.

4.3. Competitive Pressure from Banks

 The third test focuses on the competitive pressures brought about by the banks. The

1999 abolition of the Financial System Reform Act allows Japanese banks to enter the

equity underwriter market through investment bank subsidiaries. Commercial

bank-affiliated investment banks became the lead underwriters for common stock by May

2000 (Suzuki, 2010). Market shares by bank underwriters increases since 2002 (Koda and

Yamada, 2017). Prior studies have also found that the entry of bank-subsidiary

investment banks can a favorable competitive effect on gross spreads (Gande, Puri and

Saunders, 1999; Takaoka and McKenzie, 2006). And in the underwriting market, banks

can use the private information from firm-bank relationships to differentiate their

services and offer lower spreads (Yasuda, 2007, Koda and Yamada, 2017). Competitive

pressure reduces the potential cost of deviation in terms of foregone future profits,

regardless of the past behavior of the incumbent firm. Underwriters would then be more

tempted to undercut collusion. To test this prediction, we estimate the following

regression:

 log , = Bank Share Bank ℎ + , + + , + Industry + + , , (2)

Left-hand side variable and control variables are same as in Equation 1. Thus, bank

attempt to measure the competitive effect of bank subsidiaries over times. Bank share is

the bank share (in percentage terms) of proceed. Bank share is the ratio of proceed by all

bank subsidiaries in each market to total market proceed. We also include bank

subsidiaries dummy. Bank is a dummy variable that takes 1 when bank-subsidiary

investment banks and 0 otherwise. Table 5 represents the estimates of Equation (2). The

coefficient on the bank share is negative and insignificant. The overall market share of

bank-owned securities firms did not have any impact on spreads. The coefficient of the

bank dummy which is negative and statistically significant at the 1% level. The results do

suggest that banks offer lower spreads, which is consistent with Koda and Yamada (2017).

 11
As we found in Test 1, however, we do not find that the market share of banking

securities firms has a substantial effect on the average spread.

5. Empirical Results

5.1. The Demand Estimation

 In the preliminary analysis, we did not get clear results. To be able to use data to

decide whether underwriters are competing or colluding, we estimate the demand for IPO

services. We apply revealed preference demand estimation framework. It is common in

many fields of economics, but not found in the IPO underwriter literature.6 Each time

period = 1, … , , potential issuers seeking IPO services as choosing from among

several underwriters, each potential underwriter offering different aspects of service that

would be valued by each issuer. As the standard of literature, the value of this issuer is a

function of observed and unobserved characteristics of the issuer and the service offered

by the underwriter.

 , , = , − , + , + , + (1 − ) , , = + , + (1 − ) , , (3)

where is the mean utility depends on , . , is a vector of observed underwriter

service characteristics of underwriter . , is an unobserved quality measures for

service. Referring to Cardell (1997), the issuer-specific preference is captured by a

common deviation for all underwriters in group , , , and a deviation specific to

underwriter , , . , is assumed to be a mean zero stochastic term with i.i.d. extreme

value Type I distribution.

 Following Schroth (2006), we assume that issuers have different needs, thus they

choose a type of underwriters first, and then choose an underwriter. We allow issuer’s

valuations to be correlated within groups. determines the within-group correlation. If

6
 Schroth (2006) estimate the issuer’s demand of underwriting services. Demand estimation had been used in
finance literature such as demand for banks (Dick, 2008; Ho and Ishii, 2011; Egan, Hortaçsu, and Matvos,
2017; Crawford, Pavanini and Schivardi, 2018), mortgages (Benetton, 2018), mutual fund (Gavazza, 2011)
and insurance (Koijen and Yogo, 2016). In studies related to financial intermediation in Japan, this
methodology has been applied to loan markets (Uchida and Tsutsui, 2005; Ogura, 2020).
 12
 → 1, then services within group become more correlated, and hence more substituable

with each other. If → 0, the grouping of underwriter is less relevant for issuer’s choices,

which can be problematic. When = 0, the model approaches a logit model. In the logit

model, the heterogeneous preference of the issuers for underwriter are assumed to be

independent of each other, thus limiting the substitutability between underwriters and

excluding the possibility of a higher degree of substitutability among similar

underwriters. 7 The nested logit model relaxes the assumption of independence of

preferences of issuers, allowing for a positive correlation between issuers’ preferences for

similar underwriters.

 Following the Berry (1994), the closed form within-group market shares predicted by

the model ̂ , / = Pr( , + , + (1 − ) , > , + , + (1 − ) , , ∀ ∈ , ≠ ) and

the total market share of g groups can be written as

 , ,
 ̂ , / = exp / exp (4)
 (1 − ) ∑ (1 − )
 ∈

 (1− )

 ∑ exp (1−
 ,
 ))
 ( ∈
 (1− )
 ̂ , = = (5)
 ∑
 (1− ) (1− )
 ,
 ∑ ∑
 ′ =0 ( ∈ ′ exp (1− ))
 ′ =0 ′

where = ∑ ∈ exp (1−
 ,
 ). The overall market share ̂ , is

 exp(1−
 ,
 )
 ̂ , = ̂ , / ⋅ ̂ , = (6)
 ( ) ∑
 (1− )
 ′ =0 ′

As Berry (1994) shows, it is possible to aggregate the individual choices and derive the
equation to estimate the nested logit model. The market share of outside services is

7
 This can be vicious when we consider the spread changes. For example: Suppose a top investment banks
(e.g. Nomura) has the same market share as another ordinary investment bank. If another top investment
banks (e.g. Nikko) raise the spread, the issuer substituting away from the Nikko will switch equally to the
Nomura and to the ordinary investment bank. This is not a reasonable substitution patterns, because
Nomura and Nikko offer close varieties and ordinary investment bank offers a different service.
 13
1
 ̂0 = 1−
 (7)
 ∑ ∑ exp ( , /(1 − ))
 ( ∈ )

From (5) and (7), we have
 1−
 ̂ ⎛ ⎞ exp( , /1 − )
 = ⎜ exp ( , /(1 − ))⎟ = (8)
 ̂0 ⎜∑ ⎟ ̂ |
 ⎝ ∈ ⎠

From (6), we can derive

 ̂ , / ̂0 = ̂ , / ⋅ ( ̂ , / ̂0 ) (9)

Taking logs of (9),

 ̂ ̂
 ln = ln + ln( | ) = , − (1 − )ln( | ) + ln( | ) = , + ln( | ) (10)
 ( ̂0 ) ( ̂0 )

Setting , , − , + , and substituting in from (10) for , gives

 ln , − ln 0, = ln / , − , + , + , (11)

where , and can be estimated with an Instrumental Variables estimator. We use

underwriter-quarter level aggregate proceed to measure the output for each underwriter

 , . The market share of underwriter is

 , = , /(1 + ) ,
 ∑
 =1

Our dataset includes only the observations who went public and whose lead underwriter

is identified. Following Ho (2010), we apply a scaling factor = 0.1 captures the

potential market size in addition to the existing issuers. Potential outside opportunities

regarding IPO services could be acquisition. IPO and acquisition are two of the most

typical “exit” choice for private firms (Chemmanur, He, He and Nandy, 2016). And the

share of the outside service is

 0, = 1 − ,
 ∑
 =1

Within-group market share is

 14
 / , = , / ,
 ∑
 ∈

Prices , are the underwriter-quarter level average spread charged by the underwriter

 . , is the underwriter-specific unobservable variable. This accounts for the various

aspects of underwriter quality. , include underwriter asset size, average issuer asset

size, average issuer asset leverage, average underpricing and average secondary share

portion. We calculate these averages according to the underwriter-year level. Average

underpricing and underwriter asset size reflect the attributes of the services provided by

the underwriter. Larger underwriters are more likely to have more influential analysts.

And those with lower underpricing levels have higher reputations (Binay, Gatchev and

Pirinsky, 2007). Reputation of analyst and overall reputation of underwriter are two

criteria that issuers use in selecting a lead IPO underwriter (Brau and Fawcett, 2006).

Average issuer asset size, average issuer asset leverage and average secondary share

portion are issuer demographics faced by the underwriter . Size and leverage reflect the

risk of issuer (Ritter and Welch, 2002). Secondary share portion reflects the maturity of

the issuer (Huyghebaert and Hulle, 2006).

5.2. The Nested Structure and Instruments

 The main limitation of the nested logit framework is that nests are arbitrary. Our nest

structure assumes issuers chooser their underwriter according to underwriter reputation.

This assumption is consistent with the evidence that underwriter reputation is associated

with greater long run market value for the issuer (Akkus, Cookson and Hortaçsu, 2020).

In the Japanese IPO industry, the “big three” securities firms (Nomura, Daiwa and Nikko)

have a higher reputation compared to other securities firms. Nikami (2019) gave a

comprehensive review of the changes in the industrial structure of the Japanese securities

industry over the past 30 years. He found that in 1997, With the exception of trading

profits, only four companies accounted for around 50% of all commissions received.8 At

8
 Prior to 1997, the four major securities companies included Yamaichi Securities in addition to Nomura,
Daiwa and Nikko. Yamaichi Securities voluntarily closed its doors on 24 November 1997, following an
accounting fraud case.
 15
the time, the four major securities companies had a near monopoly on the share of lead

managers in capital increases and bond issues. As part of Japan’s "Big Bang" at the end

of the 1990s, the securities industry changed from a licensed to a registered system, which

lowered the barriers to entry. The “big 3” securities still hold a very high market share.

Existing literature on the syndication market uses the relative market share of

underwriters as a proxy for their reputation (Megginson and Weiss, 1991; Sufi, 2007).

The “big 3” securities companies are therefore fundamentally different from other

underwriter in terms of reputation. Therefore, I classify underwriters by grouping them

into two groups, namely Big3 and Non-Big3. Big3 includes Nomura, Daiwa and Nikko,

Non-Big3 includes other underwriters. Table 6 represents the annual market share of big

3 big three underwriters, and that of non-big three based on proceed. We can find that

the big three underwriters have always held an absolute market share in terms of proceed.

In 2010, this share reached 97.2%, only in 2009 and 2020 this phenomenon was reversed,

with the share of the non-Big 3 exceeding that of the Big 3.

 The use of the nested logit model relaxes the restriction on product substitutability,

but the within-group market share / , must be included as an explanatory variable in

(11). Equilibrium spreads and within-group market share depend on the characteristics of

underwriting service, and therefore , and ln( / , ) are correlated with the , . Hence,

we must use instruments to obtain consistent estimator. We consider two approaches to

the selection of IV.

 First, Berry, Levinsohn, and Pakes (1995) and Berry (1994) exploit competition within

a market to derive instruments. The intuition follows from the feature of oligopoly pricing.

Underwriter set spread as a function of characteristics of IPO services provided by

underwriter ≠ . For example, Nomura’s spread will depend on how closely

substitutable Daiwa is with the IPO service. At the same time, characteristics of rival

should not affect the issuer’s evaluation of underwriter ’s service. Instruments for the

underwriting spread include the averages of proceeds, SG&A asset ratio and financial

cost asset ratio over the competing underwriter in the same market. Following the same

logic, instruments for the within-nested group market shares include characteristics of
 16
other underwriters in the same nested group (e.g., the share of spread within the nested

group).

 Second, the instrument variables affect spread directly, while being uncorrelated with

underwriter unobservable variable. In addition to the non-spread characteristics of the

other underwriters in the same market, we can also use the cost shifters. Cost shifters

correlated with spread but not with underwriter unobservable variable. Underwriters can

respond to cost shifters by changing spread, but not by changing service. The SG&A

asset ratio and financial cost asset ratio can also be used as instrumental variable. We

lack an objective benchmark to choose exactly which instrumental variables should be

included.

 Due to the presence of many potential instrumental variables, we applied Least

Absolute Shrinkage and Selection Operator (LASSO) method in Belloni, Chen,

Chernozhukov and Hansen (2012) to select the optimal parameterization of the

instrument. 9 We provide LASSO a set of 10 potential instruments. We added five

variables representing the characteristics of rivals (the average of the spread, proceed,

SG&A asset ratio, financial cost asset ratio, underpricing over the competing

underwriters), one variable as an instrumental variable for the within-nested group

market shares (the share of spread within the nested group) and four variables that

directly affect the underwriter’s marginal cost (SG&A asset ratio, financial cost asset

ratio, and the square of these two ratios). The LASSO-chosen instrument is the average

of the spread, proceed over the competing underwriters and the share of spread within

the nested group.

5.3. Results for Demand Estimation

 The column (1) of table 7 reports the estimates of (11). We include year-quarter

dummy and fixed effects for the underwriter. The over-identification according to the

Hansen J-statistic (p-value) is 0.262, well above 10%, and it is failing to reject the

assumption that the instrumental variables and the unobservable characteristics of the

9
 Paravisini, Rappoport, Schnabl and Wolfenzon (2015); Gilchrist and Sands (2016) also use LASSO to filter
IVs and functional form of IV. We use the pdslasso commands provided by Ahrens, Hansen and Schaffer
(2020).
 17
underwriter are interrelated. The Cragg-Donald Wald F-statistic for weak identification

test is 11.85, which exceeds the 15% critical threshold value suggested by Stock and Yogo

(2005). These tests show that our hand-selection of IVs are reasonable.

 The estimated coefficient of spread is -0.841 and significant at the 5% level. A one

percent increase in spreads would lead to a 0.841 percent decrease in market share. This

implies that underwriter service is price elastic and the demand for an underwriting

service slope downward. The average own-price elasticities are about -3.224. As could be

expected, the average cross-price elasticities are higher for services within the same

subgroup (1.632) than for products of a different subgroup (0.34).10 The cross-price

elasticities indicate issuers substitute among underwriters.

 The coefficient on ln( / ) is positive and significant at 1% level. This result suggests

that the service provided by the underwriters within-group are closer substitutes than the

service of the other underwriters. Issuer preferences appear to be correlated across the set

of “Big-3” underwriters, on the other hand, and across the set of underwriters other than

“Big-3”. The issuer does treat these two groups differently and that nested strategy is

necessary.

 Column (2) shows the additional results with LASSO-selected instruments. The

statistics indicate that we cannot reject the null hypothesis that instruments are valid,

and that IVs are not weak. The results in column 2 show that the main estimated

coefficients, including the spread and ln( / ) are similar to that of column 1.

5.4. Validity of the Supply Models

 After having estimated the demand model, our goal is to determine whether our data

reflect a particular model of conduct. We assume that underwriters compete on spreads,

in a differentiated services market. We denote , , represents the degree to which

underwriter considers underwriter ’s profits when settting spread in market . Each

 , , is normalized to lie between 0 and 1, where 0 implies underwriter expect

10
 The own-price elasticities are given as / = ( − 1−
 1
 + 1−

 / ).The cross-price elasticities are
 / = ( + 1−

 / ),for ≠ and ∈ , / = ,for ≠ and ∉ .
 18
competitors to not respond to changes in their spreads, and 1 implies underwriters

collude with each other to act as a joint monopoly. Given the demand, underwriter

chooses its spread in each market to maximize following expression

 max( , − mc , ) , + , , ( , − mc , ) , (12)
 ∑
 ≠

where mc is the marginal cost, is the market size. The first order condition for

underwriter is derived as follows

 , ,
 , + ( , − mc , ) + , , ( , − mc , ) =0 (13)
 , ∑ ,
 ≠

Because we estimated the demand side, the demand functions , and full set of demand

slopes can be calculated. Suppose there underwriters, let be a × matrix with

elements , = − , , ⋅ , , we can write a system of (13). Since the system of equations
 ,

is linear, so the solution of marginal cost is just

 = − ( )−1 (14)

where and denote the -vector of marginal costs and demands. When , = 1,

the underwriters are interested in maximizing their profit jointly and we can calculate the

marginal cost of collusive marginal cost by (14). When , = 0.5 , underwriters

coordinate by taking into 50% of the competitors’ profits. When , = 0 , the

underwriter considers own profit-maximization problem. Summary statistics for the

price-cost margin estimates with a nested logit demand model are presented in Table 8.

When the underwriters are fully cooperative, the average price-cost margins estimated

are higher than the price-cost margins that result when underwriters perform

Bertrand-Nash behavior. The results also show that if underwriters coordinate by taking

into 50% of the competitors’ profits, then the average price-cost margin becomes almost

1.35 times as high as when there is no coordination.

 19
From here, different approaches have been proposed in the literature.11 Similarly to

Villas-Boas (2007), we conduct two approaches: one “informal” test, and non-nested test

of Rivers and Vuong (2002). “Informal” test pits collusive model and uses the data to

determine if the model can be rejected. Instead, the non-nested test evaluates which of

the two candidate models are more appropriate for the data.

5.5. Informal Test

 Following Villas-Boas (2007) and Pakes (2017), we first apply an informal model

specification check. Equation (14) lets us write down:
 mc , = , − , (15)

where ≡ ( )−1 . We can specify a functional form for mc , as the sum of the

marginal cost of service and distribution

 mc , = ,
 ′
 + , (16)

where , are cost-side variables include SG&A asset ratio and financial cost asset ratio,

and , is an unobservable to the econometrician that captures the cost efficiency of an

underwriter. Plug (16) into (15), we obtain:

 , = ,
 ′
 + , + , (17)

The markup above cost , in equation (17), can be calculated directly from the deman

estimates. Hence, equation (17) is the regression of spreads on inferred markup. Moreover,

theory implies that this markup has a coefficient of 1, the informal model test evaluates

the null hypothesis that coefficient is not different from 1. To complete this test, we

11
 The literature has estimated firm conduct by parameterizing the firm’s first-order condition to allow for
price taking, and monopoly pricing (Porter, 1983; Ellison, 1994; Graddy, 1995). Like the above literature, it
is possible to directly estimate . We did not use this approach for the following two reasons. First, this
approach can lead to inconsistent estimates if firms are in a state of efficiency tacit collusion (Corts, 1999;
Puller, 2009). Second, Nevo (1998) demonstrates that identification of conjectural variation parameters in a
differentiated-products industry setting is extremely difficult in practice because it requires a large number of
exogeneous instrument variables.
 20
first use the demand estimates and equation (14) to construct the collusive markup. Then,

collusion rejected if coefficient of collusive markup is not 1.

 Table 9 reports the fit of pricing equilibrium (17). The coefficient of the collusive

markup is 1, indicating that collusive assumption cannot be rejected by the data. The

within 2 is 1 which is quite high for a behavioral model. In columns 2, 3 and 4 we use

the markup calculated when underwriters consider 25%, 50% and 75% of the profits of

other underwriters respectively. These coefficients are all significantly not 1, suggesting

that the markup forces under the 25%, 50% and 75% all fit the data worse than the full

collusion case.

5.6. Non-Nested Test

 In addition to the informal test, we also take a different approach developed in Rivers

and Vuong (2002) and Bonnet and Dubois (2010). Molnar, Violi and Zhou (2013) and

Sullivan (2020) also applied this test. We can formulate alternative models of conduct ℎ,

estimate the demand system, and obtain estimates of markups under each model ℎ.

Following Bonnet and Dubois (2010), we assume the following specification for marginal

costs

 mc , = [exp( ,
 ′
 )] , (18)

From equation (15) and (18), we have

 , = ,
 ℎ
 + [exp( ℎ ,
 ′
 )] ,
 ℎ
 (19)

For any two models of conduct ℎ and ℎ′ , we run the following nonlinear least squares:

 1 1
 min ℎ = min ( ln ℎ , )2 = min [ ln( , − ,
 ℎ
 ) − ℎ ,
 ′ 2
 ]
 ℎ ℎ ∑
 , ℎ ∑
 ,

Then we use Rivers and Vuong (2002) test for selection among different models of

conduct. The null hypothesis is that the two nonnested model are asymptotically

equivalent when

 21
 0 : lim { ℎ ( ℎ , ) − ℎ ( ℎ , )} = 0
 ′ ′

 →∞

where ℎ ( ℎ , ) is expectation of ℎ at the pseudo-true values of the parameters of

model ℎ. ℎ is asymptotically better than ℎ′ is the first alternative hypothesis

 1 : lim { ℎ ( ℎ , ) − ℎ ( ℎ , )} < 0
 ′ ′

 →∞

ℎ′ is asymptotically better than ℎ is the second alternative hypothesis

 2 : lim { ℎ ( ℎ , ) − ℎ ( ℎ , )} > 0
 ′ ′

 →∞

The value of test statistic is

 √
 = { ℎ (
 ̂ℎ , ) − ℎ (
 ̂ℎ , )}
 ′

 ℎℎ′
 ̂

where ℎ (
 ̂ℎ , ) is the ℎ at the estimated values of the parameters of model ℎ. Rivers

and Vuong show that can be compared with critical values of a (0,1).

 The results are given in Table 10. When we consider the full sample, the collusion

model is the best because the statistic estimates are always negative and significant at the

1% level. This indicates that given the demand, potential spread collusion best fits the

sample. Spreads in the Japanese IPO industry are consistent with collusive pricing

behavior. Rejection of the Bertrand models can be explained by the environment of the

Japanese IPO market makes it easier to sustain collusion.

 To further explore whether the results of this change over time, we conducted the

above test separately for each year of data from 2002 to 2020. From Table 10 we can find

that in 2002 the Bertrand price model illustrates the data better than the collusion model.

The test statistics of 5.27 shows that we can reject perfect collusion against the

Nash-Bertrand competition at 1% significant level. Relatively, the collusion model

performs better during 2003 and 2010, 2015, 2016, 2018 and 2019. In 2012, 2013, 2014,

2017 and 2020 although the statistic value is negative, this test value is not significant

therefore we cannot reject the null hypothesis.
 22
The results for the year 2002 can be explained by the participation of bank-based securities firms. In 2002, commercial bank entry into the underwriting market has resulted in decreased spreads, consistent with the result that the IPO underwrite industry has become more competitive. But this competitive effect disappeared after 2002. Combining the information in Figure 2, we can see that the trend after 2010 is that the collusion model usually becomes better at fitting data each time after the market concentration starts to decline. For example, from 2011 to 2014, the average market concentration decreased from 0.375 to 0.163 and reached 0.115 in 2015. In 2015 and 2016, the collusion model became a better fit to the data. This change can be rationalized by Hatfield et al. (2020). They show that in markets with syndication, when markets are concentrated, after an underwriter undercuts on spread, all underwriters shift to a competitive equilibrium that each underwriter earns no profits in subsequent periods. When markets are not very concentrated, underwriters can punish the undercutting underwriter by refusing to join its syndicate. Completing the IPO alone is very costly and therefore the “refusal to join the syndicate” strategy increasing the undercutting underwriter’s costs of production. Entry and decreasing market concentration can strength underwriters’ abilities to punish deviator by refusing offers of syndication. This would weaken the competitive effect. 6. Conclusion This paper uses a nested logit model to estimate a demand system for Japanese IPO underwriter markets. We find underwriter face downward-sloping demand curves and the underwriter markets is far from competitive. Our non-nested test could reject the Bertrand competitive model against the fully collusive model at a 1% significance level. Our conclusion is consistent with collusion hypothesis. Our study also has the following limitations. First, this paper does not directly estimate the value of the underwriter conduct. Several recent studies have estimated the contact directly using merger and multi-market contact as instruments (Ciliberto and Williams, 2014; Miller and Weinberg, 2017). Second, we only tested the competition in the Japanese IPO market. An international analysis is necessary to fully analyses there is 23
collusion in the IPO market.

Acknowledgments

I grateful to Yoshiaki Ogura for the insightful comments and for generously

sharing me the IPO data. I thank Naoaki Minamihashi for helpful comments.

 24
References
Abrahamson, M., Jenkinson, T., & Jones, H. (2011). Why don't US issuers demand European fees
 for IPOs?. The Journal of Finance, 66(6), 2055-2082.
Abrantes-Metz, R. M., Froeb, L. M., Geweke, J., & Taylor, C. T. (2006). A variance screen for
 collusion. International Journal of Industrial Organization, 24(3), 467-486.
Ahrens, A., Hansen, C. B., & Schaffer, M. E. (2020). lassopack: Model selection and prediction
 with regularized regression in Stata. The Stata Journal, 20(1), 176-235.
Akkus, O., Cookson, J. A., & Hortaçsu, A. (2020). Assortative matching and reputation in the
 market for first issues. Management Science.
Athey, S., Bagwell, K., & Sanchirico, C. (2004). Collusion and price rigidity. The Review of
 Economic Studies, 71(2), 317-349.
Belloni, A., Chen, D., Chernozhukov, V., & Hansen, C. (2012). Sparse models and methods for
 optimal instruments with an application to eminent domain. Econometrica, 80(6),
 2369-2429.
Benetton, M. (2018). Leverage regulation and market structure: An empirical model of the uk
 mortgage market. Available at SSRN 3247956.
Berry, S. T. (1994). Estimating discrete-choice models of product differentiation. The RAND
 Journal of Economics, 242-262.
Berry, S., Levinsohn, J., & Pakes, A. (1995). Automobile prices in market
 equilibrium. Econometrica: Journal of the Econometric Society, 841-890.
Binay, M. M., Gatchev, V. A., & Pirinsky, C. A. (2007). The role of underwriter-investor
 relationships in the IPO process. Journal of Financial and Quantitative Analysis, 785-809.
Bonnet, C., & Dubois, P. (2010). Inference on vertical contracts between manufacturers and
 retailers allowing for nonlinear pricing and resale price maintenance. The RAND Journal of
 Economics, 41(1), 139-164.
Brau, J. C., & Fawcett, S. E. (2006). Initial public offerings: An analysis of theory and
 practice. The Journal of Finance, 61(1), 399-436.
Cardell, N. S. (1997). Variance components structures for the extreme-value and logistic
 distributions with application to models of heterogeneity. Econometric Theory, 185-213.
Chen, H. C. (2001). Competition and Collusion in the IPO Market.
Chen, H. C., & Ritter, J. R. (2000). The seven percent solution. The Journal of Finance, 55(3),
 1105-1131.
Ciliberto, F., Watkins, E., & Williams, J. W. (2019). Collusive pricing patterns in the US airline
 industry. International Journal of Industrial Organization, 62, 136-157.
Corts, K. S. (1999). Conduct parameters and the measurement of market power. Journal of
 Econometrics, 88(2), 227-250.
Crawford, G. S., Pavanini, N., & Schivardi, F. (2018). Asymmetric information and imperfect
 competition in lending markets. American Economic Review, 108(7), 1659-1701.
Dick, A. A. (2008). Demand estimation and consumer welfare in the banking industry. Journal of
 Banking & Finance, 32(8), 1661-1676.
 25
Egan, M., Hortaçsu, A., & Matvos, G. (2017). Deposit competition and financial fragility:
 Evidence from the us banking sector. American Economic Review, 107(1), 169-216.
Ellis, K., Michaely, R., & O'hara, M. (2000). When the underwriter is the market maker: An
 examination of trading in the IPO aftermarket. The Journal of Finance, 55(3), 1039-1074.
Ellison, G. (1994). Theories of cartel stability and the joint executive committee. The Rand
 journal of economics, 37-57.
Fernando, C. S., Gatchev, V. A., May, A. D., & Megginson, W. L. (2015). Prestige without
 purpose? Reputation, differentiation, and pricing in US equity underwriting. Journal of
 Corporate Finance, 32, 41-63.
Gande, A., Puri, M., & Saunders, A. (1999). Bank entry, competition, and the market for
 corporate securities underwriting. Journal of Financial Economics, 54(2), 165-195.
Gavazza, A. (2011). Demand spillovers and market outcomes in the mutual fund industry. The
 RAND Journal of Economics, 42(4), 776-804.
Gilchrist, D. S., & Sands, E. G. (2016). Something to talk about: Social spillovers in movie
 consumption. Journal of Political Economy, 124(5), 1339-1382.
Gordon, B. (2003). The Seven Percent Illusion?. Unpublished Columbia Business School Working
 Paper.
Graddy, K. (1995). Testing for imperfect competition at the Fulton fish market. The RAND
 Journal of Economics, 75-92.
Hansen, R. S. (2001). Do investment banks compete in IPOs?: The advent of the “7% plus
 contract”. Journal of Financial Economics, 59(3), 313-346.
Hatfield, J. W., Kominers, S. D., Lowery, R., & Barry, J. M. (2020). Collusion in Markets with
 Syndication. Journal of Political Economy, 128(10), 3779-3819.
Ho, C. Y. (2010). Deregulation, competition and consumer welfare in a banking market: evidence
 from Hong Kong. Journal of regulatory economics, 37(1), 70.
Ho, K., & Ishii, J. (2011). Location and competition in retail banking. International Journal of
 Industrial Organization, 29(5), 537-546.
Huyghebaert, N., & Van Hulle, C. (2006). Structuring the IPO: Empirical evidence on the
 portions of primary and secondary shares. Journal of Corporate Finance, 12(2), 296-320.
Ivaldi, M., Jullien, B., Rey, P., Seabright, P., & Tirole, J. (2003). The Economics of Tacit
 Collusion (No. 186). Institut d'Économie Industrielle (IDEI), Toulouse.
Kang, A., & Lowery, R. (2014). The pricing of IPO services and issues: Theory and
 estimation. The Review of Corporate Finance Studies, 2(2), 188-234.
Koda, K., & Yamada, K. (2018). Determinants of underwriting fees by new entrant banks:
 evidence from the Japanese IPO underwriting market. Financial Management, 47(2),
 285-307.
Koijen, R. S., & Yogo, M. (2016). Shadow insurance. Econometrica, 84(3), 1265-1287.
Kutsuna, K., & Smith, R. (2004). Why does book building drive out auction methods of IPO
 issuance? Evidence from Japan. Review of Financial Studies, 17(4), 1129-1166.
Liu, X., & Ritter, J. R. (2011). Local underwriter oligopolies and IPO underpricing. Journal of
 Financial Economics, 102(3), 579-601.
Ljungqvist, A. P., Jenkinson, T., & Wilhelm Jr, W. J. (2003). Global integration in primary
 equity markets: The role of US banks and US investors. The Review of Financial
 Studies, 16(1), 63-99.

 26
You can also read