Market Review MAY 2022 - Genesis Global Trading
←
→
Page content transcription
If your browser does not render page correctly, please read the page content below
Market   MAY
         2022
Review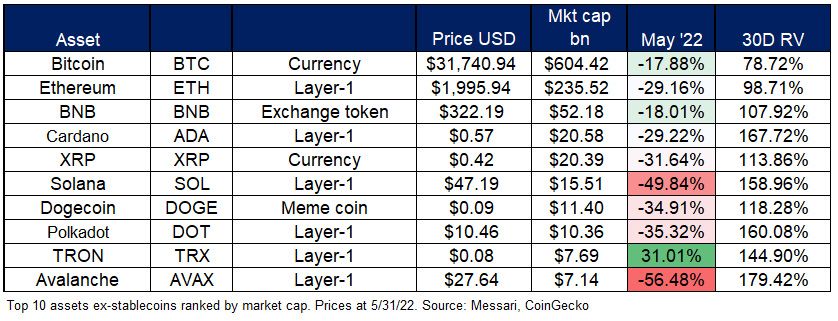
MAY 2022 MONTHLY REVIEW
Introduction

I - Macro
   Gathering Winds
   Crypto at Davos

II - Bitcoin
    Market Metrics: Is a Bottom Close?
    The Drawdown in Historical Context
    Correlations

III - Ethereum
    ETH/BTC
    The Merge Timeline
    Why ETH’s Future Supply is Hard to Predict

IV - Layer-1s
    Terra: The Big Implosion

V - DeFi
    Stablecoins
    DeFi Impact

V - Regulation
    Stablecoin Regulation
    CFTC

                                                 MONTHLY REVIEW - MAY 2022       2 - 22
                                                     MONTHLY REVIEW - MAY 2022       2 - 22
Introduction
May was marked by the drama of one of the worst crashes in crypto markets in absolute
terms, with a loss of over $600 billion in total market cap1 over the course of a few days. For
context, the crash of March 2020 wiped out $120 billion. The drop was triggered by the almost-
disappearance of two of the top 10 assets in terms of market cap (ranked at the beginning of the
month), although macro conditions and sentiment contagion played their part.

This was arguably one of the most significant events in crypto markets in recent years, triggering
not only ripple effects across the market, but also intensifying calls for stablecoin regulation and
investor protection.

The month will also be remembered as one in which the progress toward Ethereum’s shift from
proof-of-work to proof-of-stake gathered momentum, building anticipation yet failing to manifest
in the price of ETH, as overall de-risking led to a rotation into BTC.

In the report that follows, we take a closer look at the main narrative shifts in May and the events
behind them.

These include:

→    The implosion of the Terra ecosystem

→    The market’s rotation into BTC

→    The correlation decoupling between BTC and macro indices

→    The coalescing timeline toward Ethereum’s Merge

→    The prominent crypto presence at Davos

→    …and much more.
Nothing in this report is intended to be investment advice—our aim is to update and
explain some of the shifting narratives driving crypto markets. We hope you find it useful.

(Note: we use uppercase Bitcoin to denote the network, and lowercase bitcoin or BTC to denote the asset; for Ethereum,
we use uppercase to denote the network, and ether or ETH to denote the asset. “Merge” is capitalized when referring to
Ethereum’s upcoming consensus shift. All $ are USD unless otherwise specified.)

1   According to data from TradingView.

                                                                                     MONTHLY REVIEW - MAY 2022           3 - 22
                                                                                         MONTHLY REVIEW - MAY 2022           3 - 22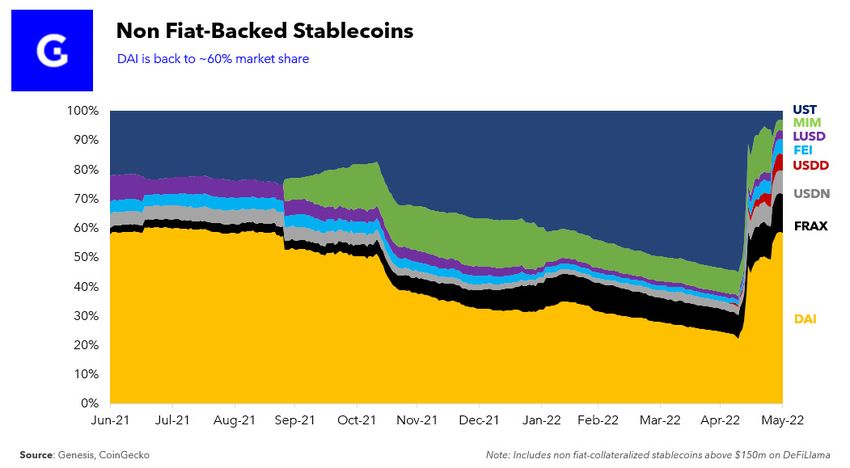
May performance
The May performance of the top 10 assets ex-stablecoins ranked by market cap:

                                                              MONTHLY REVIEW - MAY 2022       4 - 22
                                                                  MONTHLY REVIEW - MAY 2022       4 - 22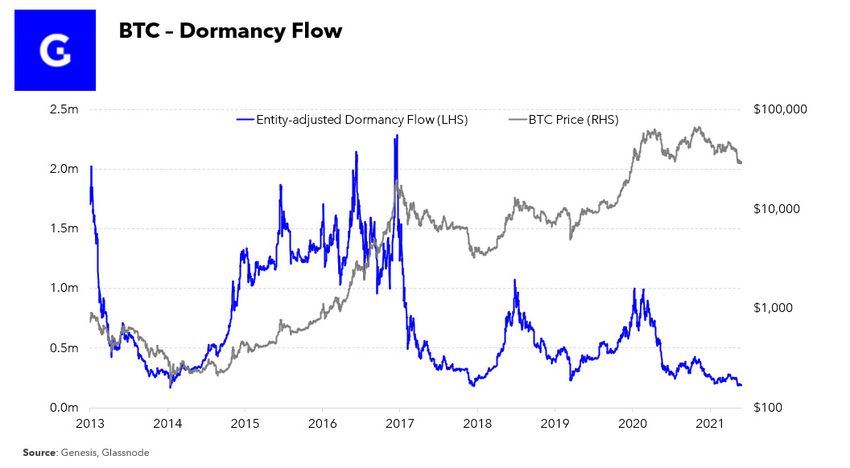
1                                                                 Macro

Gathering Winds                                                                          goods to services did nothing to dampen the
                                                                                         trajectory of overall cost-of-living increases,
Against a background of economic tension,
                                                                                         definitively erasing “transitory” from the Fed
market confusion and geopolitical uncertainty,
                                                                                         vocabulary and boosting rate increase
May saw several unwelcome local records for
                                                                                         expectations. The S&P 500 dropped over 1.3% on
global markets:
                                                                                         the day, the yield curve flattened, and the crypto
                                                                                         market lost over $200 billion2 within 24 hours.
→       The US 10-year yield hit its highest level since
        2018

→       The dollar index hit its highest point since 2002

→       US credit spreads and default insurance on
        North American corporate bonds hit highs not
        seen since 2020

→       The correlations between BTC and leading
        stock indices reached record highs

(All data via Bloomberg and Coin Metrics.)
                                                                                         However, as the month progressed, strong signs
                                                                                         of a weakening economy coupled with a shift
                                                                                         in the tone of comments from Fed officials led
                                                                                         to an easing of concerns about rates. Toward
                                                                                         the end of the month, priced-in expectations
                                                                                         had dropped from eight in the remainder of the
                                                                                         year (adjusted for the 50bp hike announced
                                                                                         at the FOMC meeting on May 4) to seven.

                                                                                         The stock market, by now used to focusing almost
                                                                                         exclusively on the potential impact of rate hikes,
                                                                                         reacted favorably to this shift, with the S&P 500
                                                                                         recovering most of the month’s losses (down
                                                                                         almost 8% at one point) in the latter two weeks.
The April CPI print reported on May 11 surprised
in its stickiness, with the headline figure up 8.3%                                      Yet the last few days of May saw a re-awakening
year-over-year (vs 8.1% expected and 8.5% prior)                                         of concerns around inflation, economic
and the core CPI up 0.6% month-on-month (vs                                              growth and the interest rate strategies of
0.4% expected and 0.3% prior). The pivot from                                            the world’s leading central banks, as record

2   According to data from CoinMarketCap, the total crypto market cap dropped from $1.43 trillion at 01:40 UTC on May 11 down to $1.16 trillion at 01:40 UTC on May 12.

                                                                                                            MONTHLY REVIEW - MAY 2022                              5 - 22
                                                                                                                MONTHLY REVIEW - MAY 2022                              5 - 22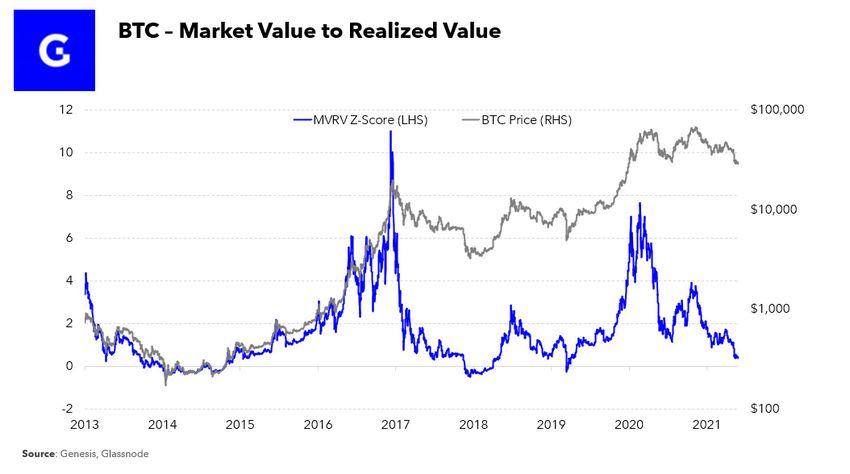
CPI numbers in Europe as well as poor consumer confidence and new home sales data
in the US battled with a possible re-opening of China for control of market sentiment.

The change in momentum coincided with a drop in the 60d correlation between BTC and the
S&P 500, which we look at in the “Bitcoin” section below.

Crypto at Davos
Further narrative shifts were seen at loftier heights, as the annual gathering of global figures at
Davos in Switzerland delivered some content surprises.

→   One was the number of crypto-focused panels, with discussions on remittances, payment rails
    and CBDCs.

→   Another was the number of times crypto came up in panels about the global economy.

→   A third was the volume of ads for crypto services and the much larger branding presence.
For some attendees, the jump in crypto interest stemmed from bitcoin’s seizure resistance,
while billionaires talked about digital gold. Panelists debated whether or not bitcoin was money.
Some companies proposed new uses for blockchain. Digital asset enthusiasts tried to figure
out how to channel aid to Ukraine. Crypto markets were cited—by the World Economic Forum,
no less—as one of the main areas of concern. Unlike in previous editions, everyone—from
heads of powerful institutions to passers-by on the street—had a crypto-related opinion.

Crypto, it seems, has moved from being on the fringes of Davos to occupying part of the center
stage.

                                                                   MONTHLY REVIEW - MAY 2022          6 - 22
                                                                       MONTHLY REVIEW - MAY 2022          6 - 22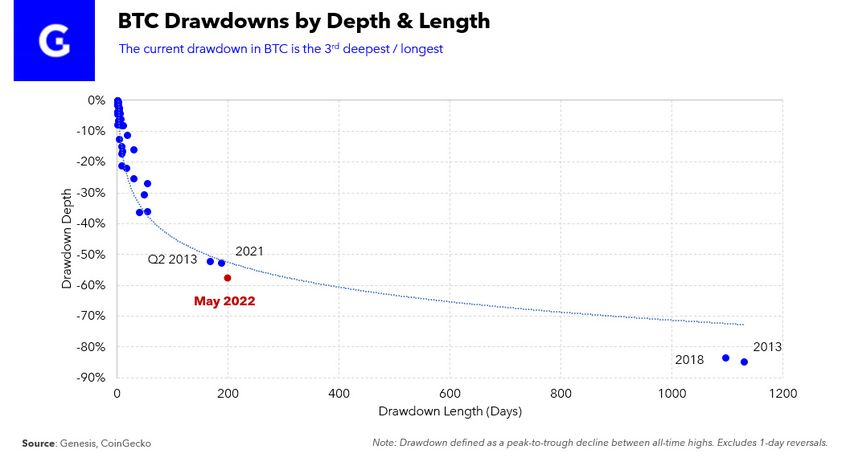
2                                                              Bitcoin

                                                                                     Given its relatively low volatility compared to other
                                                                                     crypto assets4, BTC usually underperforms in
                                                                                     strong markets and outperforms in weak markets.
                                                                                     October 2021 was an exception to this, as investor
                                                                                     excitement about the listing of the first bitcoin-
                                                                                     linked ETF in the US had pushed its price up to
                                                                                     $52,700, giving the asset a strong
                                                                                     outperformance.

                                                                                     The previous 46% breakthrough to the upside, in
                                                                                     July 2021, is more relevant: the crypto market was
                                                                                     weak, overall market cap had dropped by over
The bitcoin price dropped approximately 17% over                                     $1 billion5 since early May, and BTC had fallen
the past month, a lesser drop than in May 2021,                                      by almost 50% in the same period. Yet July 2021
but nevertheless, its second-worst May perfor-                                       turned out to be the local low—BTC’s price went
mance to date.                                                                       on to more than double over the next four months.

Market Metrics: Is a Bottom Close?
A key feature of the crypto markets in May was the
sharp increase in bitcoin’s market dominance3 as
asset prices fell across the board and investors
rotated into the sector’s “blue chip” asset. In the
second half of the month, bitcoin’s dominance
—also known as BTC.D—broke through 46% to
the upside for the first time since October 2021.

                                                                                     This does not necessarily mean that BTC’s
                                                                                     dominance is signaling a market bottom at this
                                                                                     stage—negative sentiment from the Terra implosion,
                                                                                     DeFi weakness and regulatory concerns is playing a
                                                                                     prominent role in the recent slump. However, other
                                                                                     metrics are hinting that—based on historical
                                                                                     precedent—a bottom could be near.

                                                                                     One is “dormancy flow,” which measures the aver-
(chart via TradingView)
                                                                                     age time held of each coin sold on a given day,

3   BTC’s market cap / total crypto market cap, expressed as a percentage
4   30d volatility for BTC ~80%; for SOL, AVAX, ADA and DOT ~150–170%, according to data from Messari
5   According to data from TradingView

                                                                                                        MONTHLY REVIEW - MAY 2022       7 - 22
                                                                                                            MONTHLY REVIEW - MAY 2022       7 - 22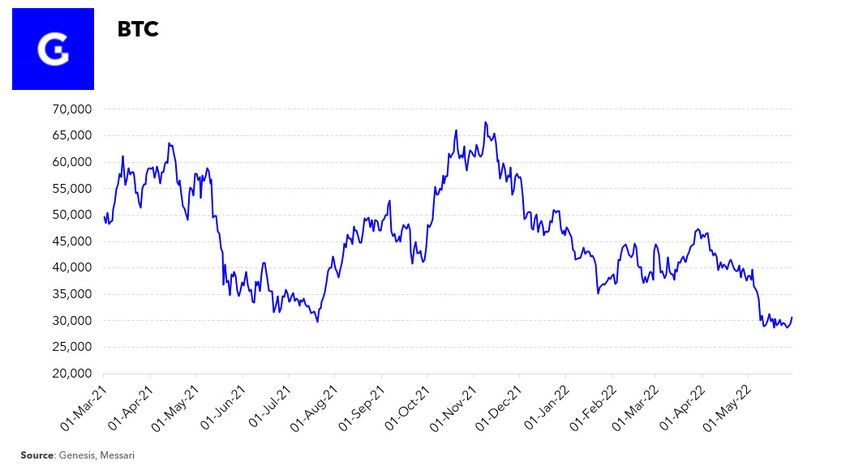
annualizes it and puts it in the context of overall
activity and the total BTC market cap.
Dormancy flow6 is based on “coin days destroyed”
(CDD), which measures the aggregate number of
days held for coins moved on a given day. When the
number is high, longer-term investors are selling to
newer investors. When it is low, they are more likely
to be buying from newer investors.
When compared to overall market size and activity,
this figure can suggest where the current price is Again, history does not necessarily repeat. And
relative to on-chain economic activity. In the past, on-chain signals should not be taken at face value, as
the metric dropping below 250k has signaled a they can be influenced over time by shifts in market
market bottom. In May, the figure dropped below structure such as custody technology, derivatives
200k. This does not mean that the price could not development and layer-28 activity. Nevertheless,
drop further. But it does indicate that market value is previous patterns can shed light on current market
relatively low compared to investment activity. dynamics, help to put recent moves in a larger
context, signal factors to keep an eye on, and serve
as a reminder that cycles require time to play out.
The Drawdown in Historical Context
BTC is currently down over 50% since its previous
all-time high in November 2021. This is significantly
worse than the average post-2013 drawdown of 15%
and the length of the drawdown so far (over 200 days
and counting) makes it the third longest since 2013.
Another metric that compares market value to
accumulated investment value (also referred
to as “realized value”) is the MVRV Z-score.7
This subtracts the aggregate acquisition
cost of all BTC holdings from the market
capitalization (to get the implicit aggregate
“profit”) and divides by the standard deviation
of the market cap (to standardize).
This shows a market value that is close to historical
lows for the ratio. In the past, the MVRV Z-score
dipping below 0 has signaled that a bottom is
Only during the bear markets of 2013 and 2018 were
near—at the end of May, the 7-day moving average
the drawdowns more severe, lasting multiple years
value reached 0.41.
before recovery to a new all-time high. And though a
6 Market cap divided by the 365-day moving average of [CDD*price/# coins transferred]. See more here.
7 For more information on MVRV, see here and on how the z-score is calculated, see here.
8 Layer-2 refers to networks that run on top of base layer blockchains (called layer-1s), abstracting computation (and thus removing the main scaling limitations of
block space and fees), but relying on the base blockchain for security.
MONTHLY REVIEW - MAY 2022 8 - 22
MONTHLY REVIEW - MAY 2022 8 - 22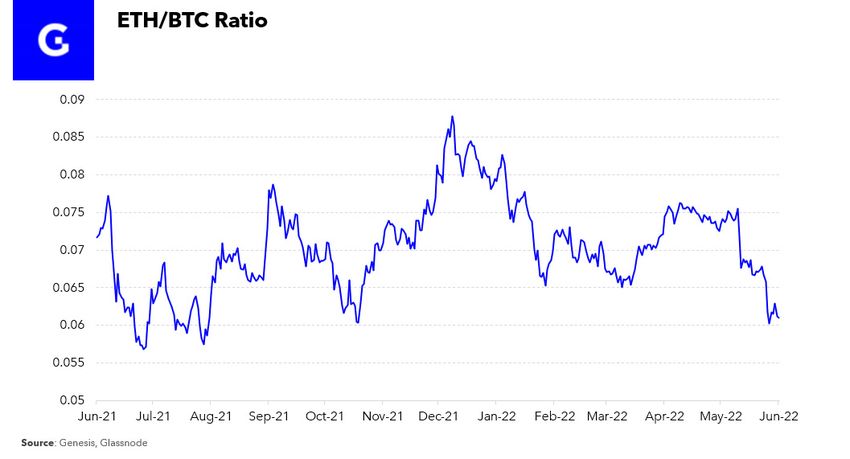
50% decline is certainly worthy of concern, it is also    After reaching an all-time-high in early May, the 60d
nothing out of the ordinary given the high annualized     correlation between BTC and the S&P 500 turned
volatility of this asset.                                 with the market crash. The crypto-specific nature of
                                                          the market slump (driven by the Terra ecosystem
Unlike traditional asset classes, there is still little   implosion) reinforced the narrative divergence,
consensus on methodologies for estimating intrinsic       which continued even as the dust settled and signs
value of BTC and ETH. This wider dispersion of            began to emerge of a slight sentiment recovery.
opinion is one of the reasons prices in crypto
markets have historically fluctuated more widely          The correlation between BTC and gold also turned
than in equities. This volatility gives rise to both      during the past month, from notably negative to
harsher drawdowns than in traditional assets, as well     neutral/slightly positive, as rising real yields weighed
as stronger historical gains. Despite nearly 50           on the metal’s performance.
drawdowns from all-time highs since early 2013,
BTC has gone from $135 to over $30k during the
same period.

Every drawdown is qualitatively unique and should
be taken in the context of the prevailing narrative.
Other than ever-present cyclical pressures, previous
market slumps were driven by different factors than
the current one. Macro conditions, for instance, play
a much larger role in crypto markets today than a
few years ago, and the UST implosion is (at least to
date) a unique crypto event.
                                                          While both of the above charts reflect the 60d
Nevertheless, context is useful in forming a thesis as    correlation and hence carry a degree of smoothing,
to where the floor of the current drawdown could be.      they do hint at a narrative divergence in markets that
                                                          in turn reflects the behavior of many macro
                                                          portfolios. The correlation jump since mid-2021
Correlations
                                                          coincided with the crypto market entrance of macro
                                                          institutional investors who tend to see bitcoin as a
For months, we have been watching the correlation
                                                          risk asset. As bitcoin was increasingly treated as a
between BTC and the S&P 500 climb, cementing
                                                          risk asset, it increasingly behaved like one, pushing
the narrative that BTC had effectively become a
                                                          the correlation up. Now, as macro institutional
macro risk asset. In last month’s market review, we
                                                          investors are to some extent de-risking portfolios by
discussed the drivers of this shift. This month, we
                                                          exiting high volatility assets such as bitcoin, they will
take a look at how the correlation trends seem to be
                                                          start to have less influence over BTC’s price.
turning.
                                                          This correlation correction does not necessarily
                                                          mean that BTC is no longer considered a macro risk
                                                          asset – its correlation is still relatively high. It does,
                                                          however, point to a greater distinction of narratives.
                                                          The market is still dealing with the crypto-specific
                                                          fallout from the implosion of the Terra ecosystem,
                                                          but the distinction is unlikely to always be negative.
                                                          Strong tailwinds such as new fund raises, progress
                                                          on the Ethereum merge, deeper institutional

                                                                      MONTHLY REVIEW - MAY 2022             9 - 22
                                                                          MONTHLY REVIEW - MAY 2022             9 - 22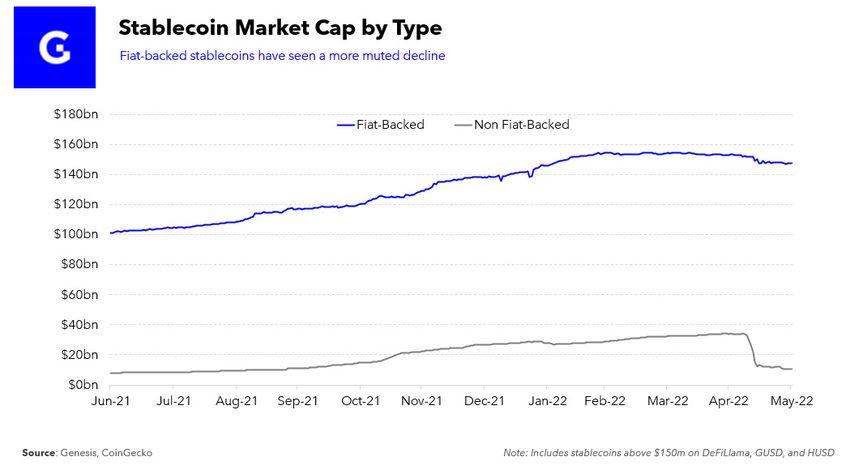
acceptance and continued application growth could
shift sentiment in the other direction, highlighting
crypto’s relative youth, growth potential and
technology angle, while traditional markets grapple
with worsening economic conditions and a still-
uncertain rates outlook.

That said, market narratives appear to be fluctuating
more than usual in this rapidly changing environment.
While 60d correlation with traditional indices is not a
perfect metric with which to gauge sentiment shifts, it
does point to further change ahead.

                                                          MONTHLY REVIEW - MAY 2022       10 - 22
                                                              MONTHLY REVIEW - MAY 2022      10 - 22
3 Ethereum
However, the ETH/BTC metric is different in that
ETH can also be considered a “blue chip,” albeit a
younger one, given its relatively high liquidity and
market cap. What’s more, ETH has a distinct
narrative in the shape of the upcoming Merge,
which in theory will boost some of its fundamental
characteristics (see below as well as our March
market review for more details).
That this ratio reached similar levels to July 2021,
when the falling market had touched its floor, is
notable given the heightened investor interest in
ETH due to its upcoming transformation, and
The price of ETH dropped almost 29% over the highlights just how weak investor sentiment has
past month, delivering its worst May performance been over the month.
to date.
The Merge Timeline
ETH/BTC
The month of May saw significant, albeit patchy,
ETH’s drop over the month pushed the ETH/ progress toward the long-awaited Ethereum
BTC ratio to its lowest point since July 2021. Like Merge, in which the consensus algorithm shifts
BTC.D (see “Bitcoin” section above), this metric from proof-of-work (PoW) to proof-of-stake9 (PoS),
is watched as a barometer of market sentiment. with greater clarity on both the expected timing
As the market’s “blue chip” asset, BTC tends and the process.
to outperform (rising BTC.D) in weak markets
as investors rotate out of altcoins into more On the timing, in spite of assurances during the
liquid and more “tested” higher-cap tokens. month that August was an achievable target,
developers agreed at the end of the month that a
delay in the “difficulty bomb” was a good idea,
hinting that a later Merge date is now likely (but not
inevitable).
The difficulty bomb is a script baked into
Ethereum’s code that, after a certain block height
is reached, starts to make the block validation
algorithm more difficult with the aim of eventually
making the PoW network unusable. Without a
9 Proof-of-stake blockchains differ from proof-of-work blockchains in that they do not rely on computational energy to confirm consensus. Instead of giving
validation power to “miners”, they leave it in the hands of token owners who lock up holdings in order to participate in network governance.
MONTHLY REVIEW - MAY 2022 11 - 22
MONTHLY REVIEW - MAY 2022 11 - 22possible after the Merge goes live.
delay, this will happen in late August, although
activation has already been triggered and the time → They did not want to signal another Merge delay
between blocks is already starting to lengthen. to the community.
However, on the May 27 ACD call, developers in
principle agreed to delay the difficulty bomb,
although it has yet to be determined by how much.
This does not mean that the merge will be delayed,
just that there is less time pressure.
The next phase of preparation is the merge of
Ethereum’s main testnets. On June 8, the Ropsten
testnet is expected to undergo the shift to PoS.
Hiccups in the preparation that became apparent
in late May highlight the testnet’s relative instability
Assuming total mining capacity remains more-or- and this testnet will be deprecated after the
less the same, the time between blocks will mainnet Merge, but its merge is nevertheless
continue to lengthen, making Ethereum less significant as the first of an active network with
profitable to mine as fewer new ETH are awarded running apps (albeit with thin hashrate and
per day. It will also impact users, who will need to transaction activity).
wait longer for transaction finality. It could also
impact fees, with some users willing to “tip” 10 After Ropsten, it’s the turn of testnets Goerli and
miners more to get their transactions included Sepolia, with the latter most closely approximating
sooner. the current Ethereum PoW network. Once all three
have been running smoothly for a few weeks,
If Ethereum’s hash rate starts to drop as miners developers will activate the countdown to the
leave the network, the increase in time between mainnet Merge.
blocks will accelerate. What’s more, this could
happen fast, possibly rendering the Ethereum
network effectively unusable before the Merge. Why ETH’s Future Supply is Hard to Predict
The current daily new supply of ETH is affected by
The difficulty bomb can be delayed with a three factors:
network update. However, on previous All
Core Developer (ACD) calls, the decision was → Two ETH issued to miners who successfully
taken not to do this, for four main reasons: process blocks on the proof-of-work chain.
→ Developers felt relatively confident that the → ETH issued to validators on the Beacon proof-of-
Merge would be ready before late August. stake chain, in proportion to the square root of
the number of validators.
→ They did not want to distract developer
attention from Merge testing. → Ethereum transaction fees. Ever since the EIP
1559 upgrade in August 2021, Ethereum “burns”
→ They want to time the Merge and the bomb ETH paid as base fees, permanently removing
activation as closely as possible, to effectively them from the outstanding supply—the higher
kill off the proof-of-work layer as soon as
10 Ethereum transaction fees consist of the base fee set by the algorithm according to flow and congestion (which is then burned) and a variable component to
incentivize miners to prioritize certain transactions. For more information, see here.
MONTHLY REVIEW - MAY 2022 12 - 22
MONTHLY REVIEW - MAY 2022 12 - 22the total fees paid on the network, the more
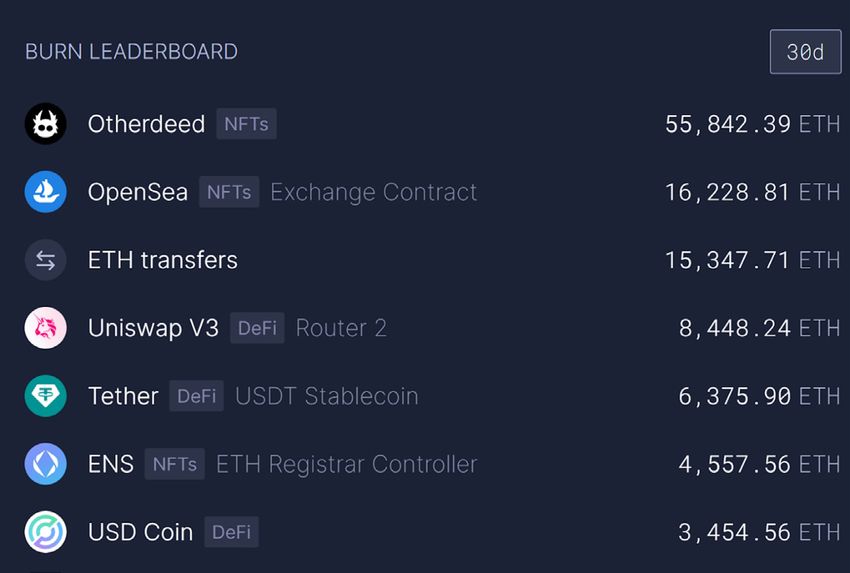
ETH is burned, reducing net new issuance. (screenshot of ultrasound.money)
After the Merge, no new ETH will be issued to However, while NFT sales have shown resilience in
miners (since there will no longer be any mining the face of market turmoil so far this year, during
on Ethereum), so the “fixed” component of new the month of May they did suffer a notable
supply disappears. Instead, new ETH supply will slowdown, according to data from CryptoSlam,
be dictated by two variable factors, making the with an almost 50% drop in those based on
new daily supply potentially even more Ethereum.
complicated to predict.
Ultrasound.money predicts that post-merge, ETH’s
The amount issued to validators as reward for net annual supply inflation rate would be -1.5% per
proposals and attestations is currently small, year. Given the variability of the supply factors,
given the low number of active validators, but is however, the exact figure is complicated to
likely to materially increase after the Merge as forecast.
more validators come online. Nevertheless, it is
still expected to be a fraction of the previous new
issuance as the cost of validating on proof-of-
stake is much lower. Current annual supply
inflation from mining rewards is approximately 4%,
according to data from Coin Metrics; current
annualized issuance on the Beacon Chain is
around 0.4% of supply. Even if the number of
validators were to double soon after the Merge,
annual inflation would still be less than 1%.
This is likely to be more than compensated by the
daily ETH burn, even at today’s relatively low
Ethereum fees.
Ethereum transaction fees, which have been
heading down since January, are likely to stay
relatively low while sentiment remains weak,
especially given the rapid development of layer-2
networks. Keeping an eye on NFT transactions is
especially relevant, given that they account for the
majority of fee burns, according to ultrasound.
money:
MONTHLY REVIEW - MAY 2022 13 - 22
MONTHLY REVIEW - MAY 2022 13 - 224 Layer-1s
Terra: The Big Implosion services that supported leveraging UST positions
to earn even more yield, generated enough
May 2022 will be remembered as the month UST demand to push its market cap up 6.5x to
in which the Terra ecosystem imploded. $18.6 billion in just six months from November.
Terra is a proof-of-stake blockchain with a series
of native applications built around its algorithmic
stablecoin UST. The value of UST was pegged
to 1 US dollar through a balancing mechanism in
between UST and the chain’s native token LUNA—1
UST could always be redeemed for $1 worth of
(newly minted) LUNA. When the price of 1 UST fell
below $1, arbitrageurs could profit by buying it in
the open market and exchanging it for $1 worth
of LUNA (subsequently burned) , putting upward
pressure on the UST price—the peg is maintained
purely by this seigniorage model rather than
being backed by a fixed pool of collateral.
The idea was that, with time, Anchor would
become self-sustaining, with enough income from
A vulnerability of this model is the embedded
borrowers to pay out to the lenders. However, in
negative feedback loop given that the price
order to attract users, the yield was supported
of LUNA is related to the price of UST. A
by a yield reserve, a stockpile of funds used to
sudden decline in demand for UST could
pay out (collect) in the event of excess lending
cause a drop in the price of LUNA, which
(borrowing). This stockpile was ultimately
could further decrease the demand for UST
backstopped by Terraform Labs (TFL), the
due to increased risk in the system, leading
founder of the Terra blockchain. Though TFL had
to what many have called a “death spiral.”
already topped up the reserve in 2021, it began
to run dry again at the beginning of this year, a
To generate demand for LUNA that was
sign of the persistent imbalance in demand for
independent of the demand for UST, Terra
deposits over borrowing within the protocol.
aimed to create an ecosystem with an army
of applications that had use cases for both,
To quell concerns about the system’s sustainability,
including staking, borrowing & lending, trading,
the Luna Foundation Guard (LFG) was established
and investing. In reality, demand grew in a much
in January to maintain stability across the
less diversified manner, with the majority of
Terra ecosystem. As part of its mission, LFG
network activity concentrated in Terra’s lending
created a UST reserve to act as a source of
platform Anchor Protocol, which initially offered
funds to help maintain the UST peg over the
a fixed ~20% yield (recently modified to a floating
long term. In February, the reserve was again
rate) on deposited UST. The attractiveness of
topped up with $450 million UST from TFL via
the fixed rate yield, and the emergence of DeFi
MONTHLY REVIEW - MAY 2022 14 - 22
MONTHLY REVIEW - MAY 2022 14 - 22the LFG, indicating the systemic importance of 3. A drop in perpetual future funding rates14
Anchor for UST demand. In March, LFG chose and a spike in trading volumes suggest
to diversify its UST reserve and proceeded that LUNA was also being shorted.
to add over $3 billion worth of BTC and
$100 million worth of AVAX to the fund.
Additionally, in an effort to supplant MakerDAO’s
DAI as the main algorithmic stablecoin), Terra
also looked to launch a new heavily incentivized
liquidity pool11 on leading decentralized AMM12
Curve. The main source of UST liquidity on Curve
at the time was the UST-3pool liquidity pool,
which paired UST with “3pool”, itself a liquidity
pool made up of USDC, USDT, and DAI (3pool
is the largest stablecoin pool on Curve). By
launching a new pool named “4pool”, UST would
be included as a base asset alongside USDC,
USDT, and another algorithmic stablecoin FRAX—
this would enable UST to be traded directly On May 8, LFG decided to lend $750 million
with the three other stablecoins and exclude worth of BTC to OTC trading firms so they could
Terra’s competitor DAI from the equation. help defend the peg, and $750 million worth of
UST to accumulate more BTC once the market
But trouble began on the weekend of May 7, with stabilized. Conditions continued to deteriorate,
strong directional flow out of UST as Anchor however. On Monday, May 9, the price of UST—
suffered billions of dollars of withdrawals, which is supposed to be pegged at $1—had
combined with heightened volatility in LUNA and slipped below $0.70 as nervousness about the
BTC. This was exacerbated by three factors: stablecoin’s resilience picked up. A flood of
sell orders with few buyers on the other side
1. What seemed like a coordinated sale of dried up spot market liquidity, pushing the UST
UST on Binance and a liquidity drain13 price down even further. Early UTC morning
of UST in its leading Curve pool (UST- on Wednesday, May 11, it reached $0.30.
3pool)—this led to lower-than-normal
liquidity due to the in-progress transition This coincided with a weakening of overall market
into the new 4pool, which made it sentiment triggered by a worse-than-expected
easier for the UST price to depeg. US CPI number, released on Wednesday, May
11, which hit all risk markets. The resulting
2. An apparent short sale of approximately $3 sharp drops in crypto asset prices weakened
billion worth of BTC, which pushed the BTC confidence in the UST peg even further. By the
price down further, adding to market jitters. end of Thursday, May 12, UST was below $0.20.
11 In a “liquidity pool”, users deposit pairs of assets in exchange for rewards, usually in the form of native application tokens.
12 AMM = automated market maker, or decentralized exchanges (also known as DEXes), in which pools of assets rebalance the supply to maintain arbitrage-driven
equilibrium pricing.
13 $85 million UST was deposited into the Curve pool, and in exchange $85 million of USDC was taken out, removing that possible exit for others hoping to swap UST
for USDC—to rebalance, the liquidity pool would need an inflow of demand for UST. While there was some of this, it ultimately was not enough.
14 Perpetual futures are futures contracts with no set expiry date that keep the contract price in line with the underlying asset price via a mechanism known as the
funding rate, in which long position holders pay short position holders (and vice versa) according to the net balance of contracts outstanding. If there are more
short positions open than long positions, the funding rate will be negative.
MONTHLY REVIEW - MAY 2022 15 - 22
MONTHLY REVIEW - MAY 2022 15 - 22Meanwhile, not only was LUNA being hit by what appeared to be a short sale, but
it was also being pummeled by a rapidly escalating supply as investors tried to use
the redemption mechanism to exchange their UST for LUNA. Supply shot up from
approximately 340 million at the beginning of the week to over 6.5 trillion by the time
the Terra blockchain was halted on May 12. The price of LUNA entered the week at
just over $64, and exited at below $0.0002, a market cap loss of over $20 billion.
The fallout has seen the Terra community vote through a proposal to create a new
chain, with the launch of Terra 2.0 which enables projects to continue building on
the network, but without the algorithmic stablecoin at its core. Its native token is now
the new Terra LUNA, with the original being rebranded to Terra LUNA Classic.
MONTHLY REVIEW - MAY 2022 16 - 22
MONTHLY REVIEW - MAY 2022 16 - 225 DeFi
Stablecoins DAI losing 45% and 17% of their market caps,
respectively.
Fiat-backed stablecoins USDC and BUSD saw
inflows as they were among those to benefit from
concerns over Tether’s peg. Though DAI lost its
position as the largest non fiat-backed stablecoin
to UST late last year, it has since regained its
dominance with its market share back to over 60%.
In terms of performance, fiat-backed stablecoins
experienced lower volatility than their counterparts
as per usual but no other major stablecoin saw a
significant depeg with the notable exception of
As the largest non-fiat-backed stablecoin at the Waves protocol’s USDN, which saw intraday moves
time, the collapse of UST had a dramatic impact below 40 cents before recovering towards the end
on the stablecoin landscape. Despite stablecoins of May. The jury is out on whether the UST collapse
of all types experiencing outflows during the will turn out to be proof that algorithmic stablecoins
aftermath (including fiat-backed stablecoin USDT, are a flawed concept or whether different design
whose market cap—the largest of all stablecoins— choices could be successful in the future. That
fell over $10bn in the second half of May), the said, the event has highlighted the importance of
largest redemptions in percentage terms were felt understanding nuances in this space and that not
in the non fiat-backed categories, with FRAX and all stablecoins are created equal.
MONTHLY REVIEW - MAY 2022 17 - 22
MONTHLY REVIEW - MAY 2022 17 - 22DeFi Impact but the heavy USDX selling caused it to also
depeg, and by the end of May, its TVL was over
The repercussions of the implosion of UST and 35% lower than at the beginning of the month.
LUNA were felt beyond the Terra network,
reaching the leading DeFi platforms and In some cases, a price oracle failed to reflect the
highlighting their inherent strengths and true price of tokens that serve as the base of
weaknesses. collateralized loans. For instance, decentralized
lending and borrowing protocols Blizz Finance
(Avalanche) and Venus (Binance Chain) suffered a
significant loss because Chainlink stopped
updating the LUNA price when it fell below $0.10,
allowing users to lend LUNA when it was trading
at $0.01 and borrow against it 10x more assets
than possible under normal conditions.
Not all was negative, however. Decentralized AMM
Curve’s total value locked (TVL) may have sharply
dropped in May, but its trading volume and
In some cases, developer error led to “permitted” revenue spiked as users scrambled to exit UST
exploits as UST depegged. An example is positions. In a move designed to cement the exit
Cosmos-based Kava Network, which had the of UST from the Curve platform, stakeholders
value of UST hard-coded at $1. This allowed users voted to end CRV incentives for UST-related pools
to mint USDX (Kava’s native stablecoin) in given the the possibility of their being bribed to
exchange for UST deposits at a significant attract exit liquidity for UST at the expense of new
premium before selling them for other assets on LPs, and of a “malicious entity” using the UST
Kava Swap. UST was swiftly de-activated on Kava, depeg to farm outsized influence in the Curve
DAO.
MONTHLY REVIEW - MAY 2022 18 - 22
MONTHLY REVIEW - MAY 2022 18 - 226 Regulation
Stablecoin Regulation While additional scrutiny from authorities does
raise the risk of over-protectionism and
Discussions around stablecoin regulation had
centralizing barriers, greater clarity around
been gaining momentum even without May’s
stablecoin issuance and backing could bring even
events. Hearings on the topic have been held
more liquidity into the market as trust in the
across a wide variety of regulators and legislative
issuers increases and as regulatory concerns
bodies, with a crescendo of calls for investigation
abate. This is significant given the intensifying role
into and rules around what many politicians see as
that stablecoins play in the crypto ecosystem.
potential systemic risk posed by a stablecoin
collapse.
The steep increase in the market cap since early
The implosion of what was the largest algorithmic 2021 up until the May crash of USDC and USDT
stablecoin at the beginning of the month has no (the market’s two largest stablecoins) highlights
doubt made regulators around the world pay even the demand for these types of assets.
more attention to this increasingly important
corner of the crypto market.
Among the intensified calls for crypto regulation:
→ We saw statements by officials from the US
Federal Reserve, the European Central Bank
and the UK’s Financial Conduct Authority
stressing the need for guardrails against the
potential systemic risk posed by stablecoins.
→ The UK government recommended amending
existing legislation to address such risks,
including giving the Bank of England oversight
of the administration of failed stablecoin issuers. The drop in USDT since the UST collapse (see
“Layer-1s” above) is a reflection of the relative
→ US Treasury Secretary Janet Yellen cited the market confidence in its issuer Tether (based
UST depeg as an example of the potential in the British Virgin Islands) compared to that
dangers of stablecoins. She recognized that the of USDC (issued by the US-based Centre
threat to financial stability was low, but that the Consortium, founded by Circle and Coinbase).
growth of the industry meant that could change.
However, Tether’s latest attestation report shows
→ South Korea’s National Assembly held an an improvement in the maturation and quality of
emergency seminar to discuss the impact on the assets backing USDT, although it is as yet
investors and the role of exchanges. (The CEO unclear what impact the redemptions may have
of Terraform Labs, the developer of the Terra had on the mix. And it is notable that the more
network, is a citizen of South Korea.) than $10 billion of redemptions of USDT in May
were met apparently without a hitch.
MONTHLY REVIEW - MAY 2022 19 - 22
MONTHLY REVIEW - MAY 2022 19 - 22CFTC acknowledged that the proposal could lead to
“more efficient trading execution” and “less risk in
Amidst the turmoil of the market crash, signs of a the system”.
totally different significant shift – one that could
impact not just crypto but also traditional The FIA recognizes that the FTX plan is
markets—were largely overlooked. “innovative”, possibly “transformative” yet still
lacking in detail. It also stresses the need for
In mid-May, in full market melt-down, the US human intervention in markets and the potential
House Agriculture Committee held a hearing to for a destabilizing liquidation cascade in more
discuss a proposal by FTX.US Derivatives to automated systems. In addition, it insists that 24/7
amend its DCO15 license to allow it to offer account management would be impractical
cleared, margined derivatives products directly to outside crypto —the banking system just doesn’t
retail customers. This would be a notable change work that way.
to the current system in which FCMs16 collect
margin, ask for top-ups when necessary (usually Change of the magnitude FTX is proposing will
overnight), and commit to mutualizing losses in take time, and legacy market participants are
the event of a broker default. FTX proposes to obviously going to fight their corner. But the
bypass the brokers by requiring customers to receptiveness so far—while laden with caveats—is
deposit collateral directly in FTX accounts. Margin encouraging, and signals an awareness that
requirements would be calculated every 30 crypto’s impact is likely to go far beyond that of
seconds, with automated liquidations initially in new products.
10% increments.
Even more importantly, it highlights how the
May’s hearing convened witnesses such as the advantages inherent in much of crypto asset
CEOs of the CME, the Futures Industry market infrastructure can spill over into other
Association (FIA) and the Intercontinental markets. If approved, the FTX proposal could set a
Exchange, as well as crypto industry precedent for further reforms, and a gradual
representatives including FTX’s CEO Sam progress toward greater market liquidity,
Bankman-Fried. The mood was apparently transparency, resilience and investor choice.
defensive, with Representative David Scott
(D-GA), chair of the House Ag Committee (which
oversees the CFTC), calling the FTX proposal “an
emerging and worrisome threat.”
The CFTC followed up with a roundtable on May
25, with stakeholders from the derivatives trading
industry as well as key crypto market participants.
From the outset, the CFTC has shown a
willingness to engage on this (DCO modifications
do not require public scrutiny, and yet this one is
getting that), and its chair Rostin Behnam has
15 Derivatives Clearing Organization
16 Futures Commission Merchants
MONTHLY REVIEW - MAY 2022 20 - 22
MONTHLY REVIEW - MAY 2022 20 - 22About Genesis Stay Connected
For more information from
Genesis is a full-service digital currency prime brokerage
this report, contact us at
providing a single point of access for select qualified individuals
info@genesistrading.com,
and global institutional investors. Genesis combines unrivaled
or call us at (212) 668-5921.
operational excellence, a seamless user experience, and
best-in-class client service to provide the full suite of services
www.genesistrading.com
global investors require to manage their digital asset portfolios.
Twitter
The firm offers sophisticated market participants a
LinkedIn
fully-integrated platform to trade, borrow, lend, and custody
Facebook
digital assets, creating new opportunities for yield while
increasing capital efficiency for counterparties.
Learn More About
Genesis is a wholly owned subsidiary of Digital Currency Group
Our Services
(DCG), one of the largest private investors in blockchain and
digital asset companies. About Genesis
Genesis Prime
Lending FAQ
Custody FAQ
Genesis May 2022 Monthly Report by:
Noelle Acheson, CFA
Head of Market Insights
nacheson@genesistrading.com
Ainsley To, CFA
Senior Research Analyst
ato@genesistrading.com
Special thanks to:
Julie Ros, Julian Frost
MONTHLY REVIEW - MAY 2022 21 - 22
MONTHLY REVIEW -MAY 2022 21 - 22Disclosures
This research is for our clients only. Other than disclosures relating to Genesis, this research is based on current public information
that we consider reliable, but we do not represent is accurate or complete. This research should not be relied upon as investment
advice. The information, opinions, estimates and forecasts contained herein are as of the date hereof and are subject to change without
prior notification. We seek to update our research as appropriate. Other than certain industry reports published on a periodic basis,
the large majority of reports are published at irregular intervals as appropriate in the analyst’s judgment. Genesis conducts a global
prime brokerage service, integrating digital asset lending, trading, and custodial services. Genesis Global Trading, Inc., registered in
the United States with the SEC as a broker-dealer, is a member of SIPC (https://www.sipc.org). SIPC coverage does not cover digital
assets, virtual currency, cryptocurrency, or other related assets. Our salespeople, traders, and other professionals may provide oral or
written market commentary or trading strategies to our clients and principal trading desks that reflect opinions that are contrary to the
opinions expressed in this research. The analysts named in this report may have from time to time discussed with our clients, including
Genesis salespersons and traders, or may discuss in this report, trading strategies that reference catalysts or events that may have a
near-term impact on the market price of the digital assets discussed in this report, which impact may be directionally counter to the
analyst’s published price target expectations for such digital assets. Any such trading strategies are distinct from and do not affect the
analyst’s fundamental rating or commentary for such digital assets. We and our affiliates, officers, directors, and employees, will from
time to time have long or short positions in, act as principal in, and buy or sell, the digital assets and securities or derivatives thereof, if
any, referred to in this research. The views attributed to third party presenters at Genesis-arranged conferences, including individuals
from other parts of Genesis or its parent, Digital Currency Group (DCG), and any affiliates or subsidiaries of thereof, do not necessarily
reflect those of Genesis and are not an official view of Genesis. Any third party referenced herein, including any salespeople, traders and
other professionals or members of their household, may have positions in the products mentioned that are inconsistent with the views
expressed by analysts named in this report. This research is not an offer to sell or the solicitation of an offer to buy any security in any
jurisdiction where such an offer or solicitation would be illegal. It does not constitute a personal recommendation or take into account
the particular investment objectives, financial situations, or needs of individual clients. Clients should consider whether any advice or
recommendation in this research is suitable for their particular circumstances and, if appropriate, seek professional advice, including tax
advice. The price and value of any investments referred to in this research and the income from them may fluctuate. Past performance is
not a guide to future performance, future returns are not guaranteed, and a loss of original capital may occur. Fluctuations in exchange
rates could have adverse effects on the value or price of, or income derived from, certain investments. Certain transactions, including
those involving futures, options, and other derivatives, give rise to substantial risk and are not suitable for all investors.
MONTHLY REVIEW -MAY 2022 22 - 22You can also read