Manipulating Twitter Through Deletions
←
→
Page content transcription
If your browser does not render page correctly, please read the page content below
Manipulating Twitter Through Deletions

                                                     Christopher Torres-Lugo* , Manita Pote* , Alexander Nwala, and Filippo Menczer
                                                                         Observatory on Social Media, Indiana University, Bloomington, USA
arXiv:2203.13893v1 [cs.SI] 25 Mar 2022

                                                                     Abstract                                 Yang et al. 2020; Sayyadiharikandeh et al. 2020) and groups
                                                                                                              of accounts coordinated to accomplish a task (Pacheco et al.
                                           Research into influence campaigns on Twitter has mostly re-        2021). Most of these research efforts suffer from a common
                                           lied on identifying malicious activities from tweets obtained
                                                                                                              limitation, namely, the reliance on data provided by public
                                           via public APIs. These APIs provide access to public tweets
                                           that have not been deleted. However, bad actors can delete         APIs that exclude deleted content. Bad actors can strategi-
                                           content strategically to manipulate the system. Unfortunately,     cally create and delete high volumes of content to manipu-
                                           estimates based on publicly available Twitter data underesti-      late a platform; the traces of these behaviors may be gone
                                           mate the true deletion volume. Here, we provide the first ex-      before they can be detected or studied. To compound the
                                           haustive, large-scale analysis of anomalous deletion patterns      challenges of detection, platform-wide deletion data is not
                                           involving more than a billion deletions by over 11 million ac-     widely available.
                                           counts. We find that a small fraction of accounts delete a large      Once a tweet is posted, it could be deleted for multiple
                                           number of tweets daily. We also uncover two abusive behav-         legitimate reasons, for example to correct mistakes, protect
                                           iors that exploit deletions. First, limits on tweet volume are     privacy (Ringel and Davidson 2020), or in regret (Zhou,
                                           circumvented, allowing certain accounts to flood the network
                                                                                                              Wang, and Chen 2016). Deletions can be performed by
                                           with over 26 thousand daily tweets. Second, coordinated net-
                                           works of accounts engage in repetitive likes and unlikes of        users through the Twitter app, website, third-party services
                                           content that is eventually deleted, which can manipulate rank-     (TweetDelete 2021; Matthews 2020), and the Twitter API.1
                                           ing algorithms. These kinds of abuse can be exploited to am-       In addition, Twitter continuously deletes tweets and ac-
                                           plify content and inflate popularity, while evading detection.     counts that violate platform policies2 ; all tweets posted by
                                           Our study provides platforms and researchers with new meth-        deleted accounts are automatically removed.
                                           ods for identifying social media abuse.                               Despite Twitter’s enforcement efforts, many actors con-
                                                                                                              tinue to abuse the platform and evade detection by the
                                                                                                              strategic use of deletions (Elmas et al. 2021). In this study
                                                             INTRODUCTION                                     we present the first systematic, large-scale, and exhaustive
                                         Originally envisioned as a way to keep in touch with friends         analysis of anomalous deletion patterns on Twitter. This is
                                         and family, social media platforms have become the pri-              made possible by leveraging the Twitter Compliance Fire-
                                         mary means for spreading disinformation and conspiracy               hose (CF), a stream of notifications sent to developers that
                                         theories (Lazer et al. 2018). The popularity of social me-           store Twitter data. The CF is available only to paying sub-
                                         dia platforms like Twitter has attracted bad actors seeking          scribers of the Twitter Enterprise APIs. It is meant to be used
                                         to manipulate the attention of millions of users through in-         to honor the expectations and intent of end users.3 After a
                                         fluence operations. These are well documented (Prier 2017)           tweet or like is deleted, a CF notice is sent to the stream to
                                         and take multiple forms, such as the use of social bots (Fer-        ensure that developers that stored such content delete their
                                         rara et al. 2016) to manipulate public opinion (Shao et al.          copy within 24 hours.
                                         2018) thereby endangering the democratic process (Wool-                 We analyzed metadata of about 1.2B deletions by 11.6M
                                         ley and Howard 2018), the economy (Fisher 2013), or pub-             accounts, collected from the compliance stream during 30
                                         lic health (Tasnim, Hossain, and Mazumder 2020; Allington            consecutive days between April 26 and May 25, 2021. As
                                         et al. 2021; Pierri et al. 2021; Yang et al. 2021). It is there-     detailed in later sections, our research focuses on abusive
                                         fore more important than ever to study and contain abusive           behaviors involving deletions rather than legitimate uses of
                                         behavior on social media platforms.                                  deletions. Furthermore, to respect user privacy, we consider
                                            Researchers have responded by developing algorithms               1
                                         for identifying different kinds of suspicious activities, for            developer.twitter.com/en/docs/twitter-api/v1/tweets/post
                                                                                                                  -and-engage/api-reference/post-statuses-destroy-id
                                         example, accounts controlled by bots (Yang et al. 2019;              2
                                                                                                                  help.twitter.com/en/rules-and-policies/enforcement-opt
                                         * Equal contributions.                                                   ions
                                                                                                              3
                                         Copyright © 2022, Association for the Advancement of Artificial          developer.twitter.com/en/docs/twitter-api/enterprise/com
                                         Intelligence (www.aaai.org). All rights reserved.                        pliance-firehose-api/overview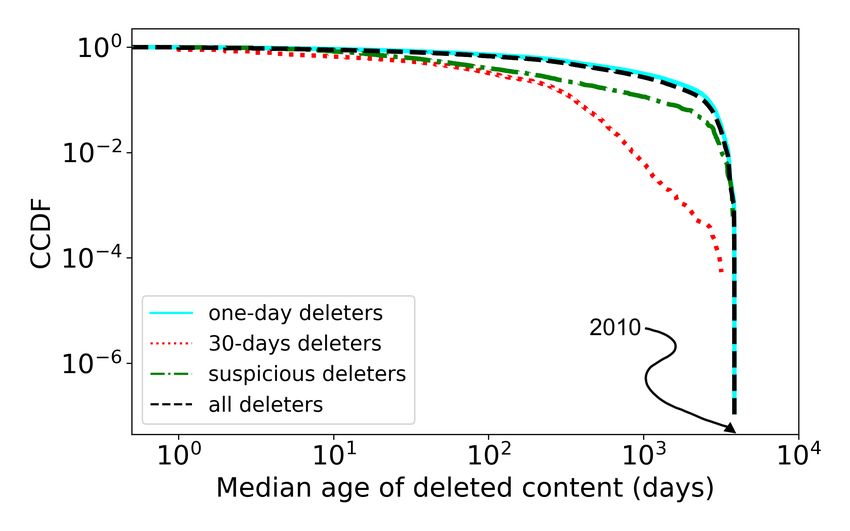
only deletion metadata and not deleted content.                   ion or promote discord (Broniatowski et al. 2018). Bosh-
  This paper makes four primary research contributions:           maf et al. (2011) demonstrated that social networks like
1. The CF service is not freely available, therefore quantita-    Facebook are vulnerable to large-scale infiltration by social
   tive studies of deletions have relied on estimates based       bots. Coordination between inauthentic accounts is an effec-
   on changes in tweet counts (Yang et al. 2021; Torres-          tive strategy of amplifying their effect (Zhang et al. 2016;
   Lugo, Yang, and Menczer 2020). We measure the extent           Pacheco et al. 2021). Coordination has been successfully de-
   to which such methods underestimate the true number of         ployed in spreading propaganda and disinformation globally
   deleted tweets.                                                (Woolley 2016).
2. We provide the first in-depth analysis of compliance data      Metric inflation
   to statistically characterize anomalous deletion behaviors.
   This is useful in distinguishing between normal deletion       Social media ranking algorithms are tuned to favor pop-
   patterns and suspiciously high numbers and frequencies         ular items because popularity and engagement are widely
   of deletions, which could indicate abuse.                      used as a proxy for quality or authority — even though
                                                                  this strategy can amplify low-quality content (Ciampaglia
3. We uncover multiple cases of ongoing abuse on Twitter
                                                                  et al. 2018). This incentivizes the manipulation of popu-
   through the strategic use of deletions. This includes ac-
                                                                  larity/engagement indicators, such as the number of likes,
   counts that circumvent Twitter’s 2,400 daily tweet limit4
                                                                  shares, and followers, as a way to increase exposure, influ-
   through large-volume deletions and coordinated networks
                                                                  ence, and financial gain. This has resulted in a marketplace
   of accounts that engage in repetitive likes and unlikes of
                                                                  where the services of accounts that inflate the popularity of
   content that is eventually deleted, which can manipulate
                                                                  a post or individual can be purchased. On Facebook, for ex-
   ranking algorithms.
                                                                  ample, De Cristofaro et al. (2014) studied like farms, where
4. Finally, we characterize accounts engaged in abusive           likes can be purchased for Facebook pages, revealing that
   deletion behaviors. We find that frequent and suspicious       such farms differ in the level of sophistication they employ
   deleters tend to have higher bot scores, profile descrip-      to evade detection.
   tions related to restricted activities, and mixed suspension      Ratkiewicz et al. (2011) investigated political astroturf
   rates.                                                         campaigns, whereby an entity controls a group of accounts
   These findings demonstrate that deletions must receive         to create the appearance of widespread support for an indi-
greater attention by researchers and platforms as a vehicle       vidual or cause. They provided a machine-learning frame-
for online manipulation.                                          work leveraging network features to distinguish astroturf
                                                                  campaigns from true political dialogue and revealed mul-
                   RELATED WORK                                   tiple instances of such campaigns preceding the 2010 US
                                                                  midterm elections. Cresci et al. (2015) proposed a machine-
We can categorize different kinds of social media manipula-       learning method for detecting fake Twitter followers, pur-
tion into three classes based on whether they are carried out     chased to create a facade of popularity. Manipulation is not
through inauthentic and/or coordinated behaviors, metric in-      restricted to automated accounts; Dutta et al. (2018) studied
flation, or posting and deleting content. Here, we survey re-     the activities of ordinary users who collude in retweeting to
search into influence operations, which has thus far focused      boost the popularity of each other’s posts.
on the first two classes. This paper focuses on the last class.

Inauthentic and coordinated behaviors                             Posting and deleting
The use of software agents — known as social bots (Ferrara        Research on platform manipulation has primarily used pub-
et al. 2016) — to produce content and interact with humans        lic APIs, which ignore deletions by design — in order to
on social media has been studied extensively. Early studies       protect privacy and respect user intent. There are however
of abuse on social media identify spamming as the main goal       a few studies that highlight a new form of manipulation in
of early bots. Yardi et al. (2010) demonstrated the existence     which malicious actors post and delete content to evade de-
of spam on Twitter, and found that spam and non-spam ac-          tection, which is the focus of this paper. Elmas et al. (2021)
counts differ across network and temporal dimensions. Early       identified the existence of coordinated accounts that publish
spambots were simple, having little or no personal informa-       large volumes of tweets to create a trending topic, at which
tion (Cresci 2020), and easy to detect with strategies that       time they delete their tweets to hide the origin of the trend.
target naive behaviors (Lee, Eoff, and Caverlee 2011).            Follow-train accounts, which seek to create echo chambers
   More recently, as platforms have moved to curtail inau-        and amplify spam or partisan content, have also been found
thentic activities, bot operators have responded by evolv-        to publish and delete large volumes of tweets (Torres-Lugo,
ing their tactics to avoid detection and suspension (Varol        Yang, and Menczer 2020).
et al. 2017; Yang et al. 2019). This has led to bots that            Malicious deletion behavior is not limited to Twitter;
mimic human-like accounts with detailed personal informa-         the news media have reported that QAnon-linked YouTube
tion and social connections (Cresci 2020), working as in-         channels delete their videos to avoid content moderation.5
dividuals or coordinated groups to influence public opin-
                                                                  5
                                                                      www.cnet.com/features/qanon-channels-are-deleting-thei
4
    help.twitter.com/en/rules-and-policies/twitter-limits             r-own-youtube-videos-to-evade-punishment/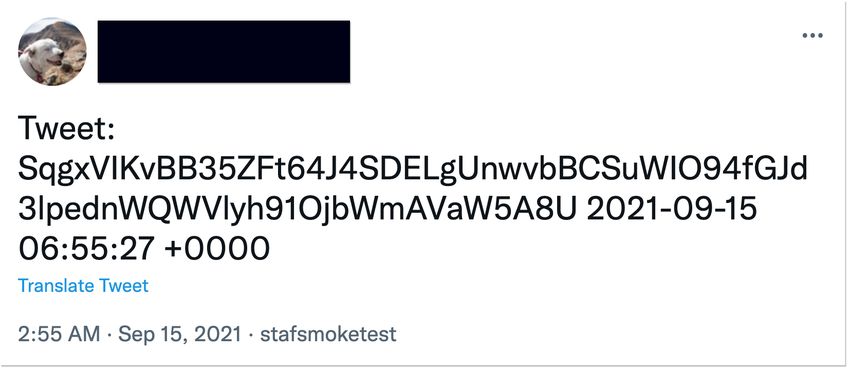
Table 1: Sizes and and descriptions of account categories in the CF stream dataset. We only consider accounts that deleted at
least 10 tweets per day.

    Category              % Deletions    # Accounts     % Accounts   Description
    All deleters               100%      11,648,492          100%    All accounts in our dataset
    One-day deleters             34%       7,938,077          68%    Accounts that delete tweets on one day only
    30-days deleters              4%          27,065        0.23%    Account that delete tweets each day in 30-day dataset
    Suspicious deleters           1%           1,715       0.015%    Accounts that post over the 2,400 daily tweet limit

                 DATA COLLECTION                                 until past midnight to determine which accounts deleted at
The Compliance Firehose stream is a service available to         least 10 tweets the prior day. Second, querying a large col-
subscribers of Twitter’s premium streaming services. The         lection of user objects daily required throttling requests due
stream transmits notifications for state changes to accounts,    to the Twitter API’s rate limit.
tweets, and favorites.6 Our study leverages the limited meta-       We analyzed deletion metadata for accounts that were still
data included in CF notifications. This includes the action      active or suspended within 24 hours of their tweet dele-
(e.g., tweet deletion or like deletion), the id of the account   tion notices. Suspended accounts are relevant to our analy-
taking the action, the id of the object of the action, and       sis because they can delete tweets. Note that some accounts
a timestamp. We disregard other user compliance notifica-        switched between being active and suspended. We use the
tions, such as making an account private, removing geotags,      terms active days and suspended days to characterize the pe-
or suppressing content in certain countries.                     riods in which accounts are in these states.
   We analyzed the compliance stream for 30 consecutive             Overall, our dataset includes metadata for almost 1.2B
days, between April 26 and May 25, 2021. We honored user         deletions by over 11.6M accounts (Table 1). We catego-
privacy by only examining deletion metadata and not deleted      rized accounts into categories based on whether they deleted
content. This ensures that our use of the compliance data        tweets only occasionally (one-day deleters) or daily (30-
is consistent with Twitter guidelines. Our research aims to      days deleters) during the span of our collection. We also
focus on abusive behaviors involving deletions rather than       identified accounts that violated Twitter’s limit of 2,400
legitimate uses of deletions (as discussed in the Introduc-      tweets per day (suspicious deleters), as explained later.
tion). To this end, and assuming that the vast majority of          Additionally, we retrieved all the unlike notices during the
small-volume deletions are legitimate, we only consider ac-      data collection period for tweets included in our dataset.
counts that delete over 10 tweets per day. This is an admit-
tedly arbitrary threshold, but it does not imply that anyone             ESTIMATING THE NUMBER OF
who deletes more than 10 tweets daily is suspicious; it only                  DELETED TWEETS
excludes from the analysis those who delete less, assuming
they are legitimate. Our focus is on accounts that delete a      Researchers who do not have access to the CF may wish to
much larger volume.                                              estimate the number of tweets deleted by an account in some
   Each day, we parsed the tweet deletion notices to identify    time interval, for example to examine whether the account is
accounts that deleted at least 10 tweets in the previous 24-     engaging in suspicious activities. This can be done by com-
hour period. For these accounts, we queried the Twitter user     paring the tweet counts at two times: if the count decreases,
object API. A user object is returned if an account is active.   the difference can be used to estimate the number of deleted
Else, the API returns a notification with the reason it is un-   tweets (Yang et al. 2021; Torres-Lugo, Yang, and Menczer
available (suspended or deleted). 30 days after an account       2020). For example, if an account has 500 tweets on Monday
is deleted, Twitter deletes all of its tweets. This generates    and 400 tweets on Tuesday, then we infer that it must have
a large number of deletions that are not interesting for the     deleted at least 100 tweets between Monday and Tuesday.
purposes of our analyses. Therefore, we discarded deleted        This estimate is a lower bound on the true number of deleted
accounts. We queried the user object API rather than relying     tweets — the account might actually have deleted, say, 150
on account deletion notices in the CF because there may be       tweets and then posted 50 new ones, yielding the same dif-
a delay of more than 30 days between the time an account         ference of 100. If the number of tweets increases or stays
is deleted and the time when all of the account’s tweets are     constant, we cannot infer any number of deleted tweets; the
deleted. The user object also contains additional metadata,      account might have deleted nothing, or might have deleted
such as tweet counts and profile descriptions, that are ana-     fewer tweets than it posted during the time interval.
lyzed in later sections.                                            To assess the extent to which such estimates can accu-
   There was a misalignment of up to a few hours between         rately quantify deletion behaviors, let us compare the esti-
the 24-hour interval in which CF notices were aggregated         mates of deleted tweets obtained by this approach with the
and the time when the user objects were queried from the         actual numbers obtained from CF metadata. We start from
API. This was due to two constraints. First, we had to wait      the tweet count (statuses count) field in the user ob-
                                                                 ject, which reports the total number of tweets ni (t) posted
6
    developer.twitter.com/en/docs/twitter-api/enterprise/com     by an account i at time t. Our comparison can leverage tweet
    pliance-firehose-api/guides/compliance-data-objects          counts and true deletion counts for each account and each
day in our dataset.
   Let us denote by dia (∆t) and die (∆t) the actual and esti-
mated daily numbers of tweets deleted by account i during
time ∆t, respectively (in our data, the maximum time reso-
lution is ∆t = 1 day). For the simple case in which tweet
counts are available for two consecutive days t and t + 1, if
ni (t + 1) < ni (t) and the true deletion count is above 10 for
the interval (t, t + 1), we can use
                die (∆t) = ni (t) − ni (t + 1).            (1)
Note that we only estimate the number of deleted tweets for
accounts and days such that Eq. 1 yields a positive estimate;
as explained above, we cannot infer any deletions otherwise.
   There are two more complicated “gap” cases such that
∆t = t2 − t1 > 1: (1) we may not have actual deletion
counts for one or more consecutive days, either because the
account did not delete any tweets, or because they deleted
fewer tweets than our threshold of 10; and/or (2) we may not
have tweet counts for one or more consecutive days, because
the account was suspended. In both of these cases we are
still able to estimate the daily number of deleted tweets by
considering the last day t1 when a tweet count was available
(the account was active), and the first day t2 when the tweet
count and actual deletion data are both available:
                             ni (t1 ) − ni (t2 )
                  die (∆t) =                              (2)
                                  t2 − t1
where ni (t1 ) > ni (t2 ).                                        Figure 1: Comparison between estimated vs. actual numbers
   Note that while the tweet counts are obtained from the         of daily deleted tweets. Top: Heat map of the joint distribu-
Twitter user object API, the accounts that we query are those     tion. Bottom: Complementary cumulative distribution func-
that appear in the CF. Without access to the CF, one could        tions (CCDF). The two estimated distributions are based on
still estimate the number of deletions from any collection        accounts in the CF (via user object queries) or in a random
of tweets. To explore such a scenario, we collected tweets        sample of tweets (via 1% streaming API).
from the 1% streaming API for 24 hours between December
16–17, 2021. For each user i with at least two tweets, we
estimated the number of deleted tweets die by comparing the       are obtained by considering only cases of consecutive days
tweet counts from the first and last tweet (Eq. 1).               (Eq. 1), i.e., ignoring gaps (Eq. 2).
   The estimates de from Eqs. 1 and 2 and the actual daily           In principle, one could obtain better measurements of
numbers of deleted tweets da are compared in Fig. 1 (top)         deleted tweets without access to the CF. One could use the
for all the data points such that de ≥ 10 — approximately         stream/filter API to retrieve all the tweets that a set of users
1.3M account/day pairs corresponding to over 748K ac-             are publishing in real time. Alternatively, user objects could
counts. We also aggregated the data by taking the median          be queried frequently to achieve better granularity in the dif-
values for each user (not shown), yielding very similar re-       ference between tweet counts. Both of these approaches re-
sults. The diagonal in the heat map represents the cases          quire prior knowledge of which accounts should be moni-
where the estimates are exact. The higher density below the       tored. Further, APIs limit the number of tweets that can be
diagonal indicates that the numbers of deleted tweets are         streamed in real time and the query rates for user objects.
typically underestimated. The presence of points above the        Consequently, neither of these approaches is feasible; there-
diagonal (overestimates) is due to gap cases as well as the       fore, research is hindered by lack of access to deletion data.
misalignment explained in the previous section.
   The cumulative distributions in Fig. 1 (bottom) similarly                   DELETION BEHAVIORS
demonstrate the underestimation. Here we also include the         To focus on abuse involving deletions, we must understand
distribution of estimated deletions obtained from the ran-        what constitutes anomalous deletion behavior. We consider
dom sample of tweets. Kolmogorov-Smirnov tests confirm            three signals: deletion volume, deletion frequency, and age
that the distributions are significantly different (p < 0.01).    of deleted content. These statistics can be extracted from the
The average number of deleted tweets is underestimated by         available data and provide interpretable signals about the be-
45% when considering accounts in the CF (actual 171, esti-        havior of deleting users. For example, accounts that delete
mated 94) and by 34% when considering the random sample           recent tweets but not in high volume are not suspicious be-
of tweets (estimated 113). However, the errors can be much        cause they could be correcting mistakes or using the plat-
larger, by orders of magnitude. Similar results (not shown)       form in an ephemeral way (such as Snapchat messages or In-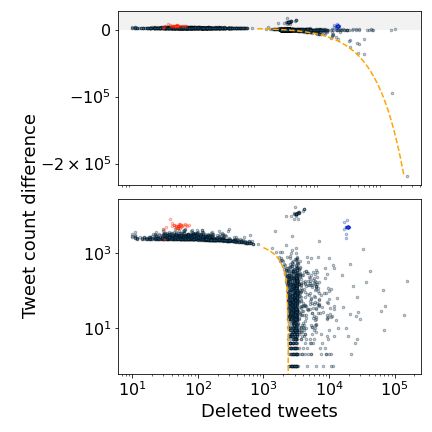
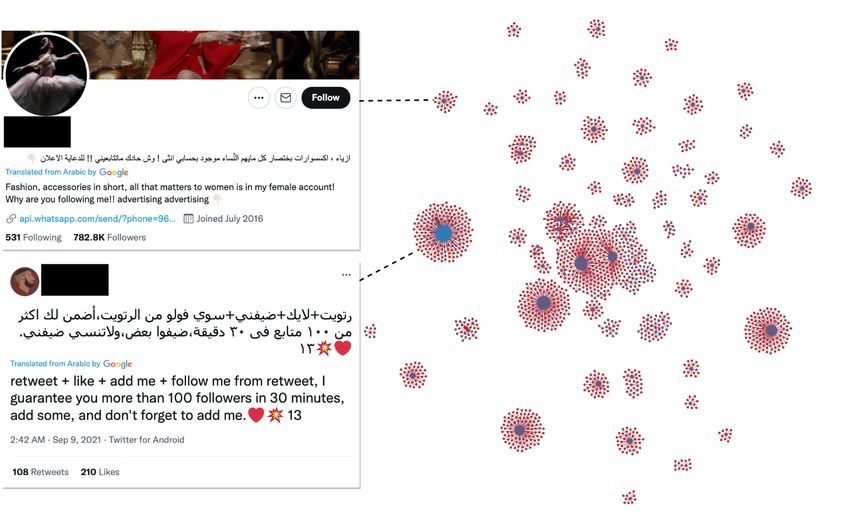
Figure 2: Complementary cumulative distribution of the            Figure 3: Distributions of the average daily numbers of
number of deleted tweets per account that occurred on April       deleted tweets per account, for groups of accounts that delete
26, 2021. Other days produce similar distributions.               at different frequencies during our collection period. Medi-
                                                                  ans are shown as white circles. The highlighted region of the
                                                                  one-day distribution corresponds to Twitter’s timeline API
stagram stories). Similarly, accounts that delete old tweets in   limit of 3,200 tweets.
high volume but not often could be motivated by legitimate
privacy reasons. On the other hand, deleting a large volume
of tweets every day could signal platform abuse, especially
when the deletions target new tweets. Therefore, we focus
on accounts that delete in high volume or high frequency.
   Each day, on average, over 914K accounts delete approx-
imately 40M tweets. To characterize the typical deletion be-
haviors, let us consider the distribution of the number of
tweets deleted daily by individual accounts. Fig. 2 shows
such a distribution for a single, typical day. (Recall that
we only count deletions by accounts that delete at least 10
deletions in a day.) The distribution has a heavy tail, with
most accounts deleting few tweets (the median is 16 deleted
tweets) and a small fraction of accounts deleting a very large
volumes of tweets. For example, 0.04% of accounts delete at
least 3,200 tweets, which strongly suggests the use of dele-
tion software. The rapid drop observable in the plot around       Figure 4: Complementary cumulative distributions of the
2,400–3,200 deletions is likely due to accounts reaching the      median age of content deleted by the four classes of accounts
maximum number of tweets that can be posted in a day              in Table 1. The oldest deleted tweets date back to 2010.
(2,400) and deleting all of them, and accounts deleting the
maximum number of tweets retrievable with the timeline
API (3,200). Our results also show that these accounts tend       days deleters.
to delete newer content.
                                                                     Considering the age of deleted content, Fig. 4 shows that
   To provide additional context about deletion behaviors,        accounts that delete a lot tend to remove newer tweets.
consider how the volume of deletions varies with the fre-         For example, further analysis shows that 50% of one-day
quency at which the deletions occur. Fig. 3 plots the dis-        deleters remove content with a median age of 375 days or
tributions of average daily numbers of deleted tweets for         more, compared to 39 days for 30-days deleters and 57 days
accounts that delete at different frequencies (number of          for suspicious deleters.
days). The highlighted peak in the one-day distribution cor-
responds to approximately 3,200 tweets — the maximum                 To summarize, we find evidence of accounts engaged
number of tweets retrievable from Twitter’s timeline API.         in high-volume, high-frequency deletions of recent content.
We conjecture that mass-deletion tools use this API to ob-        We believe these anomalous behaviors, which deviate from
tain the IDs of the most recent tweets, creating a natural        normal activity by orders of magnitude, are highly suspi-
limit on the number of deletions. Irrespective of deletion fre-   cious.
quency, the medians of the distributions lie between 10 and
100 deleted tweets on average, but we again observe heavy               ABUSIVE DELETION BEHAVIORS
tails with minorities of accounts responsible for majorities of
tweet deletions in all groups. Overall, accounts that delete      Let us explore two types of abuse identified from suspicious
more frequently tend to delete more tweets: the median of         deletion behaviors: high-volume posting (flooding) and co-
the average daily number of deleted tweets is highest for 30-     ordinated manipulation of content recommendation.
Flooding
One of the principal concerns of social media platforms is to
balance a user’s ability to contribute content while keeping
the experience safe for others. Twitter limits the daily num-
ber of tweets that can be posted by an account7 as one of the
measures aimed at safeguarding the user experience. In this
regard, Twitter’s documentation currently states8 :
“Tweets: 2,400 per day. The daily update limit is fur-
ther broken down into smaller limits for semi-hourly
intervals. Retweets are counted as Tweets.”
While this policy suggests that it is not possible to post more
than 2,400 tweets per day, here we determine whether dele-
tions can be exploited to circumvent this limit.
Suppose an account posts a tweet every six seconds, so
that it would reach the limit after four hours. Now the ac-
count deletes 2,400 tweets, and then starts over. In this sce-
nario, the account would circumvent the limit and post a to-
tal of 14,400 tweets in a day. (This is a simplified scenario,
as Twitter has more undisclosed limits for shorter durations.)
To check if this kind of abuse exists, we can estimate
the total number of tweets posted by account i in a day by
adding two numbers: the difference in tweet counts N i (t) = Figure 5: Tweet count difference N vs. number of deleted
ni (t) − ni (t − 1), obtained from user objects across consec- tweets da for suspicious deleters that exceeded the limit of
utive days, and the number of deleted tweets in the corre- 2,400 tweets posted in a single day. The dashed line rep-
sponding time interval dia (t − 1, t), obtained from the CF. resents the threshold N + da = 2,400 tweets. Top: log-
Recall that N i (t) can be negative, indicating that the num- linear plot showing all points corresponding to account/day
ber of deleted tweets is larger than the number of posted pairs circumventing the limit. Bottom: region with positive
tweets in the same day. If instead N i (t) > 0, then the N (highlighted in the top plot) using a log-log scale. Red
account posted more tweets than it deleted. In either case, points correspond to @AmazonHelp (see Discussion sec-
and irrespective of when the deleted tweets were originally tion), while blue points correspond to an account that pub-
posted, N i (t) + dia (t − 1, t) provides the total number of lishes coded content (see Suspensions section for details).
tweets posted during day t. As an illustration, say account i
deleted 100 tweets and posted 80 tweets during day t. Then
N i (t) = −20 and dia (t − 1, t) = 100. The sum gives the originates from large numbers of deleted tweets, which are
actual number of posted tweets, i.e., 80. not matched by decreases in tweet counts. Based on our ob-
To perform this analysis, we identified accounts whose servations, we suspect these may be anomalies caused by
tweet counts could be accessed on consecutive days from stale tweet count data provided by the Twitter API when in-
user objects in our dataset. Note that the tweet count mea- formation about deleted tweets has not yet propagated to the
surements are delayed with respect to the deletion counts, queried data center. To focus on the most likely violators,
due to the misalignment discussed earlier. This means that Fig. 6 also shows the distribution of the number of daily
we have approximate values of the tweet counts and there- tweets for the subset of suspicious deleters that violate the
fore of the total number of tweets posted. limit multiple times. Although the tail of the distribution is
We identified 1,715 suspicious deleters that violated the truncated, we still observe evidence of multiple accounts vi-
2,400-tweets limit at least on a single day, and 120 accounts olating Twitter’s daily limit, sometimes by an order of mag-
that do so more than once. Fig. 5 plots these violations, each nitude (posting over 26K tweets).
corresponding to an account/day pair (i, t). The x-axis rep-
resents the number of deleted tweets dia (t) and the y-axis Coordinated manipulation
represents the difference in tweet counts N i (t). All viola-
tion points are above the line N + da = 2,400 tweets. The like button is a way for Twitter users to signal a positive
In Fig. 6 we visualize the distribution of the number of sentiment toward a tweet. Such signals are used by the plat-
daily tweets N i + dia for suspicious deleters i that exceed form’s feed ranking and recommendation algorithm: tweets
the daily limit. We observe cases of an account posting hun- and users with many likes are prioritized.9 Therefore, likes
dreds of thousands of new tweets in a day. From Fig. 5 we are a potential vector of attack for malicious accounts seek-
can tell that these are cases in which the bulk of evidence ing to amplify content and increase influence by manipulat-
ing the platform.
7
help.twitter.com/en/rules-and-policies/platform-manipu
lation 9
blog.twitter.com/engineering/en us/topics/insights/2017
8
help.twitter.com/en/rules-and-policies/twitter-limits /using-deep-learning-at-scale-in-twitters-timelinesFigure 6: Complementary cumulative distributions of the Figure 7: This diagram illustrates how we connect interac-
numbers of daily tweets exceeding the 2,400-tweet limit. tions between accounts using CF notices. Left panel: We
construct a tripartite network consisting of deleted tweets
(center), accounts that deleted those tweets (left), and ac-
The capacity to study likes is severely constrained by the counts that liked those tweets (right). Right panel: By pro-
rate limits imposed by the Twitter API. However, the dele- jecting the network onto deleters and likers, we get a bipar-
tion stream emits a compliance notice when a like is re- tite network that connects interacting accounts.
moved from a tweet. This occurs when an account unlikes a
tweet or the liked tweet is deleted. There are cases in which
an unlike is warranted, such as when a user retracts an ac- followers. The bottom tweet promises users more than 100
cidental like. However, it is not generally expected behavior followers in 30 minutes if they complete some tasks. These
for an account to repeatedly like and unlike a tweet in short accounts seem to be engaging in inauthentic behavior that
order or over long periods of time. Both of these could be likely violates platform rules.
interpreted as signals of inauthentic behavior by an account.
To identify groups of accounts likely involved in coordi- CHARACTERIZATION OF DELETERS
nated liking and deleting behaviors, we selected accounts In this section we analyze the profiles extracted from the
with multiple unlikes for the same tweet that is eventually Twitter API to characterize some of the accounts that delete
deleted. We adopted a methodology similar to Pacheco et al. frequently and the suspicious accounts that circumvent the
(2021), modified to start from a tripartite network as shown Twitter limit, in an effort to gain additional understanding of
in Fig. 7. This network consists of deleters, deleted tweets, how these malicious actors operate.
and likers. The edges between deleted tweets and likers have
weights that account for the number of unlikes. To focus on Profiles
the most unusual unlikers, we removed 93.5% of accounts Account profiles often include information about the owner
that had unliked the same tweet less than five times — as- and/or their interests. The top two languages of the profile
suming that the like icon could be tapped a few times ac- descriptions of the suspicious deleters and 30-days deleters
cidentally. We then projected the tripartite network into an are English and Japanese. Let us focus on English profiles
unweighted, directed, bipartite network connecting likers to (those in Japanese have similar content). Fig. 9 illustrates
deleters. Finally, we filtered out weakly connected compo- common terms from the profiles of the top/bottom 10% of
nents with less than 10 nodes to focus on the 1.7% most sus- 30-days deleters as well as suspicious deleters. Some of
picious clusters. These represent coordination scenarios in these terms (e.g., follow, backup, promo) could be associ-
which multiple accounts repeatedly like, unlike, and eventu- ated with activities that are restricted on the platform.10 The
ally delete one or more tweets. top 10% of 30-days deleters and the suspicious deleters ap-
The resulting coordinated networks can be seen in Fig. 8. pear to exploit deletions to produce such problematic con-
Since an account can be a liker as well as a deleter, we calcu- tent without being detected, warranting further scrutiny.
lated the ratio between the number of unlikes and deletions
for each node, and used this ratio to color the nodes in the Automation
figure. Most coordinated networks have a deleter (blue hub) Let us use the BotometerLite tool to estimate the prevalence
and several likers (red spokes). of bot-like accounts in our dataset. BotometerLite is a ma-
For illustration purposes, we highlight two clusters in chine learning model that was trained using datasets of bot-
Fig. 8 with screenshots of a hub profile and a tweet, respec- and human-operated accounts. The model has been shown to
tively. These were obtained from the Twitter website and
not from deleted content. The top account self-identifies as 10
help.twitter.com/en/rules-and-policies/platform-manipu
fashion/advertisement-related with hundred of thousands of lationFigure 8: Coordinated network of accounts that repeatedly liked and unliked tweets that were eventually deleted. Node size is
proportional to in-degree. Blue and red nodes represent accounts that are mostly deleters and mostly likers, respectively (see
text). The screenshots highlight the center nodes of two of the networks.
Table 2: Suspension statistics. Among the accounts that are not suspended as of this writ-
ing and that exhibit high volumes of posts and deletions, we
Account type Suspended Total Percentage identified two that tweet coded content. A tweet by one of
Coordinated 379 1,884 20.1% such accounts is shown in Fig. 11. This account (also high-
One-day deleters 579,933 7,938,077 7.3%
30-days deleters 1,725 27,065 6.4%
lighted in Fig. 5) was created in August 2018 and, despite
Suspicious deleters 13 1,715 0.76% deleting large numbers of tweets, still has 7.5 millions tweets
that have not been deleted to date.
achieve high accuracy in cross-validation and cross-domain DISCUSSION
evaluations (Yang et al. 2020). For each account, Botome- We presented the first exhaustive, in-depth study of the dele-
terLite generates a score between zero and one, with zero tion behaviors of Twitter users to identify cases of platform
indicating a more human-like account and one indicating a abuse. We started our analysis by assessing the degree to
more bot-like account. We grouped the accounts as in Fig. 3, which we could estimate the number of deleted tweets with
based on the number of days in which each account deleted tweet counts, which are publicly available, given that the CF
tweets. Fig. 10 shows the distributions of bot scores for ac- service is not freely available. Our findings illustrate that the
counts in each group. We observe that accounts that delete use of tweet counts to estimate the number of deleted tweets
more frequently tend to have higher bot scores. results in an undercount of the actual number of deletions.
We focused on abusive deletion behaviors showing that
Suspensions while most accounts (68% of all users) deleted tweets only
For suspicious deleters and accounts involved in coordinated on a single day, a small subset (0.23%) deleted tweets for all
manipulation, we queried their user objects on September 30 days of our collection period. A smaller subset (0.04%)
12, 2021 using Twitter’s API V2 to see if Twitter had taken deleted on average at least 3,200 tweets daily.
any enforcement action against them. We also queried one- We also identified two cases of platform abuse on Twitter.
day deleters and 30-days deleters as points of reference. First, we identified 1,715 users that utilize deletions to post
The suspension statistics are shown in Table 2. Very few of over 2,400 tweets per day, which exceeds Twitter’s daily
the suspicious deleters have been suspended, suggesting that limit. As shown in Table 1, these suspicious accounts repre-
Twitter has not clamped down on this kind of abuse. sent a tiny fraction of deleters (0.015%), but delete a dispro-Figure 10: Distributions of bot scores for groups of accounts
that deleted tweets between 1 and 30 days.
Figure 9: Word clouds of the text contained in profile de-
scriptions for the top 10% of 30-days deleters (top left), Figure 11: Screenshot of a typical tweet by a suspicious ac-
bottom 10% of 30-days deleters (top right), and suspicious count that tweets and deletes a high volume of coded con-
deleters (bottom). tent.
portionately large number of tweets (over 1%). As a caveat, tweets and users.11 We believe that platforms should
we should note that some accounts might have a special ar- make deletion metadata streams and —with proper pri-
rangement with Twitter allowing them to post more than vacy safeguards— deleted content available to academic re-
2,400 tweets per day. For example @AmazonHelp is one searchers to enable further investigations that could lead to a
of these (see Fig. 5). safer experience for users (Pasquetto, Swire-Thompson, and
others 2020).
Second, we uncovered inauthentic behaviors consisting of
accounts that coordinate to repeatedly like and unlike a tweet
before it is eventually deleted. We suspect that further study Ethics statement
of all unlikes (not just unlikes of deleted tweets) could lead The data analyzed here is provided by Twitter under a li-
to the identification of a significantly higher number of abu- cense that prohibits redistribution. For this reason, as well
sive accounts. This could provide visibility into the opera- as to honor user intent, we are not allowed to make it pub-
tions of commercial metric inflation services. licly available. Also to respect user privacy, we only exam-
Our study is limited by some technical aspects of the data ine deletion metadata and not deleted content. This ensures
collection process, as well as noise in data provided by the that our use of the compliance data is consistent with Twitter
Twitter API. Both of these issues can affect the number of guidelines. Our analysis of public Twitter content is exempt
tweets, and therefore add noise to our downstream analyses from IRB review (Indiana University protocol 1102004860).
to estimate the numbers of deletions and posts.
Despite these limitations, we have shown that content Acknowledgments
deletion metadata can provide valuable insights into a thus- The authors are grateful to Sadamori Kojaku for his help
far neglected form of platform abuse. Access to deleted con- in translating Japanese terms found in the word cloud. This
tent would make it possible to study the impact of malicious work was supported in part by Knight Foundation, Craig
deletion behavior. One could also explore whether content Newmark Philanthropies, and DARPA (contracts W911NF-
generated by suspicious deleters contains patterns that could 17-C-0094 and HR001121C0169). Any opinions, findings,
be used to distinguish them from other users. However, such and conclusions or recommendations expressed in this ma-
access is prohibited by platform terms of service in order terial are those of the authors and do not necessarily reflect
to protect user privacy. This creates a conflict between the the views of the funding agencies.
need to protect user privacy and the need to understand and
combat platform abuse. 11
developer.twitter.com/en/docs/twitter-api/compliance/b
Twitter now makes compliance data available for queried atch-compliance/introductionReferences term study of content polluters on twitter. In Proc. Intl. AAAI
Conf. on Weblogs and Social Media (ICWSM).
[Allington et al. 2021] Allington, D.; Duffy, B.; Wessely, S.;
Dhavan, N.; and Rubin, J. 2021. Health-protective be- [Matthews 2020] Matthews, B. 2020. tweet-delete: Self-
haviour, social media usage and conspiracy belief during the destructing Tweet tool. github.com/brndnmtthws
covid-19 public health emergency. Psychological medicine /tweet-delete.
51(10):1763–1769. [Pacheco et al. 2021] Pacheco, D.; Hui, P.-M.; Torres-Lugo,
[Boshmaf et al. 2011] Boshmaf, Y.; Muslukhov, I.; C.; Truong, B. T.; Flammini, A.; and Menczer, F. 2021.
Beznosov, K.; and Ripeanu, M. 2011. The socialbot Uncovering coordinated networks on social media: Methods
network: when bots socialize for fame and money. In Proc. and case studies. In Proc. International AAAI Conference on
of annual computer security applications conf., 93–102. Web and Social Media (ICWSM), volume 15, 455–466.
[Broniatowski et al. 2018] Broniatowski, D. A.; Jamison, [Pasquetto, Swire-Thompson, and others 2020] Pasquetto,
A. M.; Qi, S.; AlKulaib, L.; Chen, T.; Benton, A.; Quinn, I. V.; Swire-Thompson, B.; et al. 2020. Tackling misinfor-
S. C.; and Dredze, M. 2018. Weaponized health commu- mation: What researchers could do with social media data.
nication: Twitter bots and russian trolls amplify the vaccine HKS Misinformation Review 1(8).
debate. American journal of public health 108(10):1378– [Pierri et al. 2021] Pierri, F.; Perry, B.; DeVerna, M. R.;
1384. Yang, K.-C.; Flammini, A.; Menczer, F.; and Bryden, J.
2021. The impact of online misinformation on u.s. covid-
[Ciampaglia et al. 2018] Ciampaglia, G. L.; Nematzadeh,
19 vaccinations. Preprint 2104.10635, arXiv.
A.; Menczer, F.; and Flammini, A. 2018. How algorith-
mic popularity bias hinders or promotes quality. Scientific [Prier 2017] Prier, J. 2017. Commanding the trend: Social
reports 8(1):1–7. media as information warfare. Strategic Studies Quarterly
11(4):50–85.
[Cresci et al. 2015] Cresci, S.; Di Pietro, R.; Petrocchi, M.;
Spognardi, A.; and Tesconi, M. 2015. Fame for sale: Effi- [Ratkiewicz et al. 2011] Ratkiewicz, J.; Conover, M.; Meiss,
cient detection of fake twitter followers. Decision Support M.; Gonçalves, B.; Flammini, A.; and Menczer, F. 2011. De-
Systems 80:56–71. tecting and tracking political abuse in social media. In Proc.
Intl AAAI Conf. on Weblogs and Social Media (ICWSM).
[Cresci 2020] Cresci, S. 2020. A decade of social bot detec-
tion. Communications of the ACM 63(10):72–83. [Ringel and Davidson 2020] Ringel, S., and Davidson, R.
2020. Proactive ephemerality: How journalists use auto-
[De Cristofaro et al. 2014] De Cristofaro, E.; Friedman, A.; mated and manual tweet deletion to minimize risk and its
Jourjon, G.; Kaafar, M. A.; and Shafiq, M. Z. 2014. Paying consequences for social media as a public archive. New Me-
for likes? understanding facebook like fraud using honey- dia & Society.
pots. In Proc. of the Internet Measurement Conf., 129–136.
[Sayyadiharikandeh et al. 2020] Sayyadiharikandeh, M.;
[Dutta et al. 2018] Dutta, H. S.; Chetan, A.; Joshi, B.; and Varol, O.; Yang, K.-C.; Flammini, A.; and Menczer, F.
Chakraborty, T. 2018. Retweet us, we will retweet you: 2020. Detection of novel social bots by ensembles of spe-
Spotting collusive retweeters involved in blackmarket ser- cialized classifiers. In Proc. ACM Intl. Conf. on Information
vices. In Proc. of Conf. on Advances in Social Networks & Knowledge Management (CIKM), 2725–2732.
Analysis and Mining (ASONAM), 242–249. [Shao et al. 2018] Shao, C.; Ciampaglia, G. L.; Varol, O.;
[Elmas et al. 2021] Elmas, T.; Overdorf, R.; Özkalay, A. F.; Yang, K.; Flammini, A.; and Menczer, F. 2018. The spread
and Aberer, K. 2021. The power of deletions: Ephemeral of low-credibility content by social bots. Nature Communi-
astroturfing attacks on twitter trends. In Proc. of IEEE Eu- cations 9:4787.
ropean Symposium on Security and Privacy. [Tasnim, Hossain, and Mazumder 2020] Tasnim, S.; Hos-
[Ferrara et al. 2016] Ferrara, E.; Varol, O.; Davis, C.; sain, M. M.; and Mazumder, H. 2020. Impact of rumors
Menczer, F.; and Flammini, A. 2016. The rise of social and misinformation on covid-19 in social media. Journal of
bots. Communications of the ACM 59(7):96–104. preventive medicine and public health 53(3):171–174.
[Fisher 2013] Fisher, M. 2013. Syrian hackers claim AP [Torres-Lugo, Yang, and Menczer 2020] Torres-Lugo, C.;
hack that tipped stock market by $136 billion. Is it terrorism. Yang, K.-C.; and Menczer, F. 2020. The manufacture of
washingtonpost.com/news/worldviews/wp/ political echo chambers by follow train abuse on twitter.
2013/04/23/syrian-hackers-claim-ap-hac Preprint 2010.13691, arXiv.
k-that-tipped-stock-market-by-136-bill [TweetDelete 2021] TweetDelete. 2021. TweetDelete - Eas-
ion-is-it-terrorism/. ily delete your old tweets. tweetdelete.net.
[Lazer et al. 2018] Lazer, D.; Baum, M.; Benkler, Y.; Berin- [Varol et al. 2017] Varol, O.; Ferrara, E.; Davis, C. A.;
sky, A.; Greenhill, K.; Menczer, F.; Metzger, M.; Nyhan, B.; Menczer, F.; and Flammini, A. 2017. Online human-
Pennycook, G.; Rothschild, D.; Schudson, M.; Sloman, S.; bot interactions: Detection, estimation, and characterization.
Sunstein, C.; Thorson, E.; Watts, D.; and Zittrain, J. 2018. In Proc. Intl. AAAI Conf. on Weblogs and Social Media
The science of fake news. Science 359(6380):1094–1096. (ICWSM).
[Lee, Eoff, and Caverlee 2011] Lee, K.; Eoff, B. D.; and [Woolley and Howard 2018] Woolley, S. C., and Howard,
Caverlee, J. 2011. Seven months with the devils: A long- P. N. 2018. Computational propaganda: political parties,politicians, and political manipulation on social media. Ox- ford University Press. [Woolley 2016] Woolley, S. C. 2016. Automating power: So- cial bot interference in global politics. First Monday 24(4). [Yang et al. 2019] Yang, K.-C.; Varol, O.; Davis, C. A.; Fer- rara, E.; Flammini, A.; and Menczer, F. 2019. Arming the public with artificial intelligence to counter social bots. Hu- man Behavior and Emerging Technologies 1(1):48–61. [Yang et al. 2020] Yang, K.-C.; Varol, O.; Hui, P.-M.; and Menczer, F. 2020. Scalable and generalizable social bot de- tection through data selection. In Proceedings of the AAAI Conference on Artificial Intelligence, 1096–1103. [Yang et al. 2021] Yang, K.-C.; Pierri, F.; Hui, P.-M.; Axel- rod, D.; Torres-Lugo, C.; Bryden, J.; and Menczer, F. 2021. The COVID-19 Infodemic: Twitter versus Facebook. Big Data & Society 8(1):1–16. [Yardi et al. 2010] Yardi, S.; Romero, D.; Schoenebeck, G.; et al. 2010. Detecting spam in a twitter network. First monday 15(1). [Zhang et al. 2016] Zhang, J.; Zhang, R.; Zhang, Y.; and Yan, G. 2016. The rise of social botnets: Attacks and counter- measures. IEEE Transactions on Dependable and Secure Computing 15(6):1068–1082. [Zhou, Wang, and Chen 2016] Zhou, L.; Wang, W.; and Chen, K. 2016. Tweet properly: Analyzing deleted tweets to understand and identify regrettable ones. In Proc. of the 25th Intl. Conf. on World Wide Web, 603–612.
You can also read