Making life better. Full Year 2021 Results - Glenveagh Homes
←
→
Page content transcription
If your browser does not render page correctly, please read the page content below
Making life better. Full Year 2021 Results

Agenda
Section

Key Operational Highlights          3

Alignment With Market Opportunity   12

Enhancing Delivery Capability       18

Financial Review                    25

Outlook                             32

Key
Key
Operational
Operational
Highlights
Highlights
Key Operational Highlights
Growing A Diversified And Sustainable Business Across Three Segments
                             Suburban                           Urban                         Partnerships

 2021                1,150 units closed (+64%        Material Dublin Docklands          Two landmark           Capital Efficiency &
                     YoY)                            progress including first           agreements for over   Shareholder Returns
                                                     forward fund of PI Hotel           2,050 units

2022                 1,388 suburban unit total       HOTs signed for two                Opportunities from
                     forward order book              forward fund transactions          Housing for All       ✓   Strong Operating Profit of
                                                     for over 500 apartments                                      €51m

Our Stakeholder      •   Six sustainability pillars addressing the areas most material to our stakeholders
                                                                                                              ✓   Net Land reduction of
                                                                                                                  €57m in 2021
Expectations Drive
Strategy
                     •   Governance, management systems and reporting aligned with international standards

Aligned With         •   63% of Suburban portfolio below €350k                                                ✓   Generated over €100m in
                                                                                                                  operating cash
Market
Opportunity
                     •   Supportive of affordable purchase, cost-rental & social housing

Enhancing Delivery   •   Investment in manufacturing to enhance delivery capabilities                         ✓   €108m returned via share
Capabilities
                     •   Over 700 timber frame units in 2021 (2,000 units by 2024)                                buyback programmes

   4
Key Operational Highlights
Suburban – Starter Homes Targeting The Broadest Segment Of Buyers
                                                ✓   902 completions in 2021 (+37% YoY), targeting
 • Attractive product offering – sustainable,       1,400 in 2022
   high-quality homes in flourishing
   communities                                  ✓   Orderbook of 1,028 for 2022 (73% of unit
 • Targeted at segments with deepest                target)
   demand by addressing the housing need
   across society                               ✓   HPI +6% in H2 2021, similar levels expected in
                                                    FY 2022
 • Building Lasting Communities
   programme enhancing attractiveness of        ✓   Increasing demand from Government for cost
   schemes                                          rental with 230 units to be delivered in 2022
 • Dedicated after-care department helped
   drive customer satisfaction rating to 89%    ✓   69% Suburban units in 2021 priced below the
   (2020: 83%)                                      median price of new homes sold in GDA & Cork
 • Customer demand supported by
   increased mortgage levels, a greater
   level of deposits and expanded
   government supports
 • HPI of 6% offsetting the impact of CPI
   with this trend expected to continue
   into 2022

                                            Continued Strong Demand In 2021 Across All Our Suburban Schemes

   5
Key Operational Highlights
Urban – Attractive Portfolio Delivered In Capital Efficient Manner

                                              Strong Demand From Institutions¹
  Urban portfolio of 4,000
          units

                                                                        €2.4bn                                               €2.3bn
 Over 2,400 have planning        Forward                                                           €1.6bn
   permissions in place        funding exit          €1.1bn
                               mechanism
                                                       2018               2019                      2020                       2021
  H1 2022         H2 2022
                                maximises                                             PRS market

 Castleknock   Cluain Mhuire    return on     Affordable Rents Critical To Long-term²
and Citywest   and East Road      capital
 – 500 units    – 700 units

     Longer-term unit                                                                                                     10.3%
                                                         4.1%                         0.9%
  replacement following
  completion of existing                                 2019                          2020                               2021
       transactions                                                              Average rental growth

  6                                                                                                        Note 1: CBRE    Note 2: Daft.ie
Key Operational Highlights
Urban - Accelerating Returns From Docklands Portfolio
 • During 2017 and 2018, the Group made two
                                            Premier Inn Key Attractions
    attractive acquisitions at a strategic, but
    one-off, Dublin Docklands location
                                                                                             Strong              • Completed transactions totalling
 • Significant value has been added in the                                                                         almost €150m at the Castleforbes
    interim via a series of successful planning                                              financial
                                                                                             outcome               Docklands site in 2021
    applications
 • In 2021, Glenveagh monetised the majority
    of the Castleforbes site through a forward                                                                   • Return of capital 12 months earlier
    fund for the Premier Inn Hotel and the sale                                                                    vs forward fund
    of the residential and second hotel sites                                                Accelerating
                                                                                             capital-turn        • Ability to redeploy in line with
 • This accelerated profits from the                                                                               capital allocation policy
    development and provided capital and
    resources to invest in other areas of the
    business, including our share buyback                 East Road                                              • Attractive risk / return profile vis-à-
    programme                                                                                                      vis 700 unit high rise city centre
                                                                                             Reduced risk          development
 • The remaining assets in the Docklands
    portfolio are the office development in                                                                      • Legislative risk mitigated
    Castleforbes, which is due for completion in
    H1 2024, and the 550-unit East Road
                                                                                             Ability to          • 2,400 Urban units with planning
    development, which the Group hopes to
    monetise in 2022
                                                                                             capitalise on       • Heads of Terms signed on 500
                                                                                             core Urban            units with further processes
                                                                                             deliveries            ongoing

                            Strong Operational Progress, Material Profit Contribution And Single Location Exposure Now Limited

   7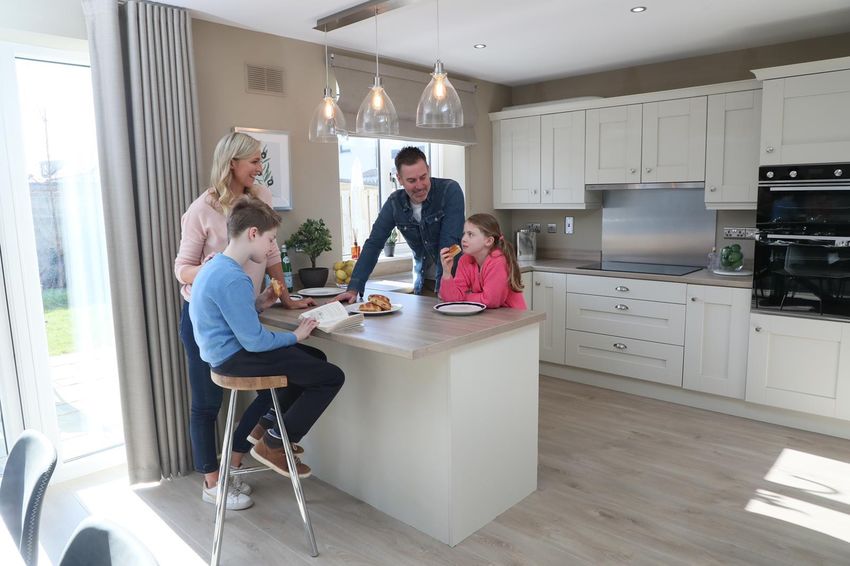
Key Operational Highlights
Partnerships – Now A Significant Business With 2,050-Unit Pipeline
 Ballymastone                        Overall Tenure Mix
                                                                            • Selected as partner to develop approximately 1,200 homes in
                                                                               Ballymastone

                                            20%                             • Mix of social, affordable, cost rental and private homes
                                                          40%
                                                                            • All private houses and duplexes to first time buyers and private individuals
                                           20%                              • Limited capital investment prior to construction and delivery of homes
                                                    20%                     • Planning application expected to be lodged in 2022 with construction
                                       Private       Social                    planned to commence immediately thereafter
                                       Affordable    Cost Rental

 Oscar Traynor Road                  Overall Tenure Mix
                                                                            • Selected as partner for Dublin City Council in developing 853 homes in
                                                                               Oscar Traynor Road, Dublin
                                                                            • Mix of social, affordable, and cost rental homes
                                                                            • Limited capital investment prior to construction and delivery of homes
                                       40%                40%
                                                                            • Planning application expected to be lodged in 2022 with construction
                                                                               planned to commence immediately after planning is granted

                                                  20%

                                  Social     Affordable       Cost Rental

                             Partnerships Has Added 2,050-Units To The Land Portfolio
  8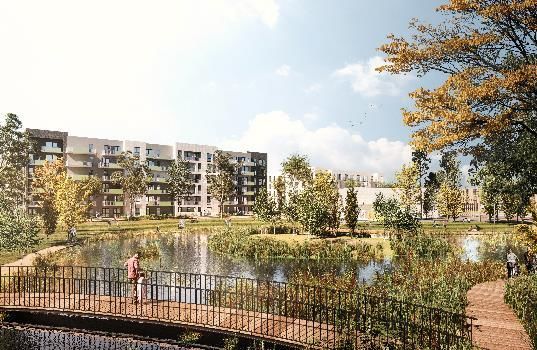
Key Operational Highlights
Sustainability - Continued To Be A Key Priority In 2021
                                                                    Board of Directors
 Our Ambition                                                       The Board has ultimate responsibility for sustainability. The main board receives updates on

 • ‘to set a new benchmark in our sector by delivering the          sutainability four times per year including progress against targets. It is supported by two board
                                                                    committees with specific responsibility.
   maximum possible social benefit at the lowest possible
   environmental cost’
                                                                    ESR Committee                                                    Audit & Risk Committee
                                                                    This committee is responsible for                                The Audit and Risk Committee reviews
 Governance                                                         developing and monitoring the Group’s                            sustainability risks and opportunities.

 • Strong governance in place including dedicated Environmental     approach to sustainability. The committee
                                                                    meets four times per year.
   and Social Responsibilities Board Committee and responsibility
   at Executive Committee                                           Executive Committee
                                                                    The Executive Committee has ultimate executive accountability for sustainability. The
                                                                    committee discusses sutainability issues, reviews performqance and progress against targets.
 Risk and Opportunities Management
 • Climate risks and opportunities integrated into wider Group
   risk management processes including review by the Audit and
                                                                    Sustainability Team
   Risk Committee                                                   The sustainability team, which is led by the Head of Sustainability, is responsible for the day-to-
                                                                    day management of sustainability providing a framework within which all parts of the business
                                                                    can work. The team reports to the Chief Strategy Officer, a member of the Executive Committee.
Strategy and Embedding
• Sustainability roadmap to 2030 and transition to Net Zero to      Department Leads
   be published in 2022 informed by stakeholder engagement          Lead executuion of specific sustainability commitments through
                                                                    operations, activities, projects, etc.

                     Sustainability Is Fundamental To How We Set Strategy, Structure and Organise Our Business

  9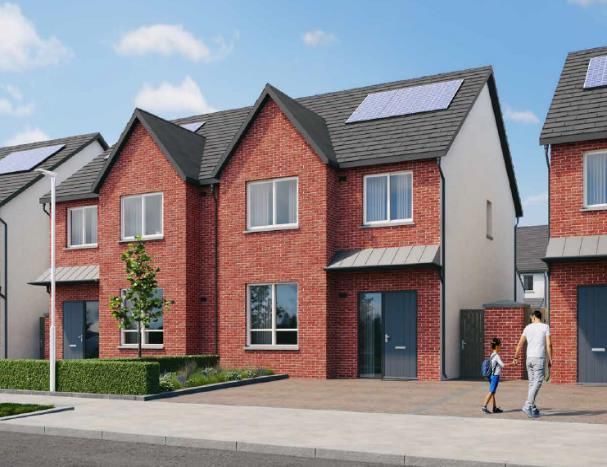
Key Operational Highlights
Sustainability - Considerable Progress Across Our Six Pillars
 Customers   • 69% core units in 2021 priced below the median price     Efficient      • Achieved ISO14001 Certification
               of new homes sold in GDA & Cork.                         Operations     • Scope 1 & 2 emissions reduction achieved
             • On track to achieve ISO 9001 in 2022                                    • Net Zero commitment with roadmap publication in
             • 89% Customer Satisfaction rating                                          H2 2022

 Homes       • 82% of homes with A2 rating – Up to 50% A1 in 2022       Sourcing       • Commenced supplier engagement regarding
 and         • Innovative own-door high density housing solutions                        sustainability
 Community     developed                                                               • Vendor Code of Conduct put in place
             • Building Lasting Communities’ programme launched

 People      • 72% employee engagement score – GPTW Award               Safety         • Achieved ISO45001 Certification
             • Achieved Investors in Diversity Silver Mark                             • Total Recordable Incident Rate (TRIR) reduced to 2.38
             • Senior Leadership Development Programme launched                        • Audit score 89%

                                     Considerable Progress Made Across Six Sustainability Pillars

  10
Key Operational Highlights
Sustainability - Reporting, Verification And Recognition For Direction Of Travel
Reporting
Standard
Alignment
Certifications
Awards and
Recognition
External Ratings
and Verification A- Low
Risk
As at: November 20211 As at: 21 September 20212
Sustainability Progress Recognised By Increased Ratings, Certifications And Awards
Note 1: See “ESG Ratings Disclaimer” note 1
11 Note 2: See “ESG Ratings Disclaimer” note 2Alignment With Market Opportunity
Alignment
With Market
Opportunity
Economy, Timing And End-Markets Favourable For Long-Term Success
GDP – Ireland Best Placed in 2021 Wage Inflation Driving Affordability Housing Stock Now At Historic Lows
15%
2,600m 6% 30k
2,500m
2,400m 4%
10% 20k
2,300m 2%
5% 2,200m 10k
2,100m 0%
0%
2018 2019 2020 2021 2022f 2023f 0k
DNK
TUR
JPN
RUS
USA
CHN
IRL
DEU
AUS
MEX
NLD
FRA
GBR
ESP
SWE
POL
BEL
IND
ITA
Total at work Wage inflation Q4 2018 Q4 2019 Q4 2020 Q4 2021
Source: IMF Source: CSO, Goodbody Source: Daft.ie
Domestic Demand Resilient In 2022 Mortgage Approvals Strengthening Government Policy & Spending Supportive
60k
12%
40k
8%
20k
4%
€4bn
0k
0% €1bn
DNK
TUR
MEX
RUS
JPN
USA
DEU
AUS
CHN
IRL
NLD
EA17
FRA
ESP
SWE
GBR
IND
BEL
ITA
POL
Source: OECD Avg. govt spend '16-'19 Avg. govt spend '22-'26
Source: BPFI
Macro Tailwinds Expected To Continue To Support Strong Demand In 2022 And Beyond
13Alignment With Market Opportunity
Legislation Will Support Future Housing Supply
Policy Description
• Legislation supportive of housing
• Housing For All strategy to 2030 to
deliver 300,000 homes and a total 1. • Enacted as part of the Affordable Housing Act 2021
Shared Equity
spend of €20bn in the first five years scheme • The State may take up to 30% equity in a property
• Commitment to accelerate both
private and public housing delivery 2. Help-to-Buy • Expansion of Help-to-Buy from €20,000 to €30,000
reflected in the wide range of new Expansion • Scheme extended in Budget 2022
measures
• LRD planning system has replaced 3.
Cost Rental
• New rental tenure in the Affordable Housing Act 2021
the SHD creating greater certainty in • State funding to allow for subsidised rents and first units were delivered in 2021
the planning process
4. Affordable • 36,000 affordable units will be delivered by 2030 as part of the Housing for All programme
Purchase • Eligible people are means tested, and / or may be current local authority tenants
Institutional And State
Participation In Context 5. Social Housing • 5 year increase in social housing stock of > 50,000
Delivery • Housing For All includes social housing as one of the key priorities
€4.0bn 6. • Large-scale Residential Developments system (LRD) has replaced the Strategic Housing
Planning Reforms
€2.3bn Development (SHD) system
PRS 2021 Average annual 7.
LDA Act 2021
• Sets out wide-ranging functions of the Land Development Agency (LDA)
government spend • Expected to ensure faster delivery of housing on public and private lands
'22 - '26
Positive Effect Of Policy Measures Yet To Materially Impact Housing Delivery
14Alignment With Market Opportunity
Current Land Portfolio
Land portfolio - Business segments Land portfolio – Potential Customer 2021 Highlights
• 12 sites for total
Part V 1,100 consideration of €72m
Suburban with capacity for
Government Initiatives approximately 2,700
Urban - Forward Funds 2022E 2,000 2,800 homes
Private • Two landmark
Other Urban 2,800 1,200 5,200 Partnership deals for
Forward Funds 2022E over 2,050 units, with
Partnerships 10,800 minimal upfront capital
Other Institutional 6,500 outlay
1,200 • Increase of approx. 2,700
units in the year while
reducing our land value
by €57m to €563m
• Attractive plot cost as a
% of NDV and greater
alignment with our
capital management
strategy
15 *Land portfolio as of 31 December 2021Alignment With Market Opportunity
Affordable Suburban Portfolio – Shared Equity Scheme
• The shared equity scheme will see the State take up to a 30% stake in the homes of first-time buyers, who will take out a mortgage with a bank for the remainder of the
cost. The Help-to-Buy scheme can be used in conjunction with the shared equity scheme, but the limit remains 30% of the value of the home
• The scheme was part of the Affordable Housing Act and has been introduced with seven regional price caps for suburban housing ranging from €450,000 to €225,000,
depending on location
• Glenveagh has an established suburban land portfolio aimed at the more affordable end of the market with 76% of the units in key areas (Regions 1-3) within these
shared equity scheme price caps
• In addition to the suburban price caps, there are two additional price caps of €500,000 and €450,000 for apartments in Dublin and Cork City, in acknowledgement of the
increased cost of delivering apartments
• Glenveagh expects its first house sale under the shared equity scheme to take place in H2 2022
Units In Our Portfolio That Will Qualify For The Shared Equity Scheme
74% of overall portfolio qualifies for SES Region Areas
76% in Regions 1-3
€450,000
€400,000 Regions 1-3 GDA, Cork, Galway & Limerick
€350,000
€300,000
€275,000
€250,000
€225,000
Regions 4-7 Regional areas (e.g. Offaly, Kilkenny, etc.)
Region 1 Region 2 Region 3 Region 4 Region 5 Region 6 Region 7
16Alignment With Market Opportunity
Affordable Suburban Portfolio – Cost Rental Scheme
Cost Rental Taylor Hill Scheme structure
• Cost Rental is a proven approach ✓ Rents at least 25% below open market rates
across Europe
✓ Eligibility capped at gross household income of €82,273
• Housing for All plan provides for per annum
18,000 Cost Rental homes by 2030
✓ Single people as well as dual-income households
• Aa significant portion of our land earning up to this level eligible to apply
portfolio already suitable for
Government supported housing ✓ Units to be purchased from the private market or built
• Reflecting this Glenveagh delivered the directly by Approved Housing Bodies (“AHBs”)
State’s first Cost Rental units in 2021 Barnhall Meadows
✓ AHBs will receive funding from the State for up to 30%
• Cost Rental complements existing exit of the cost of the new homes
options and adds greater long-term
resilience to our development ✓ AHB’s also receive significant institutional funding
portfolio which will fund the remaining 70% of the cost of the
homes
17Enhancing Delivery Capability
Enhancing Delivery
Capability
Our Approach To The Short and Long-Term Industry Challenges
Near-term Global Inflation Internal Mitigation Measures
Supply Chain Integration
Covid-19 pandemic
• Improve construction times, increase cost control, allows for
integration with sustainability and access to more labour
Global supply chain constraints
• 700+ timber frame units in 2021, expected capacity of over 2,000
units in 2024
Geo-political uncertainty • Soil recovery facility an additional benefit during periods of
capacity constraint and complimented by soil stabilisation onsite
Tighter labour availability
Centralisation And Standardisation
Structural Industry Challenges • Continued roll-out of standardised house types and development
• Increasingly standardised process from compound set-up through
Attracting talent to labour intensive roles to health and safety, and sustainability
• Centralised procurement including the de-coupling of supply and
Retrofitting of second-hand stock to further increase fit-out packages
competition for labour
CPI 6% In H2 2021 With Continued Inflationary Pressure In 2022
19Enhancing Delivery Capability
Manufacturing Central In Addressing Long-term Delivery Capabilities
Manufacturing Strategy Pillars Controlling, Integrating And Innovating In The Supply Chain Phased
Implementation
1.
Design Production Distribution
Controlling critical path Incrementally
items to facilitate target • Starts in-house with • Focus on innovative • Implement factory expand timber-
delivery standardisation and technologies and processes which are frame production
streamlining of our methods of ‒ Automated
designs construction
including ‒ Lean
Integration with site • 3D modelling for 2.
seamless integration ‒ Timber-frame ‒ Quality controlled Lock-in
processes to increase production
speed and capture into manufacturing ‒ Pre-cast concrete • Facilitates process
software improvements on-
capability to
efficiencies ‒ Other modular reduce risk
• Achieving simplified site and in the
construction factory
execution despite of methodologies
the delivery 3.
Innovation through methodology
continuous exploration Explore additional
of innovative off-site
methodologies methodologies
We Aim To Pursue New Processes In Home Design And Factory Set-up To Assist In De-risking Output And Delivering Efficiencies
20Enhancing Delivery Capability
Manufacturing Footprint – Where We’re Focusing Our Efforts And Why
Timber-frame Light Gauge Steel (“LGS”) Precast Frame
Universal Benefits
✓Critical path items Unit Typology: Unit Typology: Unit Typology:
controlled • Low Rise Housing • Low to Medium Rise multi-unit homes • Medium to High Rise multi-unit
• Best suited for 1 to 3 storey units apartments
✓Factory standard products • Best suited for 2 to 5 storey units
• Best suited for 4 to 10 storey units
✓Controlled manufacturing Site Efficiency Site Efficiency Site Efficiency
and production processes • Construction program improvement of • Construction program improvement of 6 • Construction program improvement of
✓Added resilience to 4-6 weeks for each house weeks for each multi unit 1-2 weeks per floor
delivery schedules • Facilitates a more efficient site for other • Facilitates a more efficient site for other • Prestressed panels allow for
trades trades optimisation and design efficiencies
✓Mixed methodologies • Scalable process suitable for • Units under 18m high with FSC • Facilitates a more efficient site for
reduce risk and improve standardisation requirements and concrete floors following trades
delivery ability
Benefits: Benefits: Benefits:
✓Factory standard product • Increased control of construction • Increased control of construction • 3D Technical Design with seamless
and quality assurance process process integration into production software
program • Increasingly cost competitive following • Reduces labour on site • Increased control of construction
changes to regulations process
• Stepping stone to volumetric off-site
• Reduces labour on site construction • Reduces labour on site
Growing Offsite Capability To > 2,000 Units By 2024
21Enhancing Delivery Capability
Existing Manufacturing Footprint – Suburban North and Suburban South
Suburban North Suburban South
✓ Two strategically
located facilities
acquired at an
• Guaranteed long-term supply in line with growth • Strategically located in the southern region
targets
attractive cost • 15,000 students in the nearby Carlow and
✓ Serving Suburban • 700+ units produced in 2021 which will grow further Waterford Institutes of Technology
North and South in 2022
regions • 120,000 workforce within 50km
• Ability to mitigate against price increases
✓ Focus on offsite • Fully operational in 2023 reducing delivery time and
panellised • Partnering with a highly-capable management team cost to sites in the southern region
manufacture with significant manufacturing experience and a
demonstrable track record • Capacity to explore additional off-site
✓ Delivered through a methodologies
combination of
exclusive supply
agreements and
own manufacturing
✓ Supply chain of over
2,000 units secured
at scale
Growing Offsite Capability To > 2,000 Units By 2024
22Enhancing Delivery Capability
Further Regulatory Driven Thermal Efficiency Cost Increases Likely To Be Limited
Existing Wall - Current Regulations Historic Wall – Less Advanced Regulations
✓ Ireland’s energy regulations are
one of the highest in Europe
and with these higher
regulations comes higher costs
✓ Unlike comparable sectors in
other jurisdictions the
construction sector in Ireland
has already taken the impact of
these additional costs
✓ Irelands energy regulations are
already delivering homes to A2
BER standard
✓ Glenveagh will only build A1 ✓ Greater complexity in design ✓ Basic structure
and A2 rated houses in 2022 ✓ Highly insulated ✓ Less complex
✓ Manufacturing automation and ✓ Air tightness membrane ✓ Narrower frame
processes already set-up to
✓ Service zones ✓ Less energy efficiency
deal with more sophisticated
panelised production ✓ Energy efficiency – contributes to achievement of
minimum A2 BER rating
23Enhancing Delivery Capability
Energy Efficient Homes Leading Our Pathway To Net Zero
Greenhouse Gas Emissions – Scope 1, 2 and 3 – Demonstrates Progress
Commentary
• Our high energy standards go beyond regulatory compliance Occupant energy (60 yrs) - Unregulated
1.5% 0.1%
• Our Building Energy Ratings (BER) ratings are sector leading - in Occupant energy (60 yrs) - Regulated 7% 13%
2022 up to 50% of our homes will have an A1 rating – the highest
Purchased goods and services 12%
rating Exceptional
thermal
• A growing proportion of our houses are timber frame and Construction materials 34% performance of
homes has
manufactured off-site which serve to further reduce the emissions Other reduced
of our construction materials regulated
Scope 1 - Fuels 32% energy usage
• In 2022 we will publish our pathway towards Net Zero aligned with
Scope 2 - Electricity (market)
stakeholder expectations and national and EU Commitments
Proportion of Offsite Manufactured Houses Our Energy Performance Evolution – BER Ratings
Share of housing
15%
units sold
24% 23%
Share of all
units sold
28% 18%
62% 50%
76% 85% 77% 82%
72%
38% 50%
2019 2020 2021 2019 2020 2021 2022E
Off-site manufactured Masonry A1 A2 A3
24Financial Financial Review Review
Financial Review
Financial Summary

 Income                      Balance                            Cashflow                         2022
 Statement                   Sheet                              Statement                        Guidance

 €476.8m                     €562.7m                            €104.3m                          Approx. €630m
 (FY 2020: €232.3m)          (FY 2020: €619.3m)                 (FY 2020: (€11.5m))              (FY 2021: €476.8m)
 Revenue                     Development land                   Operational cashflow             Revenue

 19.6%                       €204.5m                            €261.1m                          €73m - €78m
 (FY 2020: 14.1%)            (FY 2020: €201.9m)                 (FY 2020: €162.5)                (FY 2021: €50.6m)
 Core Gross Margin           WIP Investment                     Available funds                  Operating profit

 €45.7m                      €784.1m                            €20.8m                           7.5 – 8.5 cent
 (FY 2020: Loss of €15.7m)   (FY 2020: €853.5m)                 (FY 2020: €36.7m)                (FY 2021: 4.5 cent)
 Profit before tax           Net Assets                         Net Cash                         Earnings Per Share

                              Significant Increase In Profitability And Strong Cash Generation

  26
Financial Review
Income Statement
2021 2020
€’m €’m • Total revenue for the year was €476.8m (2020: €232.3m), of which €374.7m
Revenue 476.8 232.3 (2020: €230.9m) relates to the completion of 1,150 units (2020: 700 units)
Cost of sales (397.9) (202.5)
• €301.0m revenue from 977 core units (ASP: €308k)
Impairment reversal / (charge) 4.2 (20.3)
• €73.7m revenue from 173 non-core units in Marina Village
Gross profit 83.1 9.5
Central costs (30.1) (20.2) • €102.1m revenue mainly from our Castleforbes asset
EBITDA 53.0 (10.7)
• The Group’s gross profit for the year amounted to €83.1 million (2020:
Depreciation and Amortisation (2.4) (2.0) €9.5 million) with a corresponding margin of 17.4% (2020: 4.1%)
Operating profit/(loss) 50.6 (12.7)
• The Group’s core gross margin for the year was 19.6% (2020: 14.1%)
Finance expense (4.9) (3.0)
Profit/(Loss) before tax 45.7 (15.7) • Gross margin for suburban sites was 17.5%, which is expected to
increase to in excess of 18%, with continued margin
Income tax (charge)/credit (8.0) 1.8
progression in 2023
Profit/(Loss) after tax 37.7 (13.9)
• The Group’s operating profit for the year was €50.6 million (2020: Loss of
Basic EPS (cent) 4.5 (1.6) €12.7 million) resulting in an operating margin of 10.6%
• The Group generated an Earnings Per Share of 4.5 cent (2020: Loss per
share of 1.6 cent). This strong EPS performance is reflective of the
increased profitability for the year as well as the impact from the Group’s
share buyback programmes
27Financial Review
Balance Sheet
2021 2020
€’m €’m • Increase in property, plant & equipment is reflective of our continued
investment in our supply chain and particularly our manufacturing
Property, plant and equipment 27.3 21.1 capabilities
Other assets 26.6 2.8 • Inventory is split as follows:
Non-current Assets 53.9 23.9 • Land and development rights - €563m (2020: €619m)
• Development expenditure (WIP) - €204m (2019: €202m)
Inventory 767.2 821.2
Trade and other receivables 32.3 14.6
• The net reduction in land of €57m is a key component of the Group’s
strategy to improve capital efficiency. The Group expects to further
Cash and cash equivalents 116.7 137.3 reduce its net investment in land in 2022, with an expected land value
of €500m by 31 December 2022
Current Assets 916.2 973.1
• The Group’s total work-in-progress at FY 2021 was €204m, with non-
Total Assets 970.1 997.0 core developments contributing €15 million (FY 2020: €58m). This a
significant reduction from the prior year and demonstrates the
effectiveness of the Group’s strategy to accelerate the exit from these
Total equity 784.1 853.5 completed non-core sites
Non-current liabilities 80.7 0.3 • The Group’s core work-in-progress is €189 million (FY 2020: €144
million) and was spread across 24 active construction and/or selling
Trade and other payables 57.5 42.2 sites giving an average core WIP of less than €8m per active site
Income tax payable 7.7 - • The Group had gross borrowings of €121m (FY 2020: €100m) and cash
Loans and borrowings 40.1 100.9 balances of €142m at 31 December 2021 giving a net cash position of
€21m (FY 2020: €37m)
Current liabilities 105.3 143.2
• The Group had undrawn debt facilities of €120m at 31 December
Total liabilities and equity 970.1 997.0 2021
28Financial Review
Improving Capital Efficiency of Land Investment
€53k €46k €45k €44k €39k €34k €32k • The Group is on track to reduce land
€800m 20k portfolio by over €200m by the end
of the year1
• Partnership wins will allow the
€600m 15k Group to reduce the absolute
amount invested in land while
increasing total plots controlled
€400m 10k • Average plot cost of €34k at 31
December 2021 and expected to
continue its downward trajectory
€200m 5k • Land cost as a % of NDV has been
below 10% in some recent land
acquisitions
€0m 0k • Targeting a maximum of 4 – 5 year
June 19 Dec 19 June 20 Dec 20 June 21 Dec 21 Dec-22 landbank at scale
Landbank Units
Reduction of Net Investment in Land Generating Significant Cash Flow
1 Since 30 June 2019
29Financial Review
Significant Cash Generation & Capital Allocation
• Significant cash generated by the business
€20m (€281m) in 2021 with gross cash inflows of €514m
€100m
€16m
• Considerable achievement generating
€182m from the accelerated monetisation
€82m of the Castleforbes & Marina Village assets
€77m
• Invested cash in line with our priorities of
€332m
land (€94m), working capital (€281m) and
(€232m) capex, mainly supply chain integration
(€94m) (€17m)
• As per our stated Capital Allocation policy
(€34m) our excess cash was returned to
(€4 (€108m) shareholders, with €108m returned in
9m 2021
)
€270m • The business is forecasted to generate
(€17m) (€16m)
€37m (€67m) operating cash flows of at least €75m in
€21m
2022, which will give great optionality for
further capital allocation initiatives
(€31m)
Net cash 31 Core house Non-core Castleforbes Net term loan Working Land Tax (CT, VAT, Share Capex Other Net cash 31
December sales Marina land & drawdown capital acquisitions etc.) buyback (€16m)
December
(€34m)
(€49m)
2020 Village sales development and deposits 2021
Accelerated Urban & Non-Core Asset Monetisation Funding Significant Investment In Growth & Capital Returns
30Financial Review
2022 Guidance
Our Key Priorities 2021 actual 2022 guidance Variance
Revenue – suburban €277m Approx. €440m +59%
Increased revenue growth Revenue - urban €126m Approx. €190m +51%
Gross Margin - suburban 17.5% In excess of 18% +50 bps
Improved operating Gross Margin - urban 24.9% 15% (after forward fund coupon) -990 bps
margin
Operating profit €50.6m €73m to €78m +44% to +54%
EPS 4.5 cent 7.5 cent to 8.5 cent +67% to +89%
Forward funding of Urban
projects
2021 actual 2022 guidance Variance
Land €563m Approx. €500m -11%
Reduction in net land
investment WIP €204m Approx. €275m +35%
Net debt of up to 15% of net
Leverage Net cash - €21m
assets
Operating cash inflow €104m €75m - €100m -28% to -4%
Enhanced Return On +240 bps to
Equity Return on Equity 4.6% 7% to 8%
+340 bps
Our Key Priorities Focussed on Enhancing Return on Equity
31Appendices Outlook
Outlook

                                                   Increasing delivery capabilities
Continued revenue & profit growth                  through manufacturing                                        Improved
• 1,400-unit suburban target at improved                                                                      Profitability &
   margins
                                                   • Controlling more of the supply chain and                   Cash Flow
                                                       off-site manufacturing
• Revenue & profits from at least three            • Opportunities and capacity to explore
   forward funds in 2022
                                                       other off-site methodologies
                                                                                                             Greater Balance
                                                                                                             Sheet efficiency
Efficient use of capital
• Land will be approximately €500m by 31 December 2022
• Monetisation of urban assets through forward funds
                                                                                                            Improved Return on
• Land acquisitions with planning to ensure faster asset turn                                                     Equity
• Target of 4-5 year land portfolio at scale

                                Strong Execution Against Strategic Priorities With A Clear Focus For 2022

  33
General Disclaimer
This presentation has been prepared by actual performance of the Company may differ
Glenveagh Properties PLC (the “Company” or materially from those reflected or contemplated
“Glenveagh”) for information purposes only. in such forward-looking statements. No
representation or warranty is made as to the
This presentation has been prepared in good achievement or reasonableness of, and no
faith but the information contained in it has not reliance should be placed on, such forward-
been subject to a verification exercise and does looking statements.
not purport to be comprehensive.
Certain industry, market and competitive
No representation or warranty, express or position data contained in this presentation
implied, is given by or on behalf of the come from third party sources. Third party
Company, its group companies, or any of their industry publications, studies and surveys
respective shareholders, directors, officers, generally state that the data contained therein
employees, advisers, representatives or agents have been obtained from sources believed to be
as to the accuracy, completeness, fairness or reliable, but that there is no guarantee of the
sufficiency of the information, projections, accuracy or completeness of such data and the
forecasts or opinions contained in this Company has not verified the data contained
presentation. Save in the case of fraud, no therein. Certain financial and statistical
liability is accepted for any errors, omissions or information contained in this presentation is
inaccuracies in any of the information or subject to rounding adjustments. Accordingly,
opinions in this presentation. any discrepancies between the totals and the
sums of the amounts listed are due to rounding.
This presentation contains forward-looking
statements which can be identified by the use of THIS PRESENTATION DOES NOT CONSTITUTE OR
terms such as "may", "will", "should", "expect", FORM PART OF ANY OFFER FOR SALE OR
"anticipate", "project", "estimate", "intend", SOLICITATION OF ANY OFFER TO BUY ANY
"continue", "target" or "believe" (or the SECURITIES NOR SHALL IT OR ANY PART OF IT
negatives thereof) or other variations thereon or FORM THE BASIS OF OR BE RELIED ON IN
comparable terminology. Due to various risks CONNECTION WITH ANY CONTRACT OR
and uncertainties, actual events or results or COMMITMENT TO PURCHASE SHARES.
ESG Ratings Disclaimer
1. The use by Glenveagh Properties PLC of any MSCI ESG Research LLC or its affiliates (“MSCI”) data,
and the use of MSCI logos, trademarks, service marks or index names herein, do not constitute a
sponsorship, endorsement, recommendation, or promotion of entity Glenveagh Properties PLC by
MSCI. MSCI services and data are the property of MSCI or its information providers and are provided
‘as-is’ and without warranty. MSCI names and logos are trademarks or service marks of MSCI
2. Copyright ©2022 Sustainalytics. All rights reserved. This report contains information developed by
Sustainalytics (www.sustainalytics.com). Such information and data are proprietary of Sustainalytics
and/or its third party suppliers (Third Party Data) and are provided for informational purposes only.
They do not constitute an endorsement of any product or project, nor an investment advice and are
not warranted to be complete, timely, accurate or suitable for a particular purpose. Their use is subject
to conditions available at https://www.sustainalytics.com/legal-disclaimers.
34You can also read