Magnitude, form and bioavailability of fluvial carbon exports from Irish organic soils under pasture
←
→
Page content transcription
If your browser does not render page correctly, please read the page content below
Magnitude, form and bioavailability of fluvial carbon exports from Irish
organic soils under pasture
Barry, C. D., Renou-Wilson, F., Wilson, D., Müller, C., & Foy, R. H. (2016). Magnitude, form and bioavailability of
fluvial carbon exports from Irish organic soils under pasture. Aquatic Sciences, 78(3), 541-560.
https://doi.org/10.1007/s00027-015-0464-x

Published in:
Aquatic Sciences

Document Version:
Publisher's PDF, also known as Version of record

Queen's University Belfast - Research Portal:
Link to publication record in Queen's University Belfast Research Portal

Publisher rights
Copyright The Author(s) 2016. This article is distributed under the terms of the Creative Commons Attribution 4.0 International License
(http://creative
commons.org/licenses/by/4.0/), which permits unrestricted use,
distribution, and reproduction in any medium, provided you give
appropriate credit to the original author(s) and the source, provide a link
to the Creative Commons license, and indicate if changes were made.
General rights
Copyright for the publications made accessible via the Queen's University Belfast Research Portal is retained by the author(s) and / or other
copyright owners and it is a condition of accessing these publications that users recognise and abide by the legal requirements associated
with these rights.

Take down policy
The Research Portal is Queen's institutional repository that provides access to Queen's research output. Every effort has been made to
ensure that content in the Research Portal does not infringe any person's rights, or applicable UK laws. If you discover content in the
Research Portal that you believe breaches copyright or violates any law, please contact openaccess@qub.ac.uk.

Download date:11. Jun. 2022
Aquat Sci
DOI 10.1007/s00027-015-0464-x                                                           Aquatic Sciences
    RESEARCH ARTICLE

Magnitude, form and bioavailability of fluvial carbon exports
from Irish organic soils under pasture
C. D. Barry1,2 • F. Renou-Wilson3 • D. Wilson4 • C. Müller5 • R. H. Foy2

Received: 9 January 2015 / Accepted: 29 December 2015
Ó The Author(s) 2016. This article is published with open access at Springerlink.com

Abstract Organic soils are widespread in Ireland and                   buffering. Labile DOC determined using dark incubations
vulnerable to degradation via drainage for agriculture. The            indicated small fractions (5–10 %) available for remineral-
soil-landuse combination of pasture on organic soils may               isation over typical downstream transit times of days to
play a disproportionate role in regional C dynamics but is yet         weeks. These fractions are probably conservative as pho-
to receive study. Fluvial C fluxes and labile organic fractions        tolysis in the environment can increase the proportion of
were determined for two such sites at nested field (c.4 ha)            labile compounds via photocleavage and directly reminer-
and subcatchment scales ([40 ha); one relatively dry and               alise organic matter. This study demonstrates that monitor-
nutrient rich, the other wetter and nutrient poor. Field scale         ing at soil–water interfaces can aid capture of total landscape
flux from the nutrient poor site over 2 years was                      fluvial fluxes by precluding the need to incorporate prior C
38.9 ± 6.6 g C m-2 yr-1 with DIC [ DOC [ POC at 57, 32                 evasion, although rapid runoff responses at field scales can
and 11 % respectively, and 72 % DIC was comprised of                   necessitate high resolution flow proportional, and hydro-
above equilibrium CO2. At the nutrient rich site, which                graph sampling to constrain uncertainty of flux estimates.
overlies limestone geology, field scale export over an indi-
vidual year was 90.4 g C m-2 with DIC [ DOC [ POC at                   Keywords DOC  DIC  CO2  Fluvial flux  Carbon
49, 42 and 9 %, but with 90 % DIC as bicarbonate. By                   Agriculture  Bioavailability  Reactivity continuum
comparison with the nutrient poor site, the magnitude and
composition of inorganic C exports from the nutrient rich site
implied considerable export of soil-respiratory C as bicar-            Introduction
bonate, and lower evasion losses due to carbonate system
                                                                       Fluvial exports of terrestrial carbon (C) have long been
This article is part of the special issue ‘CarbonCycling in Aquatic    recognised as important modulators of aquatic ecosystem
Ecosystems’.                                                           structure and function (Birge and Juday 1927; Prairie
                                                                       2008). Consideration of their importance as components of
& C. D. Barry                                                          terrestrial and global C budgets is more recent however
  chris.barry@afbini.gov.uk
                                                                       (Billett et al. 2004; Cole et al. 2007), and partly reflects that
1
     Agri-Food and Biosciences Institute, Newforge Lane,               climate change has prompted the need for more accurate
     Belfast BT9 5PX, Northern Ireland, UK                             greenhouse gas (GHG) inventories and raised interest in the
2
     School of Biological Sciences, Queen’s University Belfast,        C sequestration capacity of soils to offset anthropogenic
     Belfast BT9 7BL, Northern Ireland, UK                             emissions (Smith et al. 1997; IPCC 2006). The importance
3
     School of Biology and Environmental Science, University           of, and requirement to include landscape-aquatic C trans-
     College Dublin, Belfield, Dublin 4, Ireland                       fers in studies of the global C system is underlined by
4
     Earthy Matters Environmental Consultants, Glenvar,                comparable estimates for the global fluvial flux of terres-
     Letterkenny, Co., Donegal, Ireland                                trial C and the terrestrial sink for anthropogenic C emis-
5
     Institute for Plant Ecology, Justus Liebig University Giessen,    sions (Cole et al. 2007; Canadell et al. 2007; Battin et al.
     Giessen, Germany                                                  2009).

                                                                                                                             123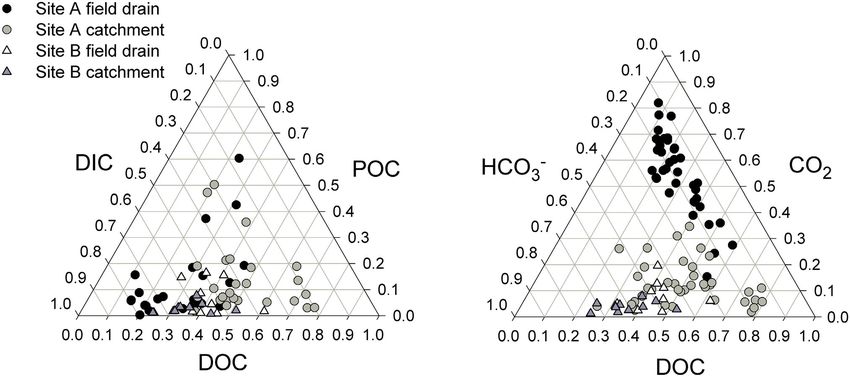
C. D. Barry et al.

   Terrestrial organic C budgets are constructed as the         globally these are of sufficient magnitude to influence the
balance of inputs and outputs. The largest respective terms     partitioning of C between the hydrosphere, geosphere and
are generally gross primary production (GPP) and direct         atmosphere (Stallard 1998; Aufdenkampe et al. 2011).
aerobic respiration (R) losses to the atmosphere, but these     Given that approaches to global C accounting tend to dis-
are insufficient alone to accurately determine the C status     tinguish ocean and continental processes and their associ-
of sites. Dissolved organic C (DOC) in precipitation is an      ated atmospheric mass fluxes, assessing the fate of fluvial C
additional input, while net removal of matter by grazing        exports before delivery to the oceans is valuable. For
organisms and/or as agricultural product, anaerobic respi-      example CO2 concentrations in most freshwaters exceed
ration losses, and fluvial C exports are further loss terms.    atmospheric such that water–air transport occurs, and such
Fluvial C fluxes make the most appreciable contribution to      gradients are generated largely by organic matter rem-
terrestrial C balances in landscapes where organic soils        ineralisation occurring pre and post export from soils and
predominate and where runoff is high. Undisturbed tem-          groundwater environments (Cole et al. 1994; Dawson et al.
perate and boreal peatlands are generally net atmospheric C     2004; Fasching et al. 2014). Consequently knowledge of
sinks for 20–50 g C m-2 yr-1, with fluvial fluxes equating      the quantities and rates of remineralisation of fluvial
to 34–46 % of the sum of all other balance terms (Roulet        organic exports, largely determined by their biochemical
et al. 2007; Nilsson et al. 2008; Dinsmore et al. 2010). Thus   reactivity and propensity for photolysis, can inform the
failure to incorporate fluvial losses can lead to appreciable   potential return of C to the atmosphere. Indeed distin-
overestimation of the terrestrial sink.                         guishing allochthonous (soil) and autochthonous (aquatic)
   C is exported fluvially in several forms, distinguishable    CO2 in freshwaters is crucial for understanding of the role
by size, elemental composition and molecular structure;         of aquatic metabolism in the global C cycle (Maberly et al.
foremost divisions are to organic and inorganic pools           2013). Furthermore, as CO2 evasion is rapid in low order
which are further apportioned to dissolved and particulate      water courses due to high concentrations and often turbu-
fractions. As carbonic acid is formed by dissolution of         lent flows, tendencies for fluvial monitoring at spatial
carbon dioxide (CO2), which reacts with the bases of car-       scales beyond soil-stream interfaces can underestimate
bonate and silicate geology to yield alkalinity and establish   landscape fluxes (Bishop et al. 2008; Wallin et al. 2013).
the carbonate equilibria, fluvial exports of dissolved inor-    Notably, improved knowledge of the areal extent of
ganic C (DIC) can comprise C derived from the atmo-             waterbodies and their gas transfer have approximately
sphere, respiration of soil organic matter, and rock            doubled estimates of the global evasion flux from fresh-
weathering (Stumm and Morgan 1996; Telmer and Veizer            waters (Cole et al. 2007; Aufdenkampe et al. 2011; Ray-
1999). Crucially, dissolution of carbonates and silicates       mond et al. 2013). Ireland possesses several characteristics
yields bicarbonate in which respectively, half and all of the   conducive to high fluvial C loss rates and aquatic C pro-
C present originates from carbon dioxide, which can have        cessing. Soil organic carbon densities are high, carbonif-
both atmospheric and organic matter respiratory origin          erous limestone geology is widespread, freshwater
(Stallard 1998; Telmer and Veizer 1999). As acidity             nutrients are elevated by agriculture, winters are mild, and
donated from soil respiratory CO2 is often the dominant         freshwater density and connectivity are high, yet there are
mechanism for dissolution, large portions of DIC can be         few studies of fluvial C exports or processing (EPA 2008;
derived from organic matter degradation, and failure to         Koehler et al. 2010; Whitfield et al. 2011). Peat soils cover
consider such fractions can bias terrestrial C balances (Cole   17 % of the land area in Ireland and represent 53 % of the
et al. 2007; Rantakari and Kortelainen 2008; Kindler et al.     national soil C inventory (Tomlinson 2005). Pastures cover
2011). Fluvial exports of organic C are ultimately derived      53 % and although only 6 % are situated on peats, they
from photosynthetic fixation of atmospheric CO2, but due        account for 52 % of the national organic C inventory to
to variable donor vegetation, storage and diagenesis in soils   50 cm (Xu et al. 2011). The combination of grasslands
prior to hydrologic export they consist of a multitude of       over peat in concert with artificial drainage may therefore
compounds with varying age, elemental composition and           play a disproportionate role in regional C dynamics but has
biochemical reactivity (Marı́n-Spiotta et al. 2014).            yet to receive study. To address this gap and provide fluvial
   A consequence of the diverse forms and biochemical           components for an allied terrestrial C balance study (Re-
characteristics of fluvial C exports is that numerous inter-    nou-Wilson et al. 2014) we determined organic and inor-
related biological and physico-chemical processes modify        ganic fluvial C fluxes at small spatial scales for two such
their fate during downstream transport (Prairie 2008;           sites. In addition we examine the potential for reminerali-
Tranvik et al. 2009). Overall such processes contribute to      sation of dissolved organic matter (DOM) exports and the
losses of fluvial C downstream via burial in aquatic sedi-      associated timescales using high resolution biological
ments and by gaseous evasion to the atmosphere, and             oxygen demand measurements over 90 days.

123
Fluvial carbon exports from Irish organic soils under pasture

Methods                                                         transducer was installed where the sides and base of the
                                                                ditch were constrained to rectangular flume. It was not
Study sites                                                     possible to robustly calibrate flows against level for this
                                                                instrumentation so that level was employed as a surrogate
Site A is in County Donegal (55°90 N, 7°340 W) at 40 m          for flow in export computations. Annual runoff was esti-
elevation while Site B in County Longford (55°90 N, 7°340       mated by the same approach as for Site A, employing
W) is at 38 m elevation. Both sites experience mild winters     precipitation data from Mt. Dillon (Met Éireann). This
but cool summers with similar mean annual, minimum and          watercourse discharged to a stream with a catchment area
maximum temperatures; long term averages (LTA) are 9,           of 870 ha (NASA 60 m DEM) but land use cover also
-2, and 18 °C respectively (Mills 2000). Annual precipi-        encompassed areas of exploited peat.
tation totals are also similar as at Malin Head, located           To derive export rates at Site A the estimated mass
26 km north-east of Site A, precipitation is 1076 mm while      fluxes (described below) are normalised against the esti-
at Mount Dillon, 2 km north-east of Site B, it is 1047 mm       mated drain catchment area. The export rates are thereby
(1981–2010; Met Éireann 2013). As a percentage of rain-        sensitive to the precision of the estimated drain catchment
fall, potential evapo-transpiration (PET) at Site A is lower    area, and so the precision of the estimated runoff values
(32–36 vs. 44 %) than at Site B (Mills 2000). The LTA           used to compute these areas. At site B the export rates are
runoff, calculated as precipitation less PET, is                also sensitive to the precision of the runoff estimate as the
710 mm yr-1 at Site A and 586 mm yr-1 at Site B. The            direct product of the runoff rate with flow-weighted mean
mean slopes at Sites A and B are 0.1 and 0.01 m m-1             C concentrations (see flux estimation below) gives the
respectively and each has been drained for[60 years. Soils      export rate. To examine the precision of the seasonality of
are classed as terric and limnic histosols respectively and     flows and the computed runoff and so export rates for
satisfy definitions of peat based on organic matter soil        these sites they are compared against flow timeseries and
depth (FAO 1998). Site A overlies Precambrian schist and        annual runoff values determined for gauged rivers in each
gneiss and soils are 17–23 % C, with C:N of 16–21. At Site      of the study site locations (EPA 2014). For Site A these
B base geology is carboniferous limestone and the soils,        are the Crana and Lackagh Rivers, respectively gauged
which are 38 % C with C:N of 17, overlie a layer of marl.       16 km east and 22 km west of the site with catchment
Soils are classified as nutrient poor and rich at Sites A and   areas of 37 and 125 km2. These catchments have high
B respectively and are managed as pasture for beef pro-         proportions of uplands compared to Site A, and while
duction with livestocking rates of 0.6 and 1.2 units ha-1       comparisons of seasonality are not precluded on this basis
respectively.                                                   they cannot be used to verify the computed runoff value at
                                                                this site (LTA precipitation for River Crana is 1668 mm
Fluvial C exports                                               and Lackagh is 1648 mm). For Site B, the Inny and Cross
                                                                Rivers are employed, gauged 15 km south east and 26 km
Runoff measurement                                              south of the site with catchment areas of 1108 and
                                                                103 km2 respectively. In contrast to Site A, the flat
A field drain was instrumented with a 60° v-notch angle         topography and relatively consistent soil and geology in
weir at Site A. Water level, using a pressure transducer,       the region surrounding Site B suggests that runoff for
and temperature behind the weir were recorded at 5 min          rivers gauged at this location will be consistent with runoff
intervals (Orpheus mini, OTT Germany) and stage height          computed as precipitation minus evapotranspiration.
was converted to flow (Q) using established relationships       Indeed annual runoff for the Cross river over the study
(Grant and Dawson 1997). The field drainage area at Site A      period was 785 mm yr-1, which is close the balance
could not be reliably determined with available digital         between precipitation and evapotranspiration of
elevation models (DEM) and so was estimated as the              790 mm yr-1. Annual runoff for the Inny river B was
annual drain discharge volume, divided by annual runoff         lower at 682 mm yr-1, however this river drains a much
for the study area, calculated as annual precipitation at       larger area (1108 km2) in which precipitation and PET
Malin Head minusPET for the site calculated according to        may differ compared to the site, and further this river is
Thornwaite and Mather (1955). This drain discharged to a        used for drinking water abstraction and passes through
stream with a catchment area of 38 ha (NASA 60 m DEM)           Lough Derravaragh which lies 35 km east of the study site
in which soils and land use were comparable to the field        with an area of c.7 km2. The agreement achieved between
drain. At Site B, a field ditch was selected for monitoring     computed and measured runoff at Site B tends to support
but the flat topography meant that a weir installation would    the accuracy and utility of the approach for computing
raise the site water table. Consequently a pressure             runoff at Site A, however we also present a sensitivity

                                                                                                                  123
C. D. Barry et al.

analysis of the derived exports rates using ±5 % alter-           each carbonate species using Henry’s Law, the law of mass
ations to the computed runoff rates.                              action, and the dissociation constants which are tempera-
                                                                  ture and ionic strength dependent. Thus in an aqueous
Sampling and laboratory analyses                                  solution in which the only titratable bases are bicarbon-
                                                                  ate/carbonate, alkalinity is related to the total inorganic C
Grab samples were taken from the field drains and steams          concentration by pH. In natural waters non-carbonate
at each site: fortnightly at Site A, and monthly at Site B        inorganic anions also contribute to alkalinity but generally
with in situ measurements of pH, conductivity and dis-            these are present in negligible quantities relative to car-
solved oxygen (Professional Plus series handheld meter,           bonates. However, in softer (low carbonate) humic waters
YSI USA). Sampling at Site A covered the 2012 and 2013            organic anions can appreciably contribute to alkalinity such
hydrological years, running from October to September             that total inorganic C determined from alkalinity can be
(2011–12, 2012–13), but only the 2012 hydrological year           overestimated (e.g. Cantrell et al. 1990). The potential
was sampled at Site B. Samples for dissolved organic C            contribution of organic anions to the sample alkalinities
(DOC) concentration were immediately filtered through             and the associated impacts on the computed DIC concen-
precombusted glass fibre filters (Whatman GF/C, nominal           trations and fluxes for the study sites are explored in the
pore size 1.2 lm) into precombusted, pre-rinsed 40 ml             discussion.
borosilicate glass vials, preserved with phosphoric acid and
stored refrigerated in the dark until analysis. Unfiltered        Flux estimation
samples were stored in the dark in 2L polyethylene con-
tainers for laboratory determination of Particulate Organic       Fluxes were calculated from flow-weighted mean concen-
C (POC) and alkalinity. DOC concentration was deter-              trations (FWMC) employing mean hourly flows/levels at
mined as non-purgeable organic carbon by combustion               the time of sampling according to ‘Method 5’ of Walling
(Shimadzu TOC-VCPH, Japan). Analysis of standards was             and Webb (1985). This method is recommended where
reproducible to within 2 % over 0–100 ppm. POC was                sampling frequency is low and where there is not a good or
determined in duplicate with means reported, by loss on           any discharge-concentration relationship, as was the case in
ignition at 550 °C for material retained on glass fibre filters   this study (Littlewood 1992). 95 % confidence limits for
(Whatman GF/C). The C fraction of organic matter was              flux estimates were computed following Hope et al. (1997).
taken as 0.468 (Dean 1974). POC was not determined for            Catchment scale fluxes at Site A employed mean hourly
samples in 2013 and concentrations for this period were           drain flows, while for Site B the mean daily flow record of
estimated as POC:DOC for 2012. The 1.2 lm distinction             the Cross river was employed.
between dissolved and particulate fractions is relatively            Fluvial C fluxes are compared with the component
large and was employed firstly as it allowed for filtration of    fluxes of the terrestrial C balance of these sites (determined
larger sample volumes and so collection of greater quan-          over the same measurement period) as given by Renou-
tities of particulate material which improved analytical          Wilson et al. (2014).
precision, and secondly because it would allow some pas-
sage of small particulate-bacterial aggregates to retain the      Labile organic C determination
microbial communities of these sites, although a stan-
dardised inoculum was also included as described below.           The Biological Oxygen Demand (BOD) of filtered samples
We did not systematically assess the impact of this rela-         (Whatman GF/C) was measured manometrically at 6 h
tively large filter pore size on the concentrations and so flux   intervals over 90 days in the dark at 20 °C (OxitopÒ,
estimates of DOC and POC, and consequently it is unclear          Xylem, USA). A detailed description of the method is
to what extent our results are comparable with studies            given by Reuschenbach et al. (2003). Nitrification was
employing a 0.7 lm filtration threshold between DOC and           inhibited by addition of allylthiourea and a manufacturer
POC. Crucially however our approach does not exclude              produced trace element and nutrient suite and microbial
any size fraction of the organic C export.                        inoculum was added to each sample. As DOC mineralisa-
    DIC concentration and speciation were computed                tion rates are determined in the dark at 20 °C with a
according to Stumm and Morgan (1996) from pH, con-                nutrient excess they are indicative of the potential for
ductivity, and temperature measured in situ, and alkalinity       remineralisation rather than being environmentally realis-
determined by Gran titration (MetrohmÒ, MEP Instru-               tic. Two sample blanks of Milli-QÒ water (Merck Milli-
ments). Briefly, dissolution of carbon dioxide establishes        pore, Germany) were run simultaneously with samples and
the carbonate equilibria which are pH dependent, so that          their BOD time series were subtracted from those of the
knowledge of the concentration (activity) of an individual        samples. As respiratory quotients (RQs) are known to vary
carbonate species allows calculation of the concentration of      above and below parity, oxygen demand was converted to

123
Fluvial carbon exports from Irish organic soils under pasture
C equivalence using a pragmatic RQ of 1 (del Giorgio and Results
Cole 1998; Berggren et al. 2012). The implications of this
RQ on the derived biodegradation rates are explored in the Hydrology
discussion.
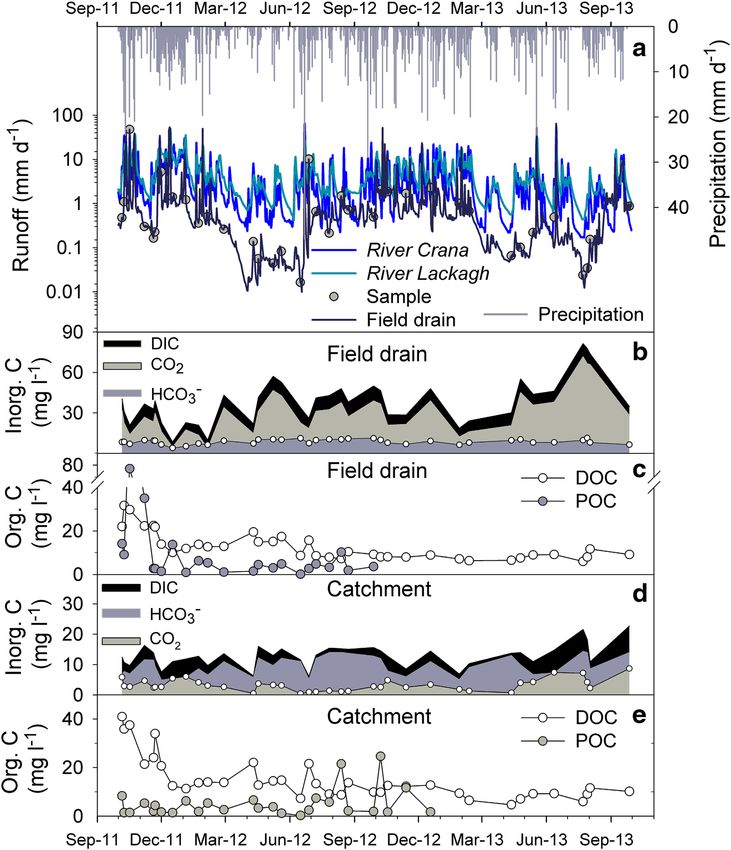
Precipitation was 17 and 10 % greater than the long term
Degradation kinetics average (LTA) at Sites A and B respectively in 2012 so
that predicted runoff values, calculated as precipitation
Bacterial consumption of simple organic compounds gen- less PET, were above the LTA by 26 % at Site A and
erally follows a first-order exponential decay, where the 35 % at Site B (Table 1). For the 2013 hydrologic year at
rate of biodegradation is proportional to the substrate Site A precipitation was close to the LTA (\3 %) so that
concentration that is described by Eq. 1 (Søndergaard and runoff was only 5 % above the LTA. The annual distri-
Middleboe 1995). butions of rainfall and runoff were similar at each site
(Figs. 1a and 2a). Flows for the Site A drain were sig-
BODt ¼ BODtot 1 expkt ð1Þ
nificantly correlated with the regional rivers at the 0.1 %
where BODtot is the total BOD, t is time and k is the rate level. Figure 1a shows that drain was particularly flashy
constant (d-1). with a Q5:Q95 of 90.
Equation 1 can be reformulated for DOC with a residual As the drainage area of the Site A drain in each year was
term (DOCr) which is refractory and remains unchanged estimated as the annual gauged discharge volume divided
over time, and DOCL is the labile C concentration (Eq. 2). by annual runoff estimated as precipitation minus PET, the
disparity in precipitation, PET, and discharge volumes
DOCt ¼ DOCL expkt þ DOCr ð2Þ
between the 2 years yielded catchment areas that differed
If however the DOCL consists of a range of compounds by c.1 ha (Table 1). The conventional approach whereby
with differing reactivity the time dependence of DOC flow routing using DEMs defines the total potential area
requires information on the reactivity distribution of the from which runoff may be generated (catchment area) does
organic matter present. This has been achieved by inte- not account for variable source hydrology and its impact on
gration of first-order exponential decay functions over the estimated solute export rates, which can be appreciably
reactivity distribution, assuming a continuous reactivity altered depending on the scale and area unit considered
distribution of compounds (Aris 1989). The reactivity (e.g. Thompson et al. 2012). Our approach normalises
continuum of rate constants (k) in Eqs. 1 and 2 can be fluxes against the area from which runoff was estimated to
formulated using the infinite-k range gamma distribution, be generated in each year and thus reduces the impact of
in which the exponential and power parts relate to labile variable runoff between years on export rates.
and more refractory fractions respectively (Boudreau and At Site B mean daily stage height was significantly
Ruddick 1991). By this approach the proportions of the correlated with mean daily runoff for the regional rivers at
initial C concentration over time (t) can be expressed as: the 5 % level. Runoff for the 2012 hydrologic year at this
site was estimated at 790 mm, close to that of the Inny
Ct a v
¼ ð3Þ River (785 mm). This agreement may reflect more con-
Co aþt
sistent precipitation and PET across this area which is
Where a is a rate parameter relating to the lifespan of relatively flat, and indeed mean runoff for this river is close
more labile compounds (days), and m relates to the shape of to that estimated as LTA precipitation minus PT for the
distribution as k ? 0, such that v describes the prevalence area (573 vs. 586 mm yr-1).
of refractory compounds; where v is equal to 1 all com-
pounds are equally reactive. The apparent initial first-order C concentrations and flux
decay coefficient, k, by the gamma distribution is v/a
(day-1) with v/(a ? t) describing the behaviour of k over Site A- non-calcareous
time (Boudreau and Ruddick 1991).
Equations 2 and 3 differ in their assumptions of the Samples were acquired over a range of flows including
proportion of OC matter that is reactive. Here we employ several storm events and on rising and falling limbs of
both models as the derivation of a labile proportion by event hydrographs, but there were no significant annual or
Eq. 2 has clear utility, while Eq. 3 provides a framework seasonal relationships between double log regressions of
for comparing the reactivity composition of organic matter concentration vs. flow suggesting that ‘method 5’ was
pools between samples. Model parameters for Eqs. 2 and 3 appropriate for calculating fluxes (Fig. 1a). Drain and
were derived using lme4 package version 1.1-7 in R (Bates catchment DOC concentrations were similar and correlated
et al. 2013; R Core Development Team 2012). at the 1 % level in both years (Fig. 1c, e). In 2013 both
123C. D. Barry et al.
Table 1 Summary of Site A Site B
hydrology and water chemistry
for the 2012 and 2013 2012 2013 2012
hydrologic years at the study
sites Discharge (10-3 m3) 35.7 21.4 nd
Precipitation (mm) 1254 1105 1154
pT % 0.28 0.33 0.32
pT (mm) 357 360 364
Runoff (mm) 897 745 790
Catchment area (ha) 3.98 2.87 nd
Drain samples (mean ± se)
pH 5.98 ± 0.4 5.81 ± 0.06 7.22 ± 0.12
Specific conductance (lS cm-1) 175 ± 3 154 ± 4 412 ± 39
Alkalinity (meq l-1) 0.73 ± 0.03 0.71 ± 0.03 4.02 ± 0.39
pCO2 (latm.) 40,148 ± 4676 56,509 ± 9155 12,371 ± 2628
Catchment samples (mean ± se)
pH 6.98 ± 0.07 6.85 ± 0.09 7.58 ± 0.08
Specific conductance (lS cm-1) 193 ± 8 180 ± 11 495 ± 27
Alkalinity (meq l-1) 0.80 ± 0.06 0.83 ± 0.07 4.54 ± 0.29
pCO2 (latm.) 4165 ± 763 6376 ± 971 5292 ± 2628
nd not determined
drain and catchment DOC concentrations were signifi- influences the precision of the derived export rates at Site A
cantly lower than in 2012 (t = 4.08, p \ 0.001 and via its impact on the computed drain catchment area; a 5 %
t = 3.5, p \ 0.01 respectively). DIC concentrations were discrepancy in the runoff rate alters the DOC and DIC
greater for the drain compared to the catchment due to export in 2012 by 0.95 and 1.0 g C m-2 yr-1 respectively,
higher CO2 concentrations so that DIC was a greater and by 0.3 and 1.0 g C m-2 yr-1 respectively in 2013.
fraction of the total C in drain samples (50–80 %) com-
pared to catchment samples (20–50 %) (Figs. 1b, d and 3). Site B- calcareous
Higher CO2 concentrations were recorded for the drain in
2013 compared to 2012 (t = 2.12, p \ 0.05). The pCO2 in There were no apparent relationships between sample C
samples from the drain were 12–177 times atmospheric in concentrations and stage height or river flows, and drain
2012, and 42–320 times atmospheric in 2013, but lower for and catchment DOC concentrations were relatively con-
stream samples at 2–23 and 3–37 times atmospheric sistent during periods of both high and low flow (Fig. 2c,
respectively. Alkalinity at Site A ranged from 0.3 to d). In contrast to Site A where drain DIC was dominated by
1.0 meq l-1. Drain POC concentrations in 2012 ranged CO2, at Site B DIC was predominantly as HCO3- at both
from 0.12 to 77 mg l-1 with median of 4.04 mg l-1 but scales. This was despite high levels of CO2 supersaturation;
there were no relationships with flow. Catchment POC the average pCO2 values for the drain and catchment
concentrations tended to be less than those from the drain samples were 32 (6–71) and 14 (5–24) times atmospheric
(median 2.6 mg l-1) while the maximum concentrations respectively. CO2 accounted for \10 % of total sample C
did not coincide with those from the drain (Fig. 1c, d). concentrations (Figs. 2 and 3). POC concentrations ranged
The total C flux from the drain was greater than for the from 0.4 to 7.6 mg l-1 for the catchment but were greater
stream principally due to the much larger export of CO2 for the drain at 0.7 to 22.9 mg l-1 however this disparity
(Table 2). The drain flux of total C was 29 % lower in 2013 may partly reflect disturbance by cattle watering upstream
compared to 2012, predominantly reflecting lower DOC of the drain. Alkalinity ranged from 2.89 to 9.24 meq l-1.
export (Table 2). The stream export in 2013 behaved As with Site A, the precision of the computed runoff rate
similarly with the total flux 45 % lower in 2013 due to influences the accuracy of the C export rates for Site B;
67 % lower DOC flux while the other constituent fluxes here a 5 % discrepancy in the computed runoff rate alters
were within 1 g C m-2 yr-1 of those in 2012. As previ- the DOC and DIC export rates for the drain in 2012 by 1.9
ously discussed, the precision of the runoff estimate and 2.2 g C m-2 yr-1 respectively.
123Fluvial carbon exports from Irish organic soils under pasture
Fig. 1 Timeseries of hydrology
(a) and inorganic C and organic
C concentrations for the field
drain (panels b, c) and wider
catchment (panels d, e) at Site A
covering the 2012 and 2013
hydrologic years
Estimates of C flux derived from landscape organic carbon 17.3 g C m-2 yr-1. Together these modifications for
rainfall C inputs and geologically derived C lower the total
Not all of the fluxes listed in Table 2 originate from ter- flux from the drain at Site B by 23 % to 69.5 g C m-2 yr-1
restrial organic matter. Firstly allowance is made for pre- and the catchment flux by 29 % to 43.4 g C m-2 yr-1. The
cipitation inputs of DOC, calculated as the product of combined effects of these corrections to the flux at Site A
precipitation and a rainfall DOC concentration of are much smaller due to the absence of a geologically
0.75 ± 0.2 mg l-1 (n = 2) consistent with Willey et al. derived DIC component; the drain fluxes were lowered by
(2000), which give inputs of 0.67 and 0.56 g C m-2 yr-1 only 2 % in 2012 and 2013 to 44.5 and 31.6 g C m-2 yr-1
for Site A in 2012 and 2013 respectively, and 0.59 g C m-2 respectively, and the catchment fluxes by 2.6 % in 2012
yr-1 for Site B in 2013. Inorganic C inputs from precipi- and 3.7 % in 2013 to 33.6 and 18.4 g C m-2 yr-1
tation, which largely reflect dissolution of atmospheric respectively.
CO2, are also small; sample equilibrium CO2 concentra- When these adjustments are made the net drain fluxes of
tions ranged from 0.2 to 0.3 mg l-1 and fluxes computed DIC estimated as derived from soil respiration at Sites A
by ‘method 5’ ranged from 0.16 to 0.23 g C m-2 yr-1. and B are nearly equal at c.23 g C m-2 yr-1. However the
Secondly the DIC flux at Site B is corrected for the con- same adjustments to the catchment scale DIC fluxes give a
tribution of geologic C inputs derived from dissolution of flux from Site B approximately double that from Site A.
carbonate limestone geology, where, assuming half of the This divergence at the larger spatial scale reflects the
alkalinity derives from geological carbonate, the total C substantially lower CO2 flux at the catchment scale from
exports from the drain and stream are lowered by 20.1 and Site A (lower by 11 g C m-2 yr-1) compared to Site B
123C. D. Barry et al. Fig. 2 Timeseries of hydrology (a), inorganic and organic C concentrations for the field drain (b, c) and wider catchment (d, e) at Site B covering the 2012 hydrologic year Fig. 3 Ternary plots for sample DOC, POC and DIC concentration (left) and DOC, CO2 and HCO3- concentration (right) 123
Fluvial carbon exports from Irish organic soils under pasture
Table 2 Summary of fluvial C fluxes (F; g C m-2 yr-1), 95 % Confidence Intervals (CI), and flux as percent total (%)
Site A drain 2012 Site A drain 2013 Site A catchment 2012 Site A catchment 2013 Site B drain 2012 Site B catchment 2012
F CI % F CI % F CI % F CI % F CI % F CI %
DOC 19.0 13.2 42 6.0 1.1 19 24.1 2.8 70 8.0 2.5 42 37.7 20.7 42 22.2 10.3 36
POC 6.4 11.2 14 2.0 0.4 6 1.8 9.7 5 1.7 0.5 9 7.9 8.6 9 2.0 2.1 3
DIC 20.0 15.3 44 24.4 13.9 76 8.6 6.4 25 9.5 5.5 50 44.7 33.6 49 37.3 11.2 61
CO2 13.6 13.2 30 18.6 12.9 58 2.4 3.2 7 3.0 2.8 16 4.4 4.3 5 2.5 1.6 4
HCO3 6.4 1.5 14 5.8 0.3 18 6.2 5.7 18 6.5 3.6 34 40.2 33.8 44 34.7 11.4 56
Total 45.4 32.3 34.5 19.1 90.4 61.5
-1 -1
F *10 = kg ha yr
(lower by \2 g C m-2 yr-1) which is indicative of lower compared to the exponential models, and Akaike Infor-
CO2 evasion losses at Site B due to the more highly buf- mation Criterion weights averaged -1059 ± 217 com-
fered carbonate system at this site which allows a large pared to -252 ± 70 indicating stronger statistical
fraction of the export of soil respiratory CO2 to masquerade performance (Table 3; Fig. 4a, b). Initial reactivities (k) for
as bicarbonate export. samples from Site A were generally [0.01 d-1, whereas,
with the exception of sample b3, samples from Site B
DOC biodegradation exhibited initial reactivities \0.01 d-1 indicating that
samples from Site A generally contained some matter with
Exponential model (Eq. 2) greater lability (Table 3; Fig. 4e, f). As with the expo-
nential model, rate constants declined more slowly for
The quantities of labile C (DOCL) were similar between samples from Site B (Fig. 4e, f). Indeed values for a, which
sites, but expressed as proportions of total DOC the labile indicate the mean life time of the more reactive compo-
fractions were lower for samples from Site B, where nents, averaged 2.1 ± 1.0 days at Site A compared to
mineralisation expressed as k in Eq. 2 occurred more 3.1 ± 0.9 days at Site B (Table 3). Values for v were low
slowly albeit at more consistent rates (Table 3). Labile at both sites indicating a large preponderance of refractory
DOC of samples from Site A ranged from 0.6 to 2.7 mg C matter. Means were 0.034 ± 0.008 and 0.023 ± 0.004 for
l-1, equivalent to 6–20 % initial DOC. The comparable Sites A and B respectively. Beyond day 10, reactivities
values for Site B were in the range 1.0–8.7 mg l-1 began to converge so that by day 50 rates were within
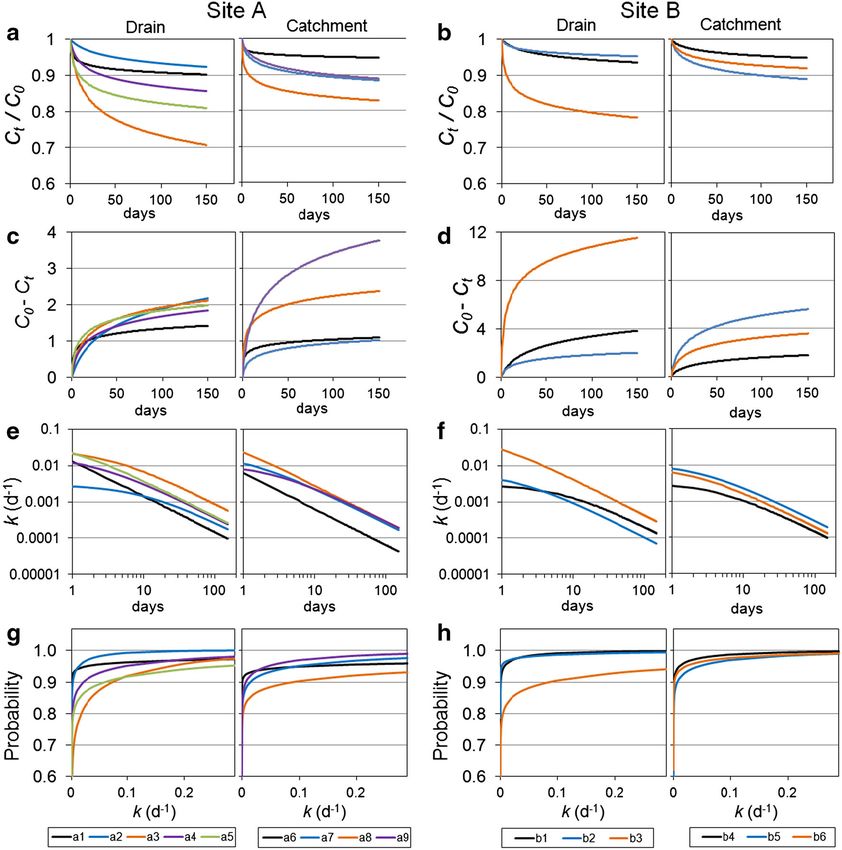
equivalent to 4–17 % of initial DOC. The highest value of 0.003 d-1 of each other despite having initially differed by
8.7 mg l-1 from Site B (sample b3) may be an outlier due 0.2 d-1 (Fig. 4e, f).
to manures entering the drain at a cattle watering access The probability distributions plotted in Fig. 4 are anal-
point upstream of the sampling point. At both Sites there ogous to the proportion of initial DOC liable to degrade at
were no consistent differences in DOC mineralisation rates below the respective rate value at curve intersec-
between samples from the drain and catchment scales. Rate tion. These indicate that DOC with reactivity [0.1 d-1
constants (k) ranged relatively widely with higher values accounted for 1–10 % of the initial DOC in samples from
indicative of more rapid consumption of a more reactive Site A, but only 1–2 % of initial DOC for samples from
pool with rapid transition to lower consumption rates Site B (excepting sample b3). Similarly DOC with a
associated with more refractory C, while lower values reactivity [0.001 d-1 accounted on average for 18 and
indicated more consistent consumption rates and lower 12 % of the initial DOC for Sites A and B respectively,
heterogeneity of the reactivity of the labile C. Rate con- corresponding to the bulk of the degradation observed
stants did not exceed 0.25 d-1 and k was lower on average during the incubation period. The large preponderance of
for Site B (0.27 ± 0.17 d-1 vs. 0.11 ± 0.03 d-1) indicat- refractory DOC (low v values) is consistent with the low
ing that the labile C content was consumed less rapidly fraction of labile C determined by the exponential model.
compared to samples from Site A. The probability distributions indicate that 70–80 % of
DOC would degrade at low rates \0.0001 d-1.
Reactivity continuum model (Eq. 3)
Implications for DOC export
Compared to the exponential model the reactivity contin-
uum model provided a superior fit to the data in all cases; The relatively low sample numbers limit capacity for
residual standard errors were factors of 10–60 lower examining the role of season or flow on DOC
123123
Table 3 Parameters for reactivity continuum and exponential models for DOC decay with time (days)
ID Site* Date Initial DOC Reactivity Continuum model (Eq. 3) Exponential model (Eq. 2)
(mg l-1)
a v Mean initial Initial resid. time AIC Residual DOCL DOCr Labile C K (d-1) AIC Residual
(days) k (d-1) (yrs; 1/k) SE (mg l-1) (mg l-1) (%) SE
a1 Ad 11/04/2011 14.4 0.13 0.01 0.113 0.02 -573 0.007 0.9 13.5 6 0.355 -146 0.10
a2 Ad 12/08/2011 28.2 9.51 0.03 0.003 0.92 -2460 0.005 2.1 26.1 7 0.019 -311 0.16
a3 Ad 13/08/2012 7.0 3.17 0.09 0.028 0.10 -1288 0.005 1.4 5.6 20 0.059 -556 0.05
a4 Ad 28/02/2012 12.6 2.10 0.04 0.017 0.16 -1029 0.006 1.4 11.2 11 0.039 -446 0.07
a5 Ad 23/08/2012 9.9 0.74 0.04 0.054 0.05 -2476 0.005 1.3 8.7 13 0.050 -645 0.09
a6 Ac 25/09/2011 20.9 0.03 0.01 0.209 0.01 -644 0.004 2.7 18.2 13 1.568 -85 0.14
a7 Ac 13/08/2012 8.6 1.21 0.03 0.021 0.13 -2760 0.005 0.6 8.0 8 0.063 -869 0.05
a8 Ac 23/08/2012 13.4 0.20 0.03 0.145 0.02 -990 0.005 1.4 12.0 10 0.165 -235 0.09
a9 Ac 22/11/2011 33.8 2.58 0.03 0.011 0.24 -230 0.007 2.4 31.4 7 0.082 64 0.25
b1 Bd 26/09/2011 52.9 6.93 0.02 0.003 0.89 -864 0.001 2.8 50.1 5 0.030 -205 0.06
b2 Bd 23/08/2012 34.0 1.77 0.01 0.006 0.44 -566 0.002 1.6 32.4 5 0.248 -34 0.12
b3 Bd 05/10/2011 50.0 0.51 0.04 0.084 0.03 -595 0.010 8.7 41.4 17 0.108 128 0.48
b4 Bc 26/09/2011 44.3 4.54 0.02 0.003 0.83 -925 0.001 1.8 42.5 4 0.039 -258 0.05
b5 Bc 01/08/2011 16.1 2.66 0.03 0.011 0.25 -307 0.004 1.4 14.7 9 0.083 -140 0.08
b6 Bc 23/08/2012 22.7 2.23 0.02 0.009 0.31 -179 0.003 1.0 21.7 4 0.173 -50 0.06
AIC Akaike Information Criterion
* Subscripts d and c to ‘Site’ denote drain and catchment samples respectively
C. D. Barry et al.Fluvial carbon exports from Irish organic soils under pasture
Fig. 4 Reactivity continuum model fits to experimental data. a, distributions. Curve identifications in legends refer to models and
b timeseries of DOC as proportion of initial DOC (Ct/C0; %); c, parameters given in Table 3 (note data extrapolated to 150 days for
d timeseries of DOC remineralised (C0–Ct; mg l-1); e, f: timeseries of a–f)
mean first-order decay coefficients (k); g, h: initial gamma reactivity
bioavailability, and no clear relationships with such 1 year to the DOC flux estimates in Table 2 indicates
parameters were found. Consequently the mean minerali- remineralisation for Site A DOC exports equivalent to 2.5
sation time course of DOC exported from the sites was and 0.8 g C m-2 yr-1 in 2012 and 2013 respectively for the
estimated from a reactivity continuum model employing Drain, and 3.1 and 1.0 g C m-2 yr-1 respectively for the
the mean values of a and v derived from all samples at each catchment, and for Site B in 2012, 3.4 g C m-2 yr-1 for the
site. Sample b3 was excluded from this computation due to Drain and 2.0 g C m-2 yr-1 for the catchment.
possible contamination with organic manure. For Site A
this approach (a, v = 2.19, 0.028) predicts DOC degrada-
tion as follows: 5 % at 10 days, 7 % at 1 month, 10 % at Discussion
3 months, 13 % at 1 year, and 17 % at 5 years. For Site B
(a, v = 3.63, 0.020) the comparable values were 3 % at Pasture on peat in Ireland covers an area of approximately
10 days, 4 % at 1 month, 6 % at 3 months, 9 % at 1 year, 2400 km2 that accounts for 3 % of the land area. Peatlands
and 12 % at 5 years. Applying the percent DOC loss at and organic soils altered by drainage to promote agriculture
123C. D. Barry et al.
are recognised as GHG emission hotspots within the EU, peatland in the U.K.. Our field scale fluxes are also close to
and consequently knowledge of their contemporary status estimates of biogenic DIC export of 8–24 g C m-2 yr-1
aids accurate assessment of national and regional GHG determined from soil pore water concentrations combined
inventories, while informing on the capacity for emission with leaching estimates, however these were from well
reduction with mitigation (Joosten et al. 2012; Renou- drained, more productive and lower C content soils in drier
Wilson et al. 2014). regions of Europe (Kindler et al. 2011).
The disparity between DIC flux estimates for the field
Magnitude and form of fluvial C exports and catchment scales at Site A, and to a lesser extent at Site
B, are consistent with catchment scale alterations of fluvial
Hope et al. (1994) reviewed DOC and DIC fluxes in the CO2 flux by evasion loss (Dawson et al. 2004). Although
range 1–10 g m-2 yr-1 for temperate and boreal zones but the characteristics of the field and catchment scales are
noted a paucity of information for CO2 and particulate C unlikely to have been identical, at Site A where drainage
fluxes. Subsequently it has been found that the upper range water was relatively soft, the difference between the two
of DOC fluxes from organic rich catchments is probably reflects prior CO2 evasion from the catchment
c.20–40 g m-2 yr-1 and that DIC, particularly as CO2, can stream. On this basis, a rudimentary estimate of the mean
be equivalent to an appreciable portion of net terrestrial CO2 evasion rate for the catchment stream above the
gaseous C exchange (Hope et al. 2001; Dawson and Smith sampling point at Site A can be made as the product of the
2007; Rowson et al. 2010; Butman and Raymond 2011; balance between the drain and catchment CO2 exports
Wallin et al. 2013 and references therein). POC has (11.2 and 15.6 g C m-2 yr-1 for 2012 and 2013 respec-
received renewed attention but estimates remain relatively tively; Table 2) and the catchment area (38 ha). From
poorly constrained due to predominant export during orthophotography the stream surface area above the sam-
transient hydrological events, which was also the case here pling point is approximately 800 m2 indicating mean
(Table 2; Cannell et al. 1999). At our sites POC fluxes annual evasion rates of 243 and 338 mg C m-2 d-1 for
were in the range 0.8–12 g C m-2 yr-1. The U.K. POC 2012 and 2013 respectively; these are within the range
fluxes summarised by Dawson and Smith (2007), largely reported for headwaters draining organic soils (64–477 mg
for C rich uplands, are typically 0.5–2.0 g C m-2 yr-1 but C m-2 d-1; Hope et al. 2001; Billett et al. 2004).
fluxes up to 31.7 g C m-2 yr-1 have also been reported. The contribution of dissolved organic matter to the
While our catchment scale fluxes were generally c.2 g C acidity and buffering capacity of freshwaters has been
m-2 yr-1, the drain fluxes were greater but more uncertain appreciated for several decades, particularly with respect to
with estimates of 6–7 ± 5 g C m-2 yr-1. surface water acidification (Perdue and Gjessing 1990).
Monitoring of DOC and DIC fluxes at various distances More recently the utility of Gran alkalinity for the com-
beyond soil–water interfaces has necessitated summation putation of DIC (and pCO2), as employed herein, has been
of fluvial fluxes with estimates of prior mineralisation and questioned due to potential for overestimation due to
evasion to arrive at actual landscape losses (e.g. Öquist contributions from non-carbonate sources of alkalinity,
et al. 2009; Dinsmore et al. 2010). Few previous studies notably organic anions in humic waters (e.g. Hunt et al.
have determined field scale C fluxes where the need to 2011). Organic anion contributions to Gran alkalinity in
account for prior DOC mineralisation and C evasion is humic lakes and streams have been determined in the range
largely precluded (Gibson et al. 2009; Rowson et al. 2010). 1.6–2.0 leq mg-1 DOC (Hedin et al. 1990; Kortelainen
The DOC losses of 12–48 g C m-2 yr-1 in this study are 1993; Roila et al. 1994). If such values are appropriate for
consistent with those reported for C rich temperate and the organic matter exported from our sites, then the
boreal catchments, particularly for areas receiving higher assumption of 1.75 leq organic alkalinity mg-1 DOC
precipitation ([1 m yr-1). Indeed Royer and David (2005) would mean organic anion contributions to the total alka-
detail DOC fluxes of only 0.3–2.3 g C m-2 yr-1 for tile- linity of samples taken from the drain at site A in 2012 and
drained, row-cropped agricultural catchments situated on C 2013 of 1.5–9.0 % (median 1.9 %) and 1.3–2.5 % (median
rich mollisols in Illinois USA where annual runoff seldom 2.2 %) respectively. The organic contribution to the alka-
exceeds \500 mm yr-1. The drain CO2 export rates for linity of drain samples at Site B was 1.4–4.1 % (median
Site A (13.6–18.6 g C m-2 yr-1) exceed reported DIC 1.9 %). These contributions do not alter the annual flux
fluxes, but are consistent with reported CO2 evasion rates estimates of DIC and CO2 flux beyond the 95 % confidence
of 1.6–14.1 g C m-2 catchment yr-1 (Hope et al. 2001; intervals reported in Table 2; at Site A the drain DIC fluxes
Wallin et al. 2013 and references therein). Rowson et al. in 2012 and 2013 were 20.0 and 24.5 g C m-2 yr-1, and
(2010) determined similar DOC and CO2 fluxes (29.4–85.8 CO2 fluxes were 13.6 and 18.7 g C m-2 yr-1respectively,
and 14.7–20.9 g C m-2 yr-1 respectively) to this study for but with the corrected alkalinity values these fluxes are
field scale monitoring (0.75 and 0.24 ha) within a disturbed reduced to 18.4 and 23.9 g C m-2 yr-1 and 12.6 and 18.3 g
123Fluvial carbon exports from Irish organic soils under pasture
C m-2 yr-1 respectively (\1.6 g C m-2 yr-1). Similarly annual drying and wetting regimes characterised by
for the Site B drain the 2012 DIC and CO2 fluxes were 44.7 autumnal DOC export peaks (Dawson et al. 2008). The
and 4.4 g C m-2 yr-1, but these were reduced to 43.8 and absence of such a relation in our dataset may reflect the
4.3 g C m-2 yr-1 using corrected alkalinities. Thus fluxes unusual hydrology over a relatively short measurement
computed using alkalinities corrected as above were within period, or potentially also the bias toward sampling at
1.6 g C m-2 yr-1 at both sites. lower flows. Seasonal peaks of DOC export are a charac-
Soil C and soil C:N typically explain high amounts of teristic of many headwater catchments and within peat-
variability in DOC exports between catchments and, as lands typically reflect mobilisation of DOC that was
argued by Aitkenhead-Peterson et al. (2005), such rela- produced rapidly under preceding warmer, drier and more
tionships probably represent aggregate measures of con- aerobic conditions with rewetting and so flushing (Bonnett
trols on DOC production and export by climatic, edaphic, et al. 2006; Worrall et al. 2007; Clark et al. 2009). The
biological and topographic catchment characteristics. Soil initial high DOC concentrations observed in late 2011 may
C:N at Sites A and B (17–21) are low but not markedly therefore reflect the relatively dry preceding summer of
different, but as DOC export from Site B was approxi- 2011 where precipitation was 8 % lower than the LTA. In
mately twice that of Site A the implication is that the nearly addition precipitation and river flows in the 4 months
double soil C content at Site B compared to A was the preceding the start of the study were below average so that
principal driver. Drier conditions at Site B, on the basis of the subsequent elevated concentrations of DOC are con-
much greater PET, also imply a greater propensity for DOC sistent with DOC flushing. By comparison, flows from June
production by virtue of more aerobic soil conditions. 2012 until late spring 2013 were relatively high with sev-
Although the field scale CO2 export from Site B was lower eral storm events which imply that the potential for aerobic
than Site A by c.10 g C m-2 yr-1, this difference is DOC production and accumulation for subsequent flushing
reversed when 50 % bicarbonate export is attributed to soil would have been much reduced compared to the same
respiration at Site B which implies greater soil respiration period beginning from summer 2011.
there. Indeed respiration appreciably exceeded Gross Pri-
mary Production (GPP) at Site B, but was similar to GPP at Fluvial C fluxes as components of terrestrial C
Site A (Fig. 5; Renou-Wilson et al. 2014). balances
Catchment and field scale CO2 fluxes at Site B were not
as dramatically different as at Site A, and the bicarbonate Net carbon balances that include fluvial components have
exports at each scale were also similar at Site B. The been constructed for several disturbed and undisturbed
implication is that biogenic DIC fluxes in situations of peatlands in the temperate and boreal zones (Roulet et al.
homogenous carboniferous geology behave conservatively 2007; Nilsson et al. 2008; Worrall et al. 2009; Dinsmore
due to bicarbonate buffering, so constraining evasion et al. 2010; Koehler et al. 2010; Rowson et al. 2010). For
fluxes. As weathering losses of atmospheric C are balanced such sites without considerable disturbance, these studies
by returns of volcanic CO2 at million year timescales, and indicate sinks in the range of -20 to -50 g C m-2 yr-1
by ocean carbonate precipitation at millennial timescales, with fluvial fluxes equivalent to 34–46 % of the net ter-
increased weathering rates combined with low inorganic C restrial C balances (gaseous exchange of CO2 and
evasion losses will result in increased ocean storage CH4 ? rainfall DOC) with DOC fluxes alone equivalent to
(Beaulieu et al. 2012). 14–37 %. Thus compared to DOC, fluvial CO2 fluxes and
evasion have generally accounted for smaller fractions of
Inter-annual variability at Site A the net terrestrial C balances of undisturbed temperate
peatland systems, however this was not the case at our
In 2013 annual field and catchment scale DOC fluxes from sites.
Site A were approximately three times lower than in 2012 The component fluxes of the terrestrial C balance of the
when precipitation was 17 % above the LTA (Table 2). study sites given by Renou-Wilson et al. (2014) are shown
Notably peak DOC concentrations were observed at both in Fig. 5 for comparison with the fluvial C fluxes. This
drain and catchment scales at the start of the 2012 hydro- shows that biomass removals simulating the grazing
logic year in October and November 2011 but comparable intensity of the sites were considerable loss terms, without
peaks were not observed at the start of the 2013 hydrologic which the terrestrial balance (i.e. without fluvial fluxes
year although flows were similar for samples in each of incorporated) at Site A would have been a sink for c.-30 g
these years (Fig. 1). Pronounced intra-annual seasonality of C m-2 yr-1, and so close to neutral when the fluvial C
DOC export has been determined for several Scottish export is incorporated. Thus fluvial fluxes were equivalent
catchments with temperature and hydrology identified as to close to 100 % of the net terrestrial balance at Site A
the principal drivers, and notably with catchments with when the biomass off take is excluded. Site B differed from
123C. D. Barry et al. Fig. 5 Net Ecosystem Carbon Budgets (g C m-2 yr-1) for Site A (2012 and 2013) and Site B (2012). Component terrestrial fluxes from Renou-Wilson et al. (2014); RS Respiration, GPP Gross Primary Production; CH4- L livestock enteric methane emission, Biomass simulated grazing off take, Rain DOC in precipitation, [eq.CO2 above saturation CO2. Standard errors are given in parentheses Site A in that terrestrial respiration exceeded primary nevertheless within the range of these literature values. production by a greater margin (233 g C m-2 yr-1) and How representative the individual annual values for Site B combined with higher fluvial C exports and biomass are of the long term status of this site is unknown, however removal, the net ecosystem carbon balance was a source of that precipitation and runoff were appreciably greater than 600 g C m-2 yr-1. Biomass removal accounted for 60 % of long term averages in 2012 suggests that fluvial exports this balance, so that with or without this loss term Site B may be lower on average. was a net C source before addition of fluvial exports (Fig. 5). DOC bioavailability These sites clearly differ from the studies of peatlands previously referred to with respect to elevation, drainage The C dynamics of areas of high soil organic C are of modification and land use (vegetation and grazing inten- interest for national and global C and greenhouse gas sity) while studies of pastures on drained organic soils have inventories, particularly for their potential to remineralise not incorporated fluvial fluxes. Couwenberg (2011) and return significant quantities of C to the atmosphere. reviewed C emissions from several temperate drained Fluvial organic C fluxes are of interest in this respect as organic soils under pasture in the range 410–760 g C m-2 their magnitude and dynamics can reflect exports of C fixed yr-1. Biomass exports at our study sites were at the low decades to millennia earlier. end relative to these studies, but the absence of fluvial loss The gamma reactivity continuum model is among the terms indicates that C emissions from the wetter, nutrient most parsimonious of models applied to degradation time poor Site A were much lower than reported in the literature series. Furthermore, as there is no strict definition as to to date for similar sites. Indeed without the biomass what distinguishes labile and refractory organic matter the removal terms the C status of Site A is close to neutral and associated gamma reactivity distributions present a useful analogous to the net C status of undisturbed upland tem- means for comparing DOC reactivity. Koehler et al. (2012) perate peatlands. The overall C balance at Site B was used gamma model probability distributions to partition 123
Fluvial carbon exports from Irish organic soils under pasture
DOC among three reactivity classes: the fractions degraded components likely to be present in natural freshwaters.
at k [ 0.01 day-1, 0.001 \ k \ 0.01 day-1, and Comparing the reactivity distributions of the stream and
-1
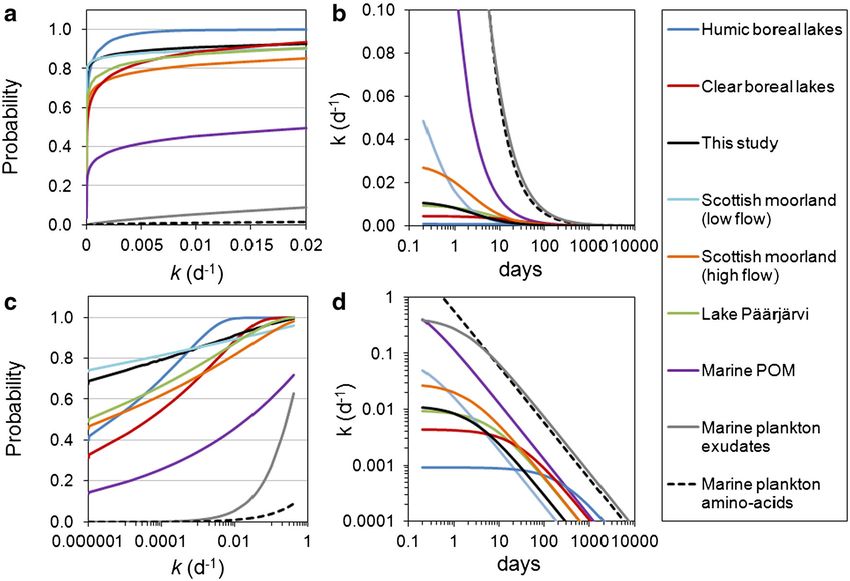
k \ 0.001 day . Figure 6 shows the probability (reactiv- lake waters highlights the variable, but consistently very
ity) distributions of gamma model fits and associated time- low abundance of such compounds relative to the bulk of
dependence of mean first-order decay coefficients for the much less reactive organic matter. For example, matter
mean model derived for this study, and for a range of C with reactivities [0.01 d-1 account for only 0.8–20 % of
mass loss studies of freshwater dissolved organic matter dissolved organic matter in these stream and lake samples
(DOM) (headwater streams and boreal lakes). Also plotted (Fig. 6a, c) which is degraded over the first 10 days
are model fits to C mass loss timeseries of marine partic- (Fig. 6b, d). Degradation rates \0.01 day-1 for these
ulate organic matter, plankton exudates, and amino-acids samples accounted for variable fractions of initial DOM,
from plankton exudates. Together these plots illustrate the but notably the reactivity distributions of the mean model
spectrum of reactivities for natural organic matter, and by fit to our data, and that of a Scottish moorland headwater
inference reactivity dependence on substrate chemical stream sampled at low flow (Stutter et al. 2013) are very
quality, as widely described for example by C:N (del similar, and much less reactive relative to other freshwater
Giorgio and Cole 1998; Hunt et al. 2000). samples. Wide disparity between the reactivity distribu-
Figure 6 shows that more than 50 % and up to 99 % of tions of DOM samples taken at high and low flow from the
the marine organic fractions, which consist of recently Scottish moorland highlight the role of seasonality and
produced matter, were degraded at rates [0.01 day-1. hydrology as controls on the composition and quality of
These are indicative of the reactivity of the most labile DOM exports (Ågren et al. 2008; Stutter et al. 2013). In
Fig. 6 Initial reactivity distributions (a, c) and mean first-order decay v = 6.43, 0.06); ‘Marine POM’ is fit by Boudreau and Ruddick
coefficients over time (b, d) for gamma model fits to literature data (1991) (a, v = 0.113, 0.125) to oxic degradation data of marine spring
sources. ‘Humic’ and ‘Clear boreal lakes’ are means of a, v fitted by bloom plankton (mainly diatoms) of Westrich and Berner (1984);
Koehler et al. (2012) to dissolved organic matter (DOM) degradation ‘Marine plankton exudates’ and ‘Marine plankton amino-acids’ are,
(humic: a, v = 251, 0.23; clear: a, v = 25, 0.11); ‘This study’ firstly, the fit to degradation data for of exudates (\0.7 lm) from
represents the average a, v of samples (a, v = 2.44, 0.03), ‘Scottish concentrated marine plankton ([50 lm; largely diatoms) (a,
moorland’ are fits to degradation data of DOM from a Scottish peaty v = 1.67, 0.73), and secondly, the fit to degradation of amino-acids
moorland stream sampled at high and low flow (Stutter et al. 2013) (a, v = 0.03, 0.58) extracted from these exudates as given by Davis
(high flow a, v = 2.1, 0.06; low flow a, v = 0.18, 0.02); ‘Lake and Benner (2007)
Päärjärvi’ is fit to DOM degradation by Vähätalo et al. (2010) (a,
123You can also read