MACQUARIE MINING FORUM - 29 JUNE 2018 SCOTT MCQUEEN - EVP & CFO - OCEANAGOLD
←
→
Page content transcription
If your browser does not render page correctly, please read the page content below
MACQUARIE
MINING FORUM
29 June 2018
Scott McQueen – EVP & CFO

CONSISTENTLY DELIVERING ON COMMITMENTS

INNOVATION I PERFORMANCE I GROWTH
2
Cautionary and Technical Statements
Cautionary Notes - Information Purposes Only
The information contained in this presentation is provided by OceanaGold Corporation (“OGC”) for informational purposes only and does not constitute an offer to issue or arrange to issue, or the solicitation of an offer to issue,
securities of OGC or other financial products. The information contained herein is not investment or financial product advice and has been prepared without taking into account the investment objectives, financial situation or
particular needs of any particular person. The views, opinions and advice provided in this presentation reflect those of the individual presenters only. No representation or warranty, express or implied, is made as to the fairness,
accuracy, completeness or correctness of the information, opinions and conclusion contained in this presentation. To the maximum extent permitted by law, none of OGC or any of its directors, officers, employees or agents
accepts any liability, including, without limitation, any liability arising out of fault or negligence, for any loss arising from the use of the information contained in this presentation. Furthermore, this presentation does not constitute
an offer of shares for sale in the United States or to any person that is, or is acting for the account or benefit of, any U.S. person (as defined in Regulation S under the United States Securities Act of 1933, as amended (the
"Securities Act")) ("U.S. Person"), or in any other jurisdiction in which such an offer would be illegal. OGC’s shares have not been and will not be registered under the Securities Act.

Cautionary Statement Concerning Forward Looking Information
Certain information contained in this presentation may be deemed “forward-looking” within the meaning of applicable securities laws. Forward-looking statements and information relate to future performance and reflect OGC’s
expectations regarding the generation of free cash flow, execution of business strategy, future growth, future production, estimated costs, results of operations, business prospects and opportunities of OGC and its related
subsidiaries. Any statements that express or involve discussions with respect to predictions, expectations, beliefs, plans, projections, objectives, assumptions or future events or performance (often, but not always, using words
or phrases such as “expects” or “does not expect”, “is expected”, “anticipates” or “does not anticipate”, “plans”, “estimates” or “intends”, or stating that certain actions, events or results “may”, “could”, “would”, “might” or “will” be
taken, occur or be achieved) are not statements of historical fact and may be forward-looking statements. Forward-looking statements are subject to a variety of risks and uncertainties which could cause actual events or results
to differ materially from those expressed in the forward-looking statements and information. They include, among others, the accuracy of mineral reserve and resource estimates and related assumptions, inherent operating
risks, and those risk factors identified in OGC’s most recent annual information forms prepared and filed with securities regulators which are available on SEDAR at www.sedar.com under OGC’s name.
There are no assurances OGC can fulfil forward-looking statements and information. Such forward-looking statements and information are only predictions based on current information available to management of OGC as of
the date that such predictions are made; actual events or results may differ materially as a result of risks facing OGC, some of which are beyond OGC’s control. Although OGC believes that any forward-looking statements and
information contained in this presentation are based on reasonable assumptions, readers cannot be assured that actual outcomes or results will be consistent with such statements. Accordingly, readers should not place undue
reliance on forward-looking statements and information. OGC expressly disclaims any intention or obligation to update or revise any forward-looking statements and information, whether as a result of new information, events or
otherwise, except as required by applicable securities laws. The information contained in this release is not investment or financial product advice.

Technical Disclosure
The Mineral Resources for Didipio were prepared by, or under the supervision of, J. G. Moore, whilst the Mineral Resources for Macraes were prepared by S. Doyle. The Mineral Reserves for Didipio were prepared under the
supervision of M. Holmes, while the Mineral Reserves for Macraes were prepared by, or under the supervision of, K Madambi. The Mineral Resources and Reserves for Haile were prepared by, or under the supervision of,
Joshua Snider, P.E., Erin Paterson, P.E., Lee “Pat” Gochnour, M.M.S.A., John Marek, P.E. and Carl Burkhalter, P.E. The Mineral Reserves and Resources for Waihi were prepared by, or under the supervision of, T. Maton, P.
Church and D. Bertoldi. Each of the aforementioned persons is a “Qualified Person” for the purposes of NI 43-101. M. Holmes, S. Doyle, K. Madambi, J. G. Moore, T. Maton and P. Church are Members and Chartered
professionals with the Australasian Institute of Mining and Metallurgy and each is a “qualified person” for the purposes of NI 43-101. D. Bertoldi is a fellow of the Australasian Institute of Mining and Metallurgy and is a “qualified
person” for the purposes of NI 43-101. Messrs Holmes, Doyle, Madambi, Moore, Maton, Church and Bertoldi have sufficient experience, which is relevant to the style of mineralisation and type of deposits under consideration,
and to the activities which they are undertaking, to qualify as Competent Persons as defined in the 2012 Edition of the “Australasian Code for Reporting of Exploration Results, Mineral Resources and Ore Reserves” (“JORC
Code”).
The resource estimates for the El Dorado property were prepared by Mr. Steven Ristorcelli, C.P.G., of Mine Development Associates, Reno, Nevada (who is an independent Qualified Person as defined in NI 43-101) and
conforms to current CIM Standards on Mineral Resources and Reserves.
For further scientific and technical information (including disclosure regarding mineral resources and mineral reserves) relating the Macraes Operation, the Didipio Operation, the Waihi Gold Operation and the Haile Gold Mine
Project, please refer to the NI 43-101 compliant technical reports available at sedar.com under the Company’s name. For further scientific and technical information (including disclosure regarding mineral resources and mineral
reserves) relating to the El Dorado property, please refer to the reports publicly available on SEDAR (www.sedar.com) prepared for Pacific Rim Mining Corp.

General Presentation Notes
All AISC and cash costs are net of by-product credits unless otherwise stated
All financials are denominated in US Dollars unless otherwise stated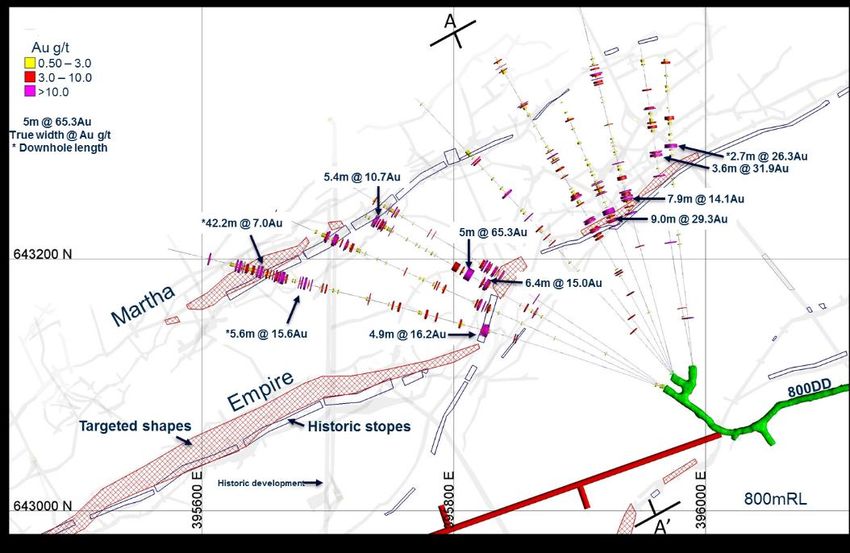
3
Strategy

   DRIVE EFFICIENCY THROUGH                BOOST PERFORMANCE via NEW
   TECHNICAL EXCELLENCE &                  TECHNOLOGIES (e.g. Analytics,
   LEADERSHIP                                             Automation)

                               OCEANAGOLD
                              VALUE CREATION

   ADVANCE ORGANIC GROWTH              CONTINUED GEOGRAPHIC & ASSET
   OPPORTUNITIES                                    DIVERSIFICATION

                        EFFECTIVE MANAGEMENT &
  HIGH QUALITY ASSETS                               ROBUST BALANCE SHEET
                             ORGANISATION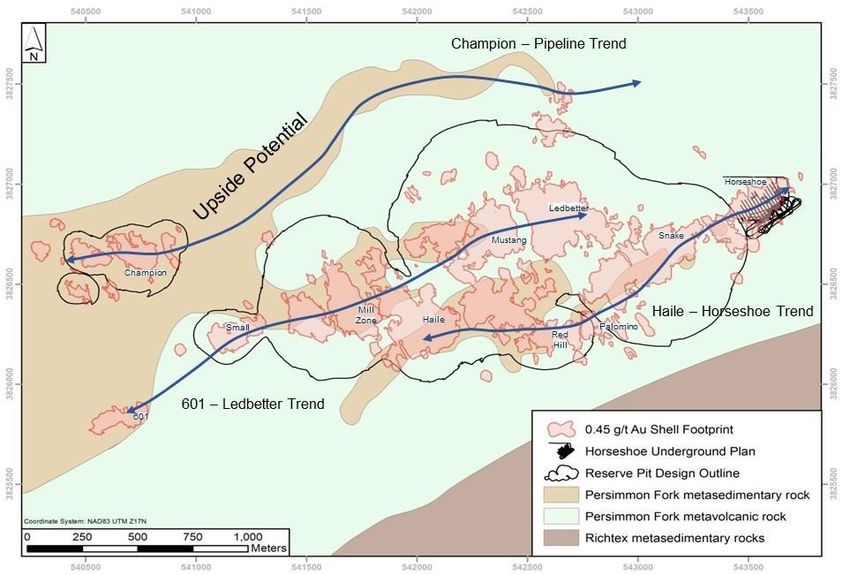
4
    Updated 2018 Guidance
                                                CONSOLIDATED
          Gold Production                           Copper Production                      All-In Sustaining Costs
        500,000 – 540,000                           15,000 – 16,000                         US$725 – US$775
              ounces                                     tonnes                                  per ounce

HAILE                       DIDIPIO                               WAIHI                    MACRAES

                            PRODUCTION:
PRODUCTION:                                                        PRODUCTION:              PRODUCTION:
                            95,000 - 105,000 oz Au
140,000 - 155,000 oz Au                                            75,000 - 85,000 oz Au    190,000 - 200,000 oz Au
                            15,000 – 16,000 t Cu

AISC:                       AISC:                                  AISC:                    AISC:
$725 - $775 / oz sold       $260 - $310 / oz sold                  $750 - $790 / oz sold    $900 - $1,000 / oz sold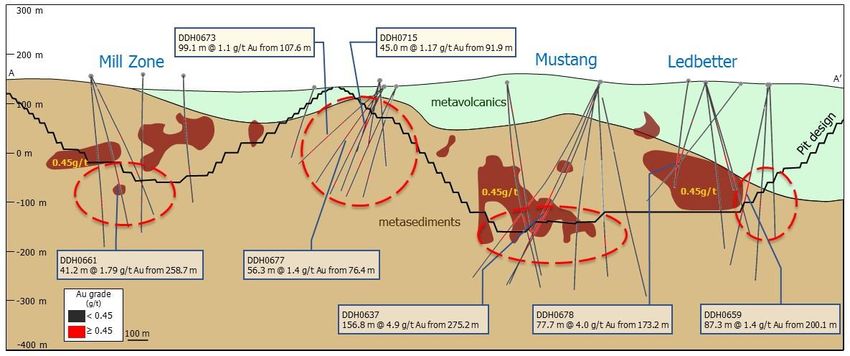
5
     Advancing Organic Growth
                       SOLID PIPELINE OF ORGANIC VALUE CREATING OPPORTUNITIES

WAIHI   (LOM: 2019+)        HAILE   (LOM: 2033+)   DIDIPIO (LOM: 2032+)   MACRAES   (LOM: 2021+)

 ADVANCING 10-YEAR            ADVANCING              UNDERGROUND           UNLOCKING
 MINE LIFE EXTENSION          EXPANSION PROJECT      RAMPING UP            ADDITIONAL VALUE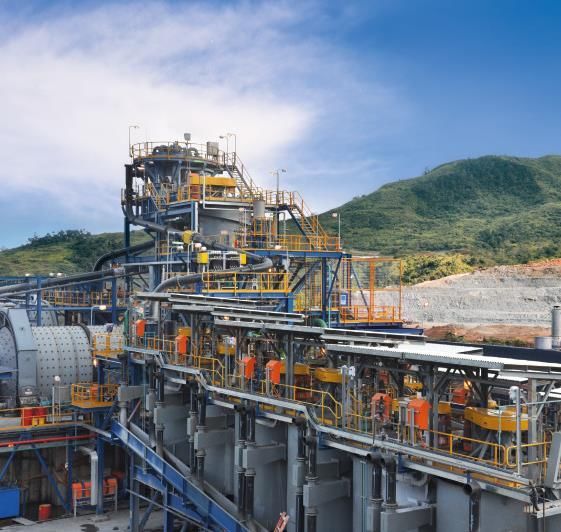
6
                    Advancing Waihi Mine Life Extension
                                                                                                                       PERMITTING OF 10-YEAR MINE LIFE EXTENSION
                                                                                                                       UNDERWAY

                                                                                                                       CONTINUED SIGNIFICANT DRILL RESULTS LEADING
                                                                                                                       TO EXPECTED RESOURCE EXPANSION

                                                                                                                       MAIDEN RESOURCE(1) OF 110,000 OZ (2) AT
                                                                                                                       GLADSTONE ANNOUNCED

                                                                                                                       DRILLING AT MARTHA AND OTHER SITES TO
                                                                                                                       CONTINUE OVER NEXT 18 MONTHS

1.   Total Gold Resource including Measured & Indicated and Inferred. See OceanaGold 2017 AIF for additional details
2.   Resources includes 98,000 oz. Au Indicated and 12,000 oz Au Inferred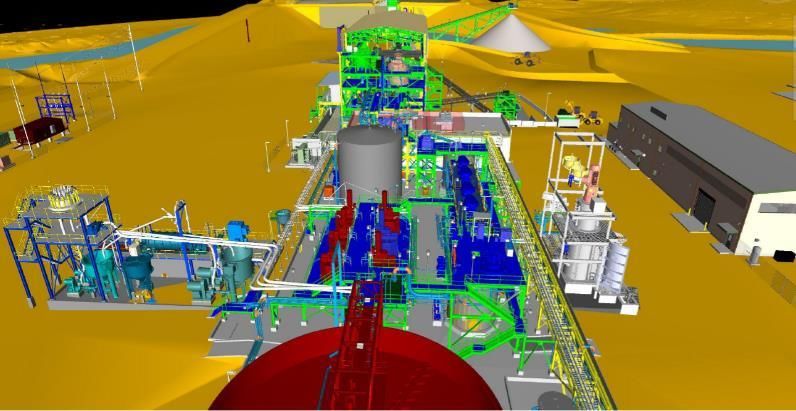
7
                    Significant Waihi Exploration Results Continue
                                                                                                  DRILLING FROM TWO U/G DRILL DRIVES BENEATH
                                                                                                  MARTHA PIT YIELDING POSITIVE RESULTS

                                                                                                  RECENT SIGNIFICANT INTERCEPTS OF MARTHA
                                                                                                  AND EMPIRE VEINS(1)

                                                                                                  ▶   5.0 metres @ 65.3 g/t gold, 100 g/t silver
                                                                                                  ▶   9.0 metres @ 29.4 g/t gold, 288 g/t silver
                                                                                                  ▶   3.6 metres @ 31.9 g/t gold, 477 g/t silver
                                                                                                  ▶   4.4 metres @ 19.8 g/t gold, 30 g/t silver

                                                                                                  DRILLING TESTING VEINS ALONG 3,200 METRE
                                                                                                  STRIKE, OVER 500 METRE VERTICAL RANGE

1.   Refer to OceanaGold news release dated 11 June 2018 for additional details and information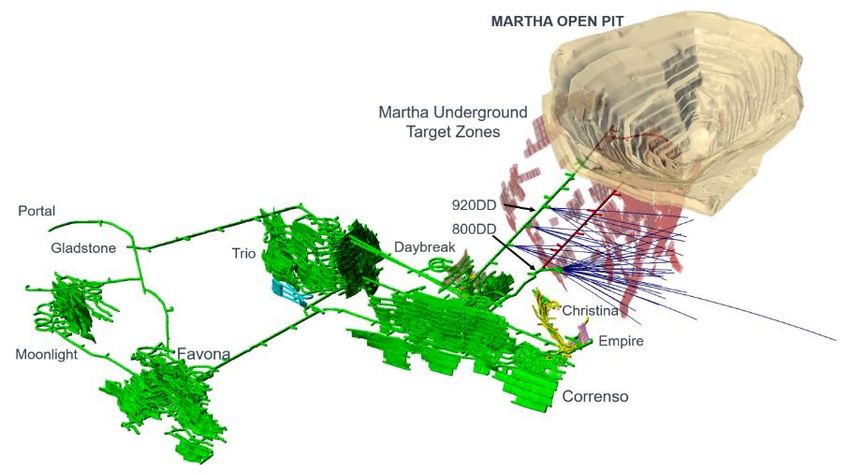
8
Regional Exploration
COROMANDEL GOLD DISTRICT PRODUCTION >12 MOZ AU, 52 MOZ AG
Tenements
Dome Field
North
Dome Field
South
Ohui
Thames Twin Hills White
Bluffs
Glamorgan
Golden Cross
Hauraki WKP Currently drilling
(WKP)
Karangahake WAIHI
0 km 20
WAIHI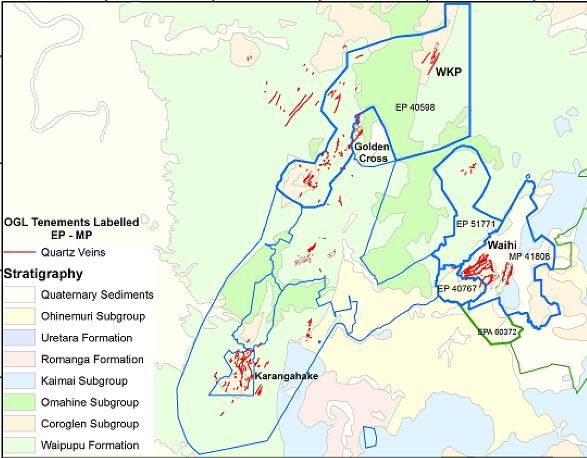
9
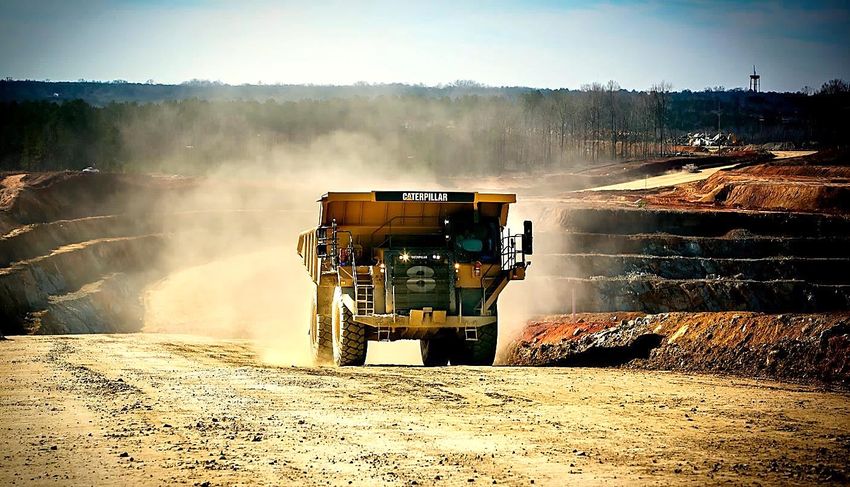
Advancing Haile Expansion
HAILE PLANT UPGRADES UNDERWAY
PERMITTING OF UG, MINING EXPANSION COMMENCING MID/2018
EXPANSION EXPECTED TO DELIVER INCREASED MINE
LIFE(1)
INCREASE OF PLANT THROUGHPUT UP TO TARGETED 4.0
MTPA – UNDERWAY
CURRENTLY INSTALLING PEBBLE CRUSHER – EXPECTED IN
OPERATION IN Q4/18
UPGRADE REGRINDING CIRCUIT TO ENHANCE
RECOVERIES – Q1/19
1. Refer to Haile 43-101 Technical Report located at www.oceanagold.com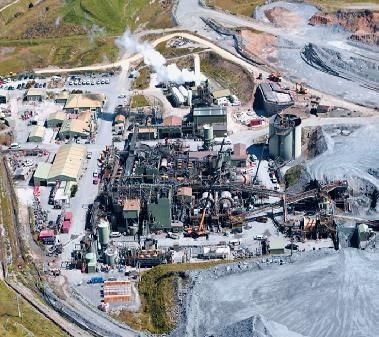
10
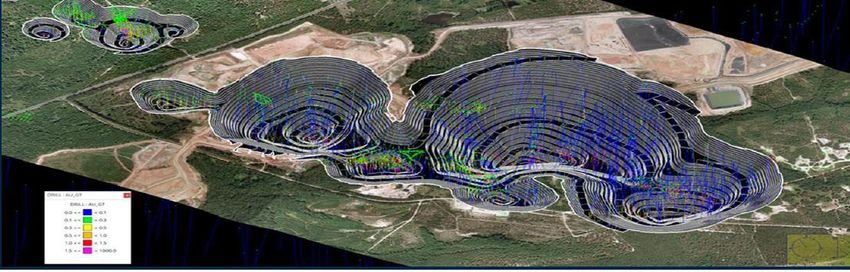
Haile Mineralisation Trends
BETTER UNDERSTANDING OF GEOLOGIC FORMATIONS RESULTING IN ENHANCED TARGET GENERATION11
New Drill Targets at Haile
DRILLING FOCUS AND RESULTS REFLECT POTENTIAL RESOURCE EXTENSIONS BETWEEN PITS, AT DEPTH AND
ALONG STRIKE12
Market Divergence
AUSTRALIAN GOLD MINERS HAVE SIGNIFICANTLY OUTPERFORMED NORTH AMERICAN PEERS
MARKET PERFORMANCE
150
OceanaGold ASX Gold Index TSX Gold Index Gold Spot
ASX GOLD
140
+ 37.0%
130
SPOT GOLD
120 + 9.5%
110 TSX GOLD
100
- 4.7%
OGC
90
- 10.3%
80
70
Note: Updated 24th June 201813
Solid Margins & Returns
PROVEN TRACK RECORD OF CONSISTENT RETURNS
EBITDA MARGIN* RETURN ON INVESTED CAPITAL*
OceanaGold Peer Average OceanaGold Peer Average
60% 20%
50%
15%
40%
30% 10%
20%
5%
10%
0% 0%
-10%
2011 2012 2013 2014 2015 2016 2017 -5%
2011 2012 2013 2014 2015 2016 2017
*Source: Bloomberg14
Comparatives
EV / RESERVES & RESOURCES(1) RESERVE LIFE(2)
EV/Reserves EV/Resources
$900 14
$800
12
$700
10
$600
8
$500
US$/oz
Years
$400
6
$300
4
$200
2
$100
$0
0
OceanaGold Regis Evolution Northern Star
OceanaGold Regis Northern Star Evolution
Source:
(1) RBC Research
(2) Barclays Research15
Free Cash Flow Comparative
SIGNIFICANT FREE CASH FLOW GENERATION CONTINUES AT OCEANAGOLD
FREE CASH FLOW YIELD COMPARATIVE (2)
FREE CASH FLOW YIELD(1)
(2018E) 2018E 2019E
10% 14%
9%
12%
8%
7% 10%
6%
8%
5%
6%
4%
3% 4%
2%
2%
1%
0% 0%
OGC Mid-Tier Avg Senior Avg OceanaGold Northern Star Regis Evolution
Source:
(1) CIBC Research
(2) RBC Research16
Consistent Profitability
Net Income – GAAP (5-Yr Total) Adjustments (5-Yr Total) Net Income - Adjusted (5-Yr Total)
($USM) ($USM) ($USM)
Randgold $1,228 $0 $1,228
Centerra $516 $184 $700
OceanaGold $425 $186 $611
Northern Star $403 $44 $447
Regis Resources $273 $188 $462
Tahoe $153 $199 $352
Saracen ($10) $37 $27
Evolution ($40) $154 $114
M&A Adjustments
Agnico ($176) $755 $579
St Barbara ($177) $285 Impairment $108
Detour ($244) $4 Income Tax Charge (Benefit) ($240)
Alamos ($631) $487 ($144)
Other
B2 Gold ($652) $785 $133
Endeavour ($683) $748 $65
Gold Fields ($730) $1,110 $380
New Gold ($980) $895 ($207)
IAMGOLD ($1,345) $979 ($366)
Eldorado ($2,081) $2,143 $62
AngloGold ($2,401) $3,569 $1,168
Newmont ($2,582) $5,537 $2,955
Yamana ($3,494) $3,385 ($108)
Kinross ($5,056) $4,533 ($522)
Newcrest ($6,964) $8,396 $1,432
Goldcorp ($8,211) $8,329 $118
Barrick ($13,512) $17,363 $3,339
Source: Barclays and Bloomberg, data as of May 3, 2018.
Note: Bloomberg adjustments were combined into the following groups: M&A Adjustments (Disposal of Assets, Sale of Business, and Sale of Investments), Impairment (Asset Write-Down, and Impairment of Goodwill), Income Tax Charge/Benefit,
Other (Unrealized Investments, Abnormal Derivatives, Merger Expense, Restructuring Expense, Legal Settlement, Insurance Settlement, Early Extinguishment of Debt, and Other Abnormal Items).17
Relative Valuation(1)
PRICE TO NAV(2) EV TO EBITDA PRICE TO CFPS
Intermediate producer average North American Peers Intermediate producer average
2 9 14
8
12
7
1.5
10
6
5 8
1
4 6
3
4
0.5
2
2
1
0 0 0
OceanaGold Regis Northern Star Evolution OceanaGold Regis Northern Star Evolution OceanaGold Regis Northern Star Evolution
Source:
(1) Canaccord
(2) RBC Capital Markets18
2018 Priorities
ON TRACK TO ACHIEVE 2018 GUIDANCE
GENERATE STRONG CASH FLOWS AND DELIVER ON ORGANIC GROWTH INITIATIVES
OPERATIONS GROWTH
▶ Continuing improvement of safety leadership ▶ Advancing the Waihi extension plans
▶ Identifying and implementing productivity ▶ Advancing the Haile expansion plans
improvements and cost reductions ▶ Continuing development and ramp-up of
▶ Seeking out innovation opportunities Didipio Underground
EXPLORATION FINANCIAL
▶ Near-mine drilling at Haile ▶ Maintain strong balance sheet
▶ Proving up significant Resource at Waihi ▶ Focusing on capital allocation and discipline
▶ Identifying and advancing greenfield ▶ Continuing to deliver strong return on
exploration targets invested capitalCorporate Headquarters Americas Corporate Office
Level 14, 357 Collins Street 777 Hornby Street Suite 1910
Melbourne, Victoria, 3000 Vancouver, British Columbia
V6Z 1S4
Australia
Canada
PO Box 355, E: info@oceanagold.com
Flinders Lane Post Office
Melbourne, Victoria, 3000
Australia
T: +61 3 9656 5300
F: +61 3 9656 5333
E: info@oceanagold.com
oceanagold.comYou can also read